INTRODUCTION
Sponges occupy widely divergent biogeographic regions. This may be a testament to their ability to colonize over long distances, or their ability to adapt and evolve to suit changing environments. Yet the mechanisms whereby they do this, in particular the relative importance of both sexual and asexual reproduction strategies, is largely unknown for many sponges. Sponges found on seamounts are isolated, submerged and independent offering an opportunity to test various possibilities.
Sponges are known to use both sexual and asexual reproductive strategies to survive and prosper (Kaye, Reference Kaye and Rützler1990) and both sexual and asexual components to enable long-range dispersal and colonization of new habitats (see overview in Maldonado & Riesgo, Reference Maldonado and Riesgo2008). Active locomotion of entire individual sponges has been observed in response to environmental factors (Bond & Harris, Reference Bond and Harris1988; Maldonado & Uriz, Reference Maldonado and Uriz1999b), but such an ability, used to readjust the sponge position at the microhabitat scale (displacements from millimetres to centimetres) cannot account for population dispersal. Dispersal of sexual stages is generally assumed to involve the transmission of a sexual form, such as detached tissue still undergoing post fertilization development (Maldonado & Uriz, Reference Maldonado and Uriz1999b), sperm and eggs, or a swimming or crawling larval stage that lasts for only a few days (Maldonado & Riesgo, Reference Maldonado and Riesgo2008). These are potentially transmitted via currents, waves, storms or using vectors such as fish or echinoderms. Asexual reproduction has also been observed and includes abiotic factors such as physical fragmentation (Wulff, Reference Wulff1991) and biotic factors such as fission, budding (e.g. Teixido et al., Reference Teixido, Gili, Uriz, Gutt and Arntz2006; Ereskovsky & Tokina, Reference Ereskovsky and Tokina2007) and gemmule formation (Sarà et al., Reference Sarà, Cerrano and Sara2002). Both strategies have been shown to occur in individual sponges concurrently (Leong & Pawlik, Reference Leong and Pawlik2010) or successionally (Ereskovsky & Tokina, Reference Ereskovsky and Tokina2007). It is the sponges' ability to use both of these strategies synergistically, that improves their dispersal ability (Maldonado & Uriz, Reference Maldonado and Uriz1999a). The formation of external buds of hexactinellids in the stable environment of Antarctic waters (Teixido et al., Reference Teixido, Gili, Uriz, Gutt and Arntz2006) may enable the formation of a stable clonal population in the immediate vicinity. The formation of gemmules generally associated with freshwater sponges also occur in some marine sponges (Sarà et al., Reference Sarà, Cerrano and Sara2002). However, these gemmules are expected to have dispersal abilities on par with sexual propagules. The formation of bubble-like buds in Oscarella spp. (Ereskovsky & Tokina, Reference Ereskovsky and Tokina2007) and Leucetta changosensis Dendy, 1913 (Wörheide et al., Reference Wörheide, Epp and Macis2008) shows a previously unnoticed far-reaching asexual dispersal mechanism. Merging of conspecific sponges (Wulff, Reference Wulff and Rützler1990) also provides another possible asexual reproduction mechanism which is not usually accompanied by meiotic recombination but carried out by totipotent somatic cells in sponges.
Colonization of new locations by asexual stages may, alternatively, be more commonly due to the dispersal of fragments or entire sponges, via waves, currents, storms and cyclones, or as a passenger on substrates such as debris. There are several characteristics that may indicate an asexual or clonal population including frequent recovery of genotypes, correlation between different independent markers, linkage disequilibrium and the absence of sexual reproductive structures. Direct observation of deep sea sponge dispersal is not currently feasible, although observations indicate it can be done at great expense (Teixido et al., Reference Teixido, Gili, Uriz, Gutt and Arntz2006). In other sessile invertebrates such as corals, asexual reproduction is common and is an adaptation that succeeds both in moderate to high levels of disturbance (Le Goff-Vitry et al., Reference Le Goff-Vitry, Pybus and Rogers2004; Miller & Ayre, Reference Miller and Ayre2004) and stable environments (Foster et al., Reference Foster, Iliana and Mumby2007) as it enables well-adapted individuals (Ayre & Willis, Reference Ayre and Willis1988) to rapidly colonize environments or maintain dominance in environments unfavourable for sexual reproduction (Wulff, Reference Wulff1991; Hughes et al., Reference Hughes, Ayre and Connell1992). Branching corals, which have relatively fragile morphology, are more likely to have high asexual components (Le Goff-Vitry et al., Reference Le Goff-Vitry, Pybus and Rogers2004) than more stable massive corals (Foster et al., Reference Foster, Iliana and Mumby2007). By contrast, the coral excavating sponge Cliona delitrix Pang, 1973 was shown to not have clonal propagation, as was expected, resulting from coral breakage (Zilberberg et al., Reference Zilberberg, Maldonado and Solé-Cava2006b).
Research has been carried out exploring the contributions of sexual and asexual recruitment on sponges from physical observations (Battershill & Bergquist, Reference Battershill, Bergquist and Rützler1990; Wulff, Reference Wulff1991). However, other indirect methods to assess the relative input of sexual and asexual reproductive forms in the dispersal process have been used including histocompatibility (Neigel & Avise, Reference Neigel and Avise1983), allozymes (Zilberberg et al., Reference Zilberberg, Solé-Cava and Klautau2006a; Whalan et al., Reference Whalan, De Nys, Smith-Keune, Evans, Battershill and Jerry2008), mitochondrial DNA such as CO1 sequence data (Duran et al., Reference Duran, Giribet and Turon2004a; Whalan et al., Reference Whalan, De Nys, Smith-Keune, Evans, Battershill and Jerry2008; Dailianis et al., Reference Dailianis, Tsigenopoulos, Dounas and Voultsiadou2011), microsatellites (Duran et al., Reference Duran, Pascal, Estoup and Turon2002, Reference Duran, Pascal, Estoup and Turon2004c; Blanquer et al., Reference Blanquer, Uriz and Pascal2005), introns (Bentlage & Worheide, Reference Bentlage and Worheide2007; Wörheide et al., Reference Wörheide, Epp and Macis2008) and nuclear ribosomal internal transcribed spacer (ITS) sequence data (Lopez et al., Reference Lopez, Peterson, Willoughby, Wright, Enright, Zoladz, Reed and Pomponi2002; Wörheide et al., Reference Wörheide, Hooper and Degnan2002a, Reference Wörheide, Degnan, Hooper, Reitner and Moosab; Duran et al., Reference Duran, Giribet and Turon2004a; Nichols & Barnes, Reference Nichols and Barnes2005; Duran & Rützler, Reference Duran and Rützler2006; Hoshino et al., Reference Hoshino, Saito and Fujita2008). Within an individual sponge, the multiple copies of the ITS have been suggested to be not yet homogenized by concerted evolution (Duran et al., Reference Duran, Giribet and Turon2004a). However, intra-genomic polymorphisms (IGPs) within individual sponges have been detected in about half of sponge species tested (Duran et al., Reference Duran, Giribet and Turon2004a; Wörheide et al., Reference Wörheide, Nichols and Goldberg2004). This indicates that the variation occurring within individuals may be responsible for much of the variation attributed to different species, genera and even families. Indeed in phylogenetic studies the populations should always be screened before phylogenetic comparisons are carried out between different taxa. Other researchers have also detected ITS polymorphisms ranging from single base changes (Lopez et al., Reference Lopez, Peterson, Willoughby, Wright, Enright, Zoladz, Reed and Pomponi2002), several nucleotides (Duran et al., Reference Duran, Giribet and Turon2004a) and variable sites (Schmitt et al., Reference Schmitt, Hentschel, Zea, Dandekar and Wolf2005) through to examples of up to 13 sequence types per individual (Wörheide et al., Reference Wörheide, Nichols and Goldberg2004). Intra-genomic variation is the presence of multiple genotypes within an individual sponge. However, it may also be an example of multiple sponges forming of chimeras (Blanquer & Uriz, Reference Blanquer and Uriz2011).
Population research in sponges has largely concentrated on biogeography (Nichols & Barnes, Reference Nichols and Barnes2005), the movement of species into or out of the Mediterranean Sea (Duran et al., Reference Duran, Giribet and Turon2004a), survival in the South Pacific (Wörheide et al., Reference Wörheide, Hooper and Degnan2002a) and ecological specialization (Duran & Rützler, Reference Duran and Rützler2006). Much of the work on sponge population genetics has shown genetic differentiation at geographic scales (Klautau et al., Reference Klautau, Russo, Lazoski, Boury-Esnault, Thorpe and Solé-Cava1999; Duran et al., Reference Duran, Giribet and Turon2004a, Reference Duran, Pascual and Turonb; Bentlage & Worheide, Reference Bentlage and Worheide2007; Hoshino et al., Reference Hoshino, Saito and Fujita2008; Wörheide et al., Reference Wörheide, Epp and Macis2008; Xavier et al., Reference Xavier, Rachello-Dolmen, Parra-Velandia, Schönbeg, Brewer and Van Soest2010); for a review see Uriz & Turon (Reference Uriz and Turon2012). By comparison, only a small amount of research has been carried out on small scales as would occur on a seamount. Two Mediterranean studies on Crambe crambe (Schmidt, 1862) (Calderon et al., Reference Calderon, Ortega, Duran, Becerro, Pascal and Turon2007) and Scopalina lophyropoda Schmidt, 1862 (Blanquer et al., Reference Blanquer, Uriz and Caujape-Castells2009) showed genetic structure at this small scale consistent with what one would expect from a poorly dispersing sexual stage, although this result could be confused by the presence of chimeric individuals (Blanquer & Uriz, Reference Blanquer and Uriz2011). Seamounts have been predicted to have large amounts of population structure because of spatial separation and limited dispersal mechanisms coupled with high levels of asexual reproduction (Richer de Forges et al., Reference Richer de Forges, Koslow and Poore2000; Samadi et al., Reference Samadi, Bottan, Macpherson, Richer de Forges and Boisselier2006). Seamounts are believed to be particularly susceptible to genetic drift due to their small size (Le Goff-Vitry et al., Reference Le Goff-Vitry, Pybus and Rogers2004). Seamounts are not ephemeral and, coupled with low gene flow due to distance and hydraulics, structure within populations would be expected (Samadi et al., Reference Samadi, Bottan, Macpherson, Richer de Forges and Boisselier2006). However, research on crustaceans collected from New Caledonian seamounts showed that previous perceived high endemism (Richer de Forges et al., Reference Richer de Forges, Koslow and Poore2000) was not the case for seamounts. Instead the crustaceans had high levels of gene flow between the seamounts. The only exception in fact was a gastropod that had limited larval dispersal (Samadi et al., Reference Samadi, Bottan, Macpherson, Richer de Forges and Boisselier2006).
This study focuses on three rare, deep and isolated species of lithisitid (‘rock’) sponges from deep seamounts in New Caledonia that are several million years old (Richer de Forges et al., Reference Richer de Forges, Koslow and Poore2000), Neoaulaxinia zingiberadix (Kelly, Reference Kelly2007), Isabella mirabilis (Schlacher-Hoenlinger et al., Reference Schlacher-Hoenlinger, Pisera and Hooper2005) and Neoschrammeniella fulvodesmus (Lévi & Lévi, Reference Lévi and Lévi1983). Lithistids on these seamounts may be relict fauna from the Mesozoic Era (Lévi, Reference Lévi, Reitner and Keupp1991), surviving on refuge habitat (Samadi et al., Reference Samadi, Schlacher, Richer de Forges, Pitcher, Horato, Hart, Clark, Hagger and Santos2007). Lithistids are found in most parts of the world at great depths. They are believed to be long lived and slow growing and, as such, display K reproductive strategies such as ovipary (Reiswig, Reference Reiswig1973; Fromont & Bergquist, Reference Fromont and Bergquist1994). Lithistid sponges constitute a polyphyletic collection of disparate families and genera grouped together by the common presence of desmas. However, the latter remains significantly unresolved based on morphology, and still awaits independent datasets to support or refute morphometric hypotheses (e.g. Pisera & Lévi, Reference Pisera, Lévi, Hooper and Van Soest2002). Indeed because lithistids represent an artificial group split into several unrelated orders (Schuster et al., Reference Schuster, Erpenbeck, Pisera, Hooper, Bryce, Fromont and Wörheide2015), it is likely there will be varying reproductive strategies within the lithistids. Only one study on reproduction in lithistids has been reported (Maldonado & Bergquist, Reference Maldonado, Bergquist and Young2002; Maldonado & Riesgo, Reference Maldonado and Riesgo2008). and this is based purely on studies from Theonella, which has been recently revised to Astrophorida (Hall et al., Reference Hall, Ekins and Hooper2014). The one study indicated the Theonella is gonochoric and oviparous which means they release zygotes or early embryos that develop externally (Maldonado & Bergquist, Reference Maldonado, Bergquist and Young2002; Maldonado & Riesgo, Reference Maldonado and Riesgo2008). However, these reproductive modes are more likely to be strategies to suit the current environmental conditions (Ereskovsky, Reference Ereskovsky2010). Lithistids have been reported to have either parenchymella or clavablastula larval types, with free swimming planktonic or crawling demersal larval stages (Hooper & Van Soest, Reference Hooper and Van Soest2002). Some of the larval stages are thought to survive for only a few hours and up to 3 weeks (Maldonado & Bergquist, Reference Maldonado, Bergquist and Young2002). However, other astrophorid sponge genera Thoosa and Alectona produce an uncilliated hoplitomella larvae, which shows great dispersal characteristics, using its protruding spicules to float for long periods of time (Maldonado & Bergquist, Reference Maldonado, Bergquist and Young2002; Borchiellini et al., Reference Borchiellini, Alivon and Vacelet2004; Maldonado, Reference Maldonado2004; Bautista-Guerrero et al., Reference Bautista-Guerrero, Carballo and Maldonado2010). The sexual structures and larval stages have not been observed for the three species used in this research. However, because of the limited dispersal characteristics of sponge larvae in general, sponge populations have been thought to have local low genetic variability, high genetic structure and incipient species (Jablonski, Reference Jablonski1986; Jackson, Reference Jackson1986; Wörheide et al., Reference Wörheide, Solé-Cava and Hooper2005). Nonetheless, due to the large dispersal characteristics of some deep sea astrophorids, these lithistids may indeed have greater dispersal characteristics but require specific environmental conditions to survive that may occur only on deep seamounts.
The depths from which the lithistid sponges used in this study are recovered (270–1032 m depth range) would have enabled survival during the glacial ice age without having to move down the slope to colder deeper water. In addition, these populations are unlikely to have suffered disturbance from human activities, few surface climatic effects, little predation, and since they are on seamounts they are unlikely to have been affected by continental erosion. The main aim of this research is to evaluate if there are discrete populations of these three lithistid species on different seamount ‘islands’ up to almost 200 km apart, with the abyssal floor between these seamounts at 4000 m depth. Previous research on fauna from seamounts has found highly localized species distributions and apparent speciation between island groups or ridge systems in the south-western Pacific (Richer de Forges et al., Reference Richer de Forges, Koslow and Poore2000). This research is the first attempt to investigate if specimens of an individual sponge species from different seamounts belong to genetically distinct populations (genotypes), or are truly widespread as their present taxonomy suggests. Further we will use direct (i.e. genotypes) and indirect (i.e. linkage disequilibrium) tests to measure the relative components of sexual and asexual reproduction within this species of sponge.
MATERIALS AND METHODS
Sampling, DNA extraction and sequencing
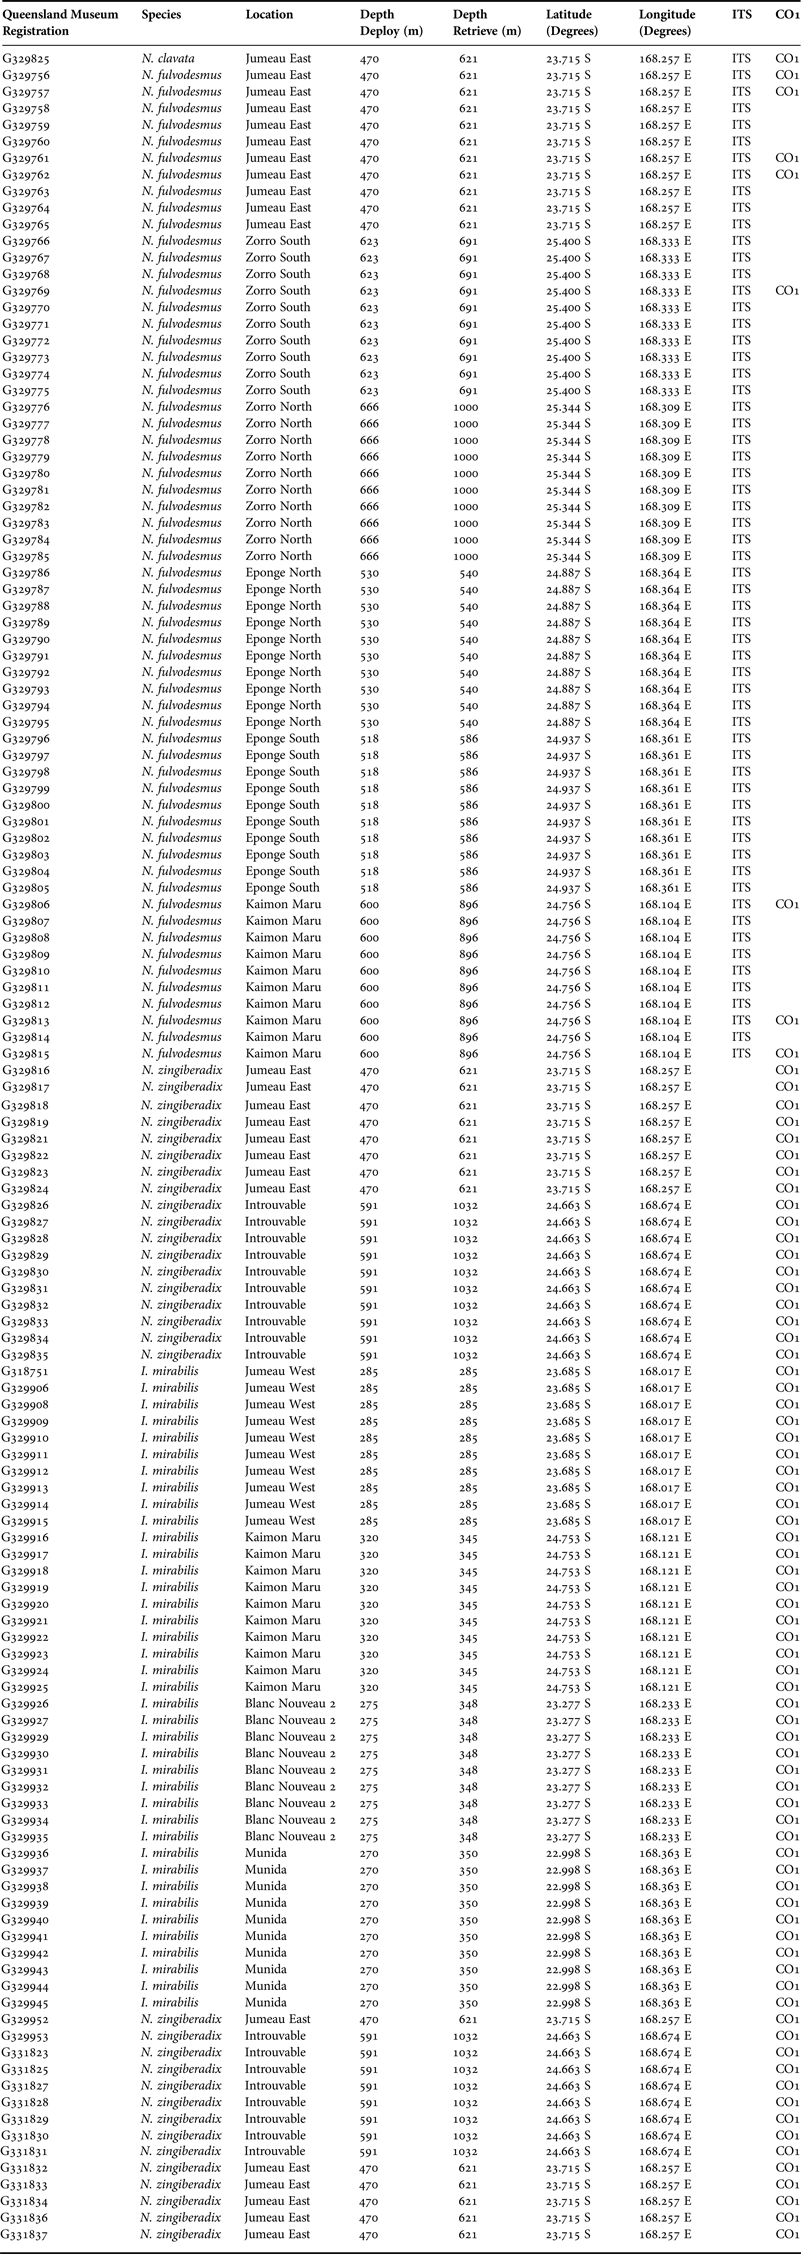
The lithistid specimens sponges were collected by dredge from deep seamounts off New Caledonia across 10 sites at depths ranging from 270 to 1032 m. The only specimens collected by trawling of up to 14 km transect length were the specimens from Eponge North. The sponges were frozen immediately following collection. All specimens were registered at the Queensland Museum, registration numbers between QM G329756 to QM G331837 (Table 1). The species were identified morphologically by soaking thin tissue section in Histo-Clear II (National Diagnostics, USA) for 24 h before mounting in Histomount (National Diagnostics, USA), and examined under an Olympus BH-1 light microscope. Spicules were dissociated by dissolving sponge tissue in boiling nitric acid, rinsed in water and resuspended in absolute ethanol. They were then either mounted in Durcupan ACM (Sigma-Aldrich, Australia) and examined under an Olympus BH-1 light microscope, or ignited on an SEM stub and examined using a Hitachi H1000 SEM.
List of the species and the collection data of all of the specimens used in this study.

For molecular work, samples from 131 specimens were taken by cutting a 5 mm3 section of sponge tissue from the middle of the specimen. DNA was extracted using a DNAeasy® Tissue Kit (Qiagen, Australia) according to the manufacturer's instructions. The ribosomal internal transcribed spacer (ITS) region, including the entire ITS1, 5.8S rRNA and ITS2 regions, was amplified using primers RA2: GTCCCTGCCCTTTGTACACA and ITS2.2: CCTGGTTAGTTTCTTTTCCTCCGC. PCR amplifications were carried out in a 25 μL volume reaction, with 1 unit of HotmasterTaq ® (Eppendorf), 200 μM of mixed dNTPs and 10 μM of each primer. Reaction conditions consisted of a denaturing step of 2 min at 95°C, 35 cycles of 20 s at 95°C, 10 s at 58°C, and 1 min at 65°C, followed by a final extension of 10 min at 65°C. The PCR product was electrophoresed on a 0.5% agarose gel for 1 h at 90 volts, the single band excised, and the 1 kb product purified using Perfectprep Gel Cleanup kit (Eppendorf, Germany). The PCR product was then cloned using pDrive Vector (Qiagen) following the manufacturer's instructions, modified to half concentration, i.e. ½X reaction and the addition of 800 μL of 37°C SOC during transformations. Successful recombinants were selected and grown in liquid culture and plasmid DNA isolated via alkaline lysis minipreps (Sambrook et al., Reference Sambrook, Fritsch and Maniatis1989). Between two and seven plasmids per specimen were sequenced directly in 12 μL reactions containing 3 μL of 5× BigDye Terminator Buffer (Applied Biosystems, Australia), 0.8 μM of either M13F or T7 universal primer, 200 ng of plasmid DNA, and 1 μL Big Dye Terminator Mix v3.1 (Applied Biosystems, Australia). Reactions were denatured for 5 min at 94°C, followed by 30 cycles of 10 s at 96°C, 5 s at 50°C, and 4 min at 60°C. The sequencing reactions were precipitated using 75 μL of a 70% ethanol solution with 0.0002 M MgSO4 and centrifuged at 3600 rpm for 15 min before the supernatant was discarded. Sequencing was carried out on an ABI 3730 × 196 capillary automated DNA sequencer. Sequences were aligned using Sequencher™ 4.5 (Genecodes) and BIOEDIT 7.0.4.1 (Hall, Reference Hall1999).
CO1 data has been obtained during the barcoding of the Queensland Museum sponge collection in the course of the Sponge Barcoding Project (www.spongebarcoding.org) (Wörheide & Erpenbeck, Reference Wörheide and Erpenbeck2007). The DNA extraction followed a plate-based extraction method (Vargas et al., Reference Vargas, Erpenbeck, Schuster, Sacher, Büttner, Schätzle and Wörheide2010). Fragments of CO1 standard barcoding fragment were amplified using the degenerated barcoding primers dgLCO1490 and dgHCO2198 (Meyer et al., Reference Meyer, Geller and Paulay2005) with annealing temperature of 43°C. The PCR products were purified with ExoSAP-IT (Affymetrix) or standard Ammonium Acetate-Ethanol precipitation before cycle sequencing both strands with the Big Dye Terminator Mix v3.1 (Applied Biosystems, Australia) following the manufacturer's protocol and sequencing on an ABI 3730 automated sequencer. The poriferan origin of the sequences was checked by a BLAST search against the NCBI GenBank nr database (http://www.ncbi.nlm.nih.gov/). Sequences were base called and assembled to a 563 bp alignment in CodonCode Aligner v3.7.1.1 and subsequently aligned in Sea-View 4 (Galtier et al., Reference Galtier, Gouy and Gautier1996) using Muscle 3.6 (Edgar, Reference Edgar2004). Sequences are published in NCBI GenBank (Acc. No. KR270646-KR270725) and in the Sponge Barcoding Database (www.spongebarcoding.org).
Analyses of genetic variation
Genetic diversity was expressed as nucleotide diversity (π; the probability that two randomly chosen homologous nucleotides differ) and gene diversity (h; the probability that two randomly chosen genotypes differ), and calculated in Arlequin 3.1 (Excoffier et al., Reference Excoffier, Laval and Schneider2005). The hierarchical distribution of genetic diversity was analysed in the AMOVA framework (Analysis of Molecular Variance) also using Arlequin 3.1, where genetic variation was partitioned into within-individual, among-individual within-population, and among-population components. Significance of variance components was assessed using 10 000 randomizations. Within-individual variation was included as a variance component due to the presence of IGPs. Pairwise F STs between sampled populations were calculated in Arlequin 3.1. To indirectly assess the contribution of sexual vs asexual modes of reproduction, we examined levels of linkage disequilibrium, where high levels indicate either non-random sexual reproduction (inbreeding) or asexual reproduction. Linkage disequilibrium was calculated in Arlequin 3.1 (Excoffier et al., Reference Excoffier, Laval and Schneider2005). Analyses of the three lithistid species were carried out independently. Sequencing of the ITS was only carried out for N. fulvodesmus. The CO1 fragment of N. fulvodesmus was only sequenced on eight individuals to detect if there was any variation within this species, while all collected I. mirabilis and N. zingiberadix were screened.
Phylogenetic analyses
Maximum likelihood reconstructions were performed with RAxML-7.2.5 (Stamatakis, Reference Stamatakis2006) under the GTR + GAMMA model of substitution. Branch support was inferred with 1000 rapid bootstrap replicates.
RESULTS
Neoschrammeniella fulvodesmus
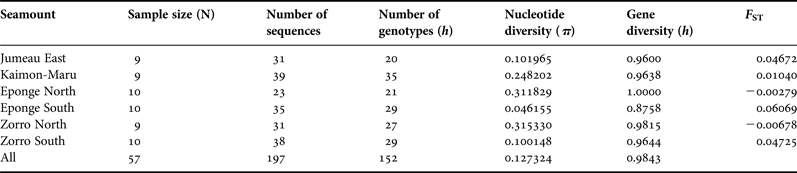
A total of 114 ITS genotypes were recovered from the 57 specimens (Table 2). A higher number of genotypes, and higher gene and nucleotide diversities were found for ITS1 than for ITS2 and 5.8S. There were 24 nucleotide differences in the 5.8S rRNA section, with only six single base changes found in the 5.8S region. One sequence had two of these changes and only two sequences shared the same change and they were from different seamounts. Overall gene diversity was high (h = 0.9843) when compared with nucleotide diversity (π = 0.127324).
Comparison of diversities and F STs of N. fulvodesmus calculated from ITS on the seamounts in order of increasing latitude.
Six of the 114 genotypes were found in a single specimen. In two of the 57 specimens, only one plasmid was successfully sequenced. Of the remaining 55 individuals for which multiple sequences were obtained, 52 (94.5%) exhibited intra-genomic polymorphism, with between two and six genotypes present within an individual specimen.
An AMOVA looking at the individuals and the variation within each individual shows 84.57% of the variation is within the individuals, compared with 15.66% between the individuals within each seamount (Table 3). The most common genotype occurred 14 times and 63 genotypes occurred only once.
AMOVA results of the entire ITS sequence of N. fulvodesmus between seamounts, between individuals within seamounts and within individuals.
The AMOVA for all of the populations and for the entire sequence including ITS1 and ITS2 indicates that virtually all of the variation (97.38%) is contained within each seamount (Table 4).
AMOVA results of the entire ITS sequence of N. fulvodesmus between seamounts and within seamounts.
Most of the genotypes (71/114) were found on a single seamount, with the number of unique genotypes ranging from six at Zorro North to 19 at Eponge South (Figure 1). Most shared genotypes were limited to two seamounts (40 genotypes), however, one genotype occurred at three seamounts (Jumeau East, Eponge North and Zorro North). The most common genotype (14 specimens) occurred at four seamounts (Jumeau East, Kaimon Maru, Eponge South and Zorro North) and the second most common genotype (8 specimens) also occurred at four seamounts (Jumeau East, Kaimon Maru, Eponge South and Zorro South). No genotype was shared across all six seamounts.
Distribution of the N. fulvodesmus ITS genotypes on the seamounts (ALA, 2014).
When each seamount is regarded as a distinct population, the pairwise genetic differences (Table 5) showed that the two pairs of populations that are physically closest together, i.e. Zorro North and Zorro South, and Eponge North and Eponge South, show significant pairwise F ST. The only other significant pairwise differences are between Zorro South and Jumeau East, and between Zorro South and Eponge South.
Pairwise differences in F ST of N. fulvodesmus calculated from ITS between the seamounts using the distance method.
*Indicates significant difference from 0 at P = 0.05.
When the seamounts are clustered geographically, the variation is distributed within each population rather than between populations or groups of populations even when adjacent seamounts are compared with other seamounts. There is no latitudinal gradient showing genetic flow from the north to south nor is there flow from the south to the north. There was no latitudinal gradient between the seamounts. Neither was there any longitudinal gradient for gene diversity, nucleotide diversity and haplotypic diversity between the seamounts. There were no significant bathymetric gradients, or bathymetric ranges amongst the genotypes or the diversities. Most of the depths of the dredges on the seamounts from which the specimens of N. fulvodesmus were recovered were from around 500 m depth (ranging from 470 to 691 m) (Table 1), with the exception of Kaimon Maru and Zorro North which reached depths of 896 and 1000 m respectively. Interestingly the highest diversities were found from the Eponge North seamount with the smallest depth range of dredges.
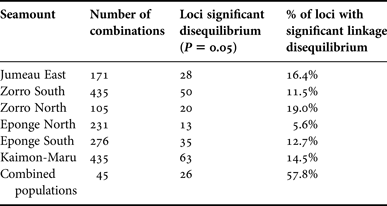
All of the individual populations showed significant levels of linkage disequilibrium amongst the polymorphic loci as shown in Table 6.
Summary of significant polymorphic loci of N. fulvodesmus with linkage disequilibrium.
Eight individuals were screened using CO1 from three seamounts to detect if there was any variation within this species. Table 7 compares the diversity of the seamounts, which is zero, and there were no polymorphic loci found in the CO1 fragment. All eight individuals were found to belong to the same mtDNA genotype and were found at all three seamounts (Figure 3). These eight individuals when analysed with ITS found 23 of the 114 genotypes. This ranged from two individuals with only one genotype detected to another individual with eight genotypes. These are likely to be related to the number of clones sequenced.
Comparison of diversities of the seamounts of N. fulvodesmus from CO1 in order of increasing latitude.
Pairwise differences in F ST using the distance method between the seamounts for CO1was not calculated for N. fulvodesmus because of the low numbers of individuals sampled from the population, likewise linkage disequilibrium could not be calculated because there were no polymorphic loci. All the loci at the CO1 fragment were monomorphic. No morphological differences were detected between the specimens.
Neoaulaxinia zingiberadix
All 32 specimens of N. zingiberadix were identical for CO1 sequenced region (Figure 3). There was no latitudinal, longitudinal or depth separation. All specimens were from two seamounts Jumeau East and Introvable and there was no separation between the seamounts (Table 8).
Comparison of diversities of N. zingiberadix calculated from CO1 of the seamounts in order of increasing latitude.
Linkage disequilibrium was not calculated because of the monomorphism at all the loci of the CO1 fragment. No morphological differences were detected between the specimens.
Isabella mirabilis
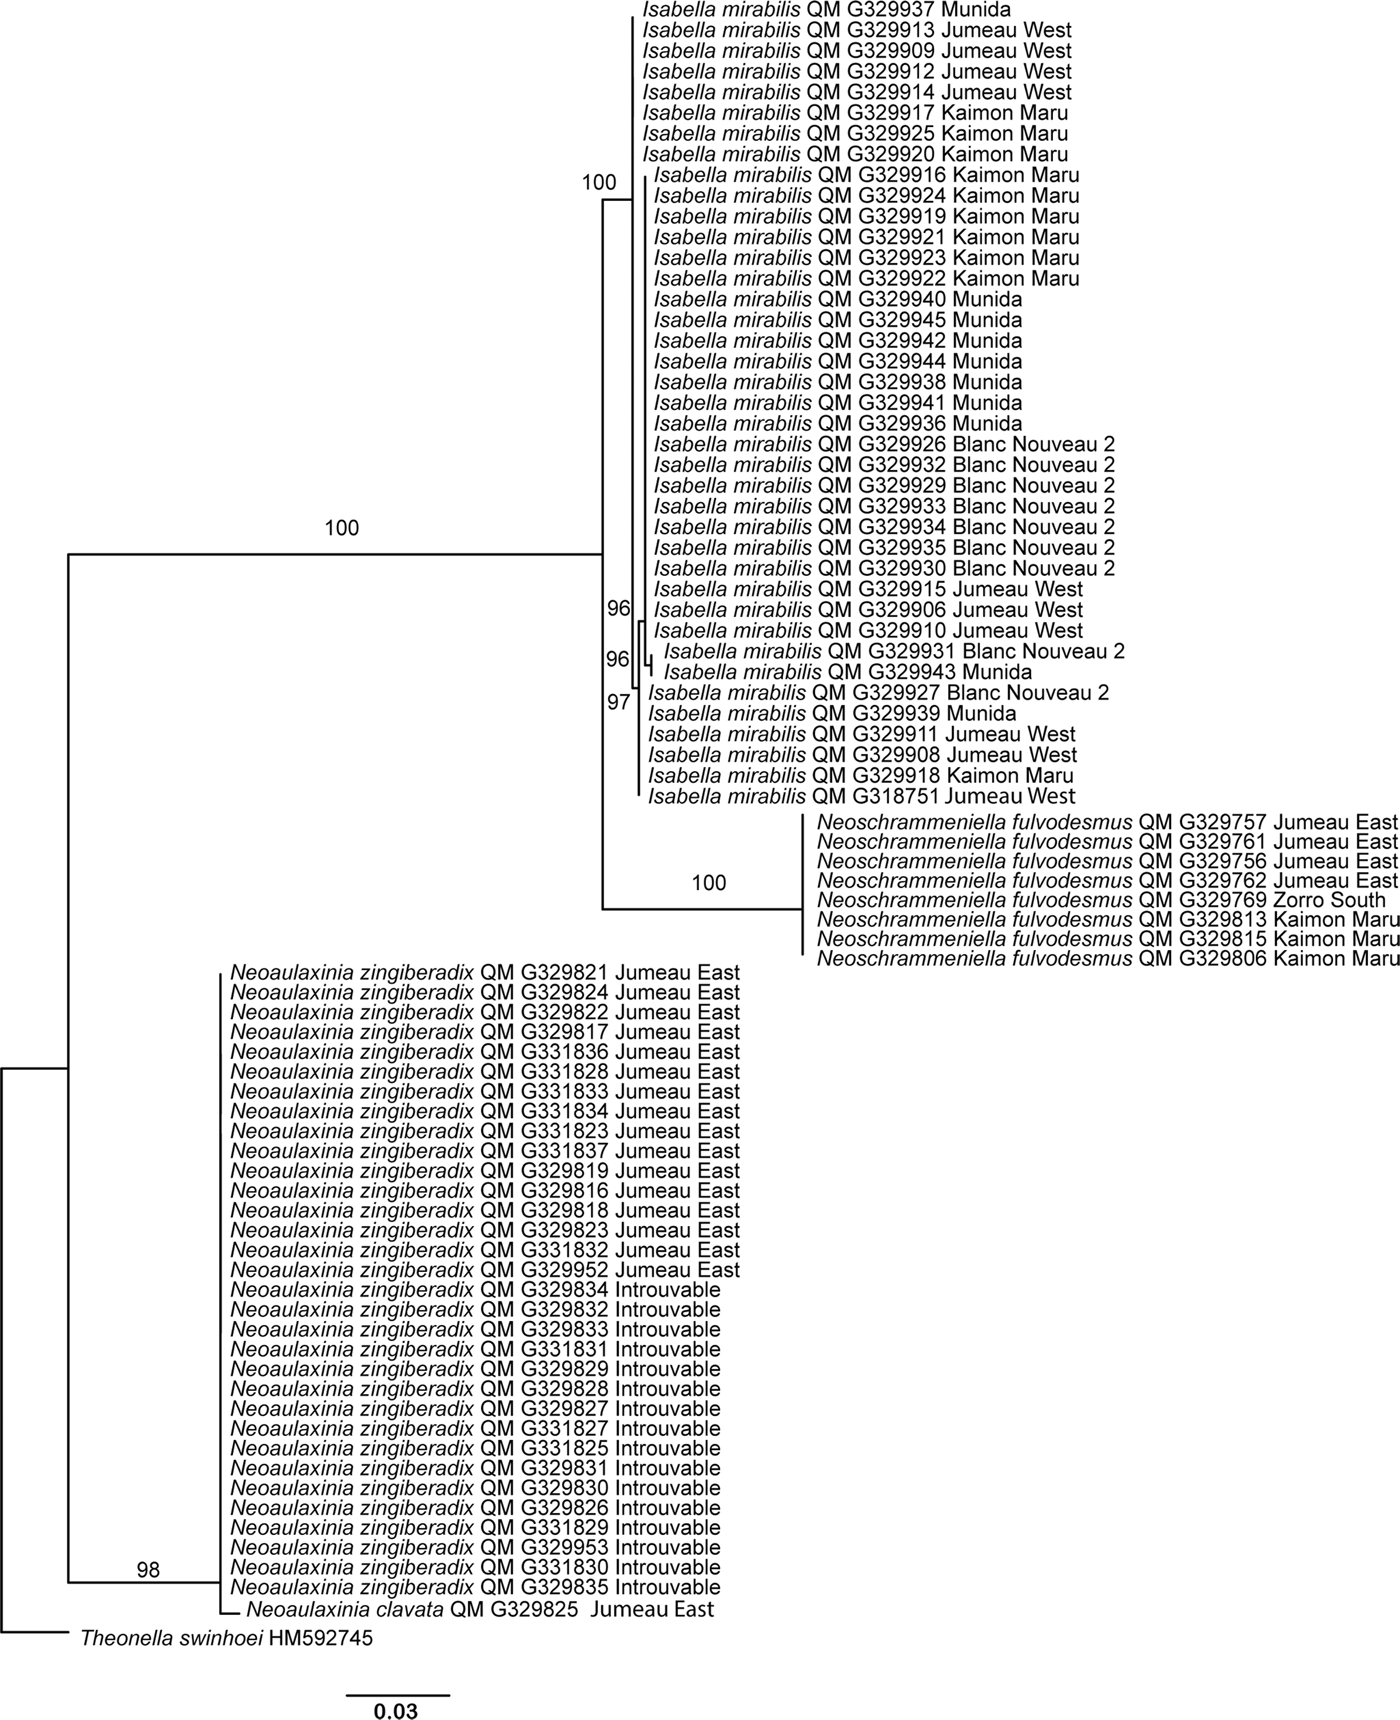
Sequencing of the CO1 fragment of all specimens of the species I. mirabilis, divided the specimens into four distinct genotypes with one very large genotype comprising the majority of specimens (23/38) (Figure 2). These sponges were from four seamount sites, each seamount with three or four genotypes (Table 9). There was one genotype present only in two specimens. There were other genotypes comprised of five and eight individuals (Figure 3). All four seamounts had three of the four genotypes in different combinations, so there was no specialization of genotypes for a specific seamount. All of the specimens were collected from between 270 and 348 m depth (Table 1) and the genotypes were not specific for any particular depth. Morphological analysis of the genotypes of I. mirabilis only revealed variation in the relative proportions of microscleres.
Distribution of the I. mirabilis CO1 genotypes on the seamounts (ALA, 2014).
CO1 maximum likelihood reconstruction of the samples analysed in this study. Numbers following the taxon names are Queensland Museum collection numbers (QM G) or GenBank accession numbers. Numbers on the branches indicate rapid bootstrap support values (>70). The scale bar depicts substitutions per site.
Comparison of diversities of I. mirabilis calculated from CO1 of the seamounts in order of increasing latitude.
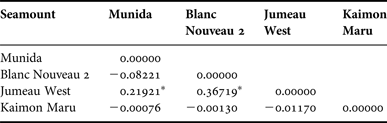
Significant differences were found in F ST values in seamounts of the species I. mirabilis between Jumeau West and Munida, and Jumeau West and Blanc Nouveau 2 only (Table 10, see also Figure 2). In order to test for population subdivision the seamounts were clustered into two groups as identified by F ST analysis. One group contained the two seamounts of Munida and Blanc Nouveau 2, and the other group contained the seamounts Jumeau West and Kaimon Maru. This revealed that 97.79% of the variation was found within the seamount clusters, so there was no population structure here. Clustering of the seamounts using a distance-related latitudinal gradient provided a higher signal of the variation spread between the populations, with clustering of Jumeau West, Munida and Blanc Nouveau 2 compared with Kaimon Maru. On all accounts most of the variation is included within the populations (92.66%).
Pairwise differences in F ST of I. mirabilis calculated from CO1 between the seamounts using the distance method.
*Indicates significant difference from 0 at P = 0.05.
Linkage disequilibrium was calculated for the polymorphic loci at the seamounts. For two sites, Munida and Blanc Nouveau 2, there were no polymorphic loci with significant linkage disequilibrium. This contrasts with the other two seamounts of Jumeau West and Kaimon Maru, which had both of the polymorphic loci showing significant (P = 0.05) linkage disequilibrium. This is all overshadowed by the fact that for the CO1 region from the 597 usable nucleotide sites there were polymorphisms only at a maximum of three sites for Munida and all other seamounts had two polymorphic sites. This contrasts strongly to the two other species, which showed no polymorphism at all for the CO1.
DISCUSSION
This study demonstrates that the three lithistid sponge populations have varying levels of population connectivity amongst seamounts, ranging from very well connected subpopulations on individual seamounts to subpopulations with moderate gene flows between the seamounts. Seamounts are topographically small and isolated, suggesting an island model, which has led to an expectation of high endemism and species richness on seamounts (Richer de Forges et al., Reference Richer de Forges, Koslow and Poore2000). From a purely geomorphological sense one would expect each separate seamount to behave at least as a discrete population. These seamounts would then have reduced gene flow and be particularly susceptible to genetic drift because of their small size (Le Goff-Vitry et al., Reference Le Goff-Vitry, Pybus and Rogers2004). However, the results in the present study did not support this. Contrary to the island model, seamounts are not surrounded by hydrological barriers and populations might have high gene flow between seamounts, a finding also concluded by other researchers (Samadi et al., Reference Samadi, Schlacher, Richer de Forges, Pitcher, Horato, Hart, Clark, Hagger and Santos2007; Clark et al., Reference Clark, Schlacher, Rowden, Stocks and Consalvey2012). The lack of significant difference between the sites studied here indicates all the seamounts form one meta-population. The alleged high rates of gene flow of the species studied here amongst the seamounts are presumably caused largely by currents, e.g. migration of larvae, sponge tissue drifting or transmission on ghost nets. With potentially year-round reproduction sponges would be able to take advantage of differing seasonal currents to migrate (Longo et al., Reference Longo, Pontassuglia, Corriero and Gaino2012). The concept of a short-lived crawling stage as suggested for some sponge species (Hooper & Van Soest, Reference Hooper and Van Soest2002) is likely to be untenable here. Indeed, the presence of the large trough between these seamounts likely represents a serious barrier to crawling larvae. It is most likely that the sponges studied here have a highly mobile longer-lived egg and sperm stage or egg/zygote phase than previously thought which enables them to survive the distance between the seamounts. Other studies have found that species of molluscs with high genetic structure have larvae with low dispersal ability and species with low genetic structure have larvae with high dispersal ability (Todd et al., Reference Todd, Lambert and Thorpe1998; Boisselier-Dubayle, Reference Boisselier-Dubayle1999; Kyle & Boulding, Reference Kyle and Boulding2000; Collin, Reference Collin2001). Bohonak (Reference Bohonak1999) indicated there is a correspondence between dispersal and gene flow.
All specimens of Neoaulaxinia zingiberadix and Neoschrammeniella fulvodesmus, when sequenced for CO1, showed only one single genotype. CO1 sequencing of Isabella mirabilis revealed four genotypes and each seamount had three of the four genotypes. There was no specialization for genotypes on each seamount. Therefore this species is an example of a lithistid species that mixes well between seamounts. This also confirms that CO1 provides resolution at population level for this species. Other researchers using CO1 have also reported low numbers of genotypes, although in different sponge species (Wörheide, Reference Wörheide2006; Hoshino et al., Reference Hoshino, Saito and Fujita2008; Whalan et al., Reference Whalan, De Nys, Smith-Keune, Evans, Battershill and Jerry2008; Dailianis et al., Reference Dailianis, Tsigenopoulos, Dounas and Voultsiadou2011). The presence of only one genotype in N. zingiberadix and N. fulvodesmus hints that genetic drift has occurred. The formation of external buds of hexactinellids in the stable environment of the Antarctic waters (Teixido et al., Reference Teixido, Gili, Uriz, Gutt and Arntz2006) may enable the formation of a stable clonal population in the immediate vicinity. Indeed the formation of buds was observed on one of the specimens of I. mirabilis in this study. If the ancestral population of one of these lithistid sponges was separated a long time ago but reproduced clonally we would expect two discrete populations. All the seamounts are most likely functioning as a single population suggested by the presence of one single CO1 genotype of N. zingiberadix and N. fulvodesmus. An alternative explanation to the lack of genotypic diversity in CO1 is because the rock sponges are long lived and slow growing coupled with slow mitochondrial substitutions (Shearer et al., Reference Shearer, Van Oppen, Romano and Wörheide2002). The overwhelming proportion of diversity detected by ITS within the same specimens of N. fulvodesmus is contained within intragenomic diversity, and in comparison there are comparatively small differences within seamounts and virtually no differences between seamounts. With the ITS there were no examples of the same genotype occurring at all six sites, but there were many unique genotypes at each seamount. Because these species appear to be very slow growing and long lived there does not need to be much gene flow between the seamounts to maintain the genetic uniformity and the vagility of the larval stage may still be quite low. In theory, the exchange of a single individual between large populations is enough to counter any effects from genetic drift (Silva & Russo, Reference Silva and Russo2000) and with a sponge with a generation time of potentially several hundred years this is not impossible.
Clusters of ITS genotypes in N. fulvodesmus on seamounts are likely to be the result of either: adjacent settling of larvae, clonality via asexual reproduction, colony fragmentation into discrete individuals, inbreeding populations or even self-fertilizing populations. However, it could also be a function of sampling as deep sea lithistids have been observed to adhere to the rock in distinct clusters (Ekins' personal observations from ROV research Deep Down Under Expedition; www.deepdownunder.de). Much of the diversity in sponge populations has previously been attributed to sex and not asexuality (Dailianis et al., Reference Dailianis, Tsigenopoulos, Dounas and Voultsiadou2011; Uriz & Turon, Reference Uriz and Turon2012). However, asexual components may also add to the diversity by colony formation of multiple genotypes such as chimeras. Chimeras have been reported in other sessile marine invertebrates, e.g. corals (Puill-Stephan et al., Reference Puill-Stephan, Willis, van Herwerden and van Oppen2009), ascidians (Sommerfeldt et al., Reference Sommerfeldt, Bishop and Wood2003) as well as sponges (Wulff, Reference Wulff and Rützler1990; Maldonado, Reference Maldonado1998; Blanquer & Uriz, Reference Blanquer and Uriz2011). Somatic mutations have also been suggested as a potential mean for increasing genotypic diversity within an individual (Buss, Reference Buss1982), but these options appear less likely to explain the diversity observed here.
A sexual population is evidenced by the variation in the ITS region in N. fulvodesmus, high levels of gene and genotypic diversity coupled with low levels of nucleotide diversity. However, while within this species there are also indirect indicators of asexual components as evidenced by the occurrence of the same common genotypes on the different seamounts and significant linkage disequilibrium, however asexual reproduction in rock sponges has yet to be described. For N. fulvodesmus and N. zingiberadix the dominance of one genotype in CO1 may be seen as an indication of asexuality, however this has to be tempered by the conservation of the CO1 gene (Shearer et al., Reference Shearer, Van Oppen, Romano and Wörheide2002; Erpenbeck et al., Reference Erpenbeck, Hooper and Wörheide2006). The multiple genotypes present in I. mirabilis indicate there is some balance between asexual and sexual reproduction at least in some part of the species history that has been maintained on different seamounts. This phenomenon has also been found in sponges (Zilberberg et al., Reference Zilberberg, Solé-Cava and Klautau2006a), corals (Foster et al., Reference Foster, Iliana and Mumby2007; Morrison et al., Reference Morrison, Ross, Nizinski, Brooke, Jarnegren, Waller, Johnson and King2011) and ascidians (Perez-Portela & Turon, Reference Perez-Portela and Turon2008). For I. mirabilis it just means that it had recombination events at some point even prior to asexual transmission between the seamounts, which has been maintained in the population by asexual reproduction. The lack of subdivision indicates that either they all arose together and evolved very slowly with no continued divergence or they are mixing and interbreeding, with substantial gene flow between the seamounts.
Molecular studies of other sponges have detected strong spatial structure and restricted gene flow, reproductively isolating the populations and thus increasing the chance for speciation (e.g. Duran et al., Reference Duran, Giribet and Turon2004a; Blanquer et al., Reference Blanquer, Uriz and Caujape-Castells2009). Cryptic speciation amongst what was thought to be cosmopolitan species correlates with potential speciation, presumably due to the low dispersal abilities of many sponges (Wörheide et al., Reference Wörheide, Degnan, Hooper, Reitner and Moosa2002b; Duran & Rützler, Reference Duran and Rützler2006; Blanquer & Uriz, Reference Blanquer and Uriz2007).
The lack of any genetic differences along latitudinal or longitudinal gradients indicates that currents around the seamounts potentially have eddies, caused by the unidirectional East Australian Current heading south-easterly, along the Western edge of the Norfolk Ridge (Ridgway & Dunn, Reference Ridgway and Dunn2003). The two pairs of seamounts that have physically close pairs of seamounts, i.e. Zorro North and Zorro South, and Eponge North and Eponge South are not genetically close. This result is in contrast to Duran & Rützler (Reference Duran and Rützler2006) who only found virtually all of the populations of Chondrilla cf. nucula Schmidt, 1862, to be significantly different.
This study demonstrates that sponge populations on the deep seamounts studied here appear to be well connected. Despite being topographically small and isolated, the individual seamounts do not show high levels of population structure based on the molecular loci studied here. Not only do seamounts share the same sponge species they also share the same genotypes indicating a mixture of sexual and asexual reproductive strategies with better dispersal properties than previously thought.
ACKNOWLEDGEMENTS
We would like to thank Bertrand Richer de Forges and Thomas Schlacher for collection of the specimens and all the crew and scientific staff on the ‘RV Alis’ for the NORFOLK 2 Cruise. We would like to thank Emma Sherlock from the Natural History Museum for providing a fragment of the holotype of N. zingiberadix for examination. We would also like to thank Kathryn Hall, Monika Bryce and Jessica Worthington-Wilmer for technical advice, laboratory support and assistance. ME and DE would especially like to thank Dan Jackson, Alina Craige, Maja Adamska, Gabriele Büttner and Simone Schätzle for help with molecular work and Bernie Degnan for making space in his laboratory for cloning. We also would like to thank Liam Town and Carol Wicking for help with sequencing alignment and Andrea Crowther for suggestions about nested clade analysis. We would also like to thank Andrzej Pisera for his help with identification of one of the specimens of N. fulvodesmus. ME would also like to thank Judy Powell and Monique Grol for help with the manuscript.
FINANCIAL SUPPORT
This research received in part funding of the Alfred P. Sloan Foundation, Census of Marine Life's Barcode of Life Initiative (#2007-12-1-C4: ‘DNA Barcoding of Marine Biodiversity (MarBOL)’). DE and GW acknowledge funding from the Deutsche Forschungsgemeinschaft projects (DFG) ER611/3-1, WO896/15-1.