INTRODUCTION
Size distributions, represented by the number of individuals in different size classes, reflect fundamental demographic processes and are therefore frequently used to describe populations or communities. Size distributions depend on the rate at which individuals enter a given size class through recruitment or growth and the rate that they exit through mortality or growth (Van Sickle Reference VAN SICKLE1977). Any factor altering baseline demographic patterns will eventually affect size distributions. Disturbance events, competition and cyclic climate changes may all leave signatures (Condit et al. Reference CONDIT, HUBBELL and FOSTER1995, Reference CONDIT, AGUILAR, HERNANDEZ, PEREZ, LAO, ANGEHR, HUBBELL and FOSTER2004; Goff & West Reference GOFF and WEST1975, Nakagawa et al. Reference NAKAGAWA, TANAKA, NAKASHIZUKA, OHKUBO, KATO, MAEDA, SATO, MIGUCHI, NAGAMASU, OGINO, TEO, HAMID and LEE2000, Toledo et al. Reference TOLEDO, MAGNUSSON and CASTILHO2013, Wright et al. Reference WRIGHT, CARRASCO, CALDERON and PATON1999). In forest ecosystems, tree diameter distributions have therefore been used to infer forest stability, species-specific strategies of regeneration and population trends (Feeley et al. Reference FEELEY, DAVIES, NOOR, KASSIM and TAN2007, Kohira & Ninomiya Reference KOHIRA and NINOMIYA2003, Kohyama et al. Reference KOHYAMA, POTTS, KOHYAMA, KASSIM and ASHTON2015, Wright et al. Reference WRIGHT, MULLER-LANDAU, CONDIT and HUBBELL2003).
On first principles, diameter distributions depend critically on how growth and mortality are related to tree size, and on population growth rates (Coomes & Allen Reference COOMES and ALLEN2007, Kohyama et al. Reference KOHYAMA, SUZUKI, PARTOMIHARDJO, YAMADA and KUBO2003, Lorimer et al. Reference LORIMER, DAHIR and NORDHEIM2001, Muller-Landau et al. Reference MULLER-LANDAU, CONDIT, HARMS, MARKS, THOMAS, BUNYAVEJCHEWIN, CHUYONG, CO, DAVIES, FOSTER, GUNATILLEKE, GUNATILLEKE, HART, HUBBELL, ITOH, KASSIM, KENFACK, LAFRANKIE, LAGUNZARD, LEE, LOSOS, MAKANA, OHKUBO, SAMPER, SAKUMAR, SUN, SUPARDI, TAN, THOMAS, THOMPSON, VALENCIA, VALLEJO, MUÑOZ, YAMAKURA, ZIMMERMAN, DATTARAJA, ESUFALI, HALL, HE, HERNÁNDEZ, KIRATIPRAYOON, SURESH, WILLS and ASHTON2006). Decreasing growth with size, for instance, results in diameter distributions with lower skewness (i.e. less asymmetrical and more modal), as do declining populations (Condit et al. Reference CONDIT, SUKUMAR, HUBBELL and FOSTER1998, Leak Reference LEAK2002). Analytical and simulation analyses have shown that in stable populations, particular patterns of growth and mortality in relation to stem diameter can lead to particular shapes of diameter distributions (Leak Reference LEAK2002, Lorimer & Frelich Reference LORIMER and FRELICH1984). Muller-Landau et al. (Reference MULLER-LANDAU, CONDIT, HARMS, MARKS, THOMAS, BUNYAVEJCHEWIN, CHUYONG, CO, DAVIES, FOSTER, GUNATILLEKE, GUNATILLEKE, HART, HUBBELL, ITOH, KASSIM, KENFACK, LAFRANKIE, LAGUNZARD, LEE, LOSOS, MAKANA, OHKUBO, SAMPER, SAKUMAR, SUN, SUPARDI, TAN, THOMAS, THOMPSON, VALENCIA, VALLEJO, MUÑOZ, YAMAKURA, ZIMMERMAN, DATTARAJA, ESUFALI, HALL, HE, HERNÁNDEZ, KIRATIPRAYOON, SURESH, WILLS and ASHTON2006) provided explicit theoretical predictions of size distributions based on different growth-diameter and mortality-diameter functions, under the assumption that populations are at demographic equilibrium, that is, that demographic rates and population size are constant in time.
Interspecific variation in size distributions is related to growth and mortality patterns, reflecting interspecific differences in shade-tolerance (Wright et al. Reference WRIGHT, MULLER-LANDAU, CONDIT and HUBBELL2003), adult stature (Iida et al. Reference IIDA, POORTER, STERCK, KASSIM, POTTS, KUBO and KOHYAMA2014, King et al. Reference KING, DAVIES and NOOR2006) and light utilization strategy (Kohyama et al. Reference KOHYAMA, POTTS, KOHYAMA, KASSIM and ASHTON2015). However, these relationships can be weak for community-level size distributions (Muller-Landau et al. Reference MULLER-LANDAU, CONDIT, HARMS, MARKS, THOMAS, BUNYAVEJCHEWIN, CHUYONG, CO, DAVIES, FOSTER, GUNATILLEKE, GUNATILLEKE, HART, HUBBELL, ITOH, KASSIM, KENFACK, LAFRANKIE, LAGUNZARD, LEE, LOSOS, MAKANA, OHKUBO, SAMPER, SAKUMAR, SUN, SUPARDI, TAN, THOMAS, THOMPSON, VALENCIA, VALLEJO, MUÑOZ, YAMAKURA, ZIMMERMAN, DATTARAJA, ESUFALI, HALL, HE, HERNÁNDEZ, KIRATIPRAYOON, SURESH, WILLS and ASHTON2006) or even non-existent for some species (Condit et al. Reference CONDIT, SUKUMAR, HUBBELL and FOSTER1998). Some of these differences can be explained by non-zero population growth (Bin et al. Reference BIN, YE, MULLER-LANDAU, WU, LIAN and CAO2012, Condit et al. Reference CONDIT, SUKUMAR, HUBBELL and FOSTER1998), with diameter distributions better fitted by predictions that incorporate population growth rates together with growth and mortality functions (Kohyama et al. Reference KOHYAMA, POTTS, KOHYAMA, KASSIM and ASHTON2015). Additional unexplained variation presumably reflects temporal changes in demographic rates – that is, size distributions reflect past rates which may differ from current ones.
In this study, we empirically evaluate how tree size distributions of individual species are related to their concurrently measured demographic rates within a Neotropical tree community. We use 25 y of data on individual tree demographic data from the 50-ha Barro Colorado Island (BCI) forest plot to fit growth-diameter functions, mortality-diameter functions, and size distributions for over 150 tree species. We investigate how species-specific demographic rates and size distributions vary among growth forms and over time, and how interspecific variation in diameter distribution relates to variation in concurrently measured mortality-diameter, growth-diameter curves and population growth rates. We also evaluate the specific predictions of Muller-Landau et al. (Reference MULLER-LANDAU, CONDIT, HARMS, MARKS, THOMAS, BUNYAVEJCHEWIN, CHUYONG, CO, DAVIES, FOSTER, GUNATILLEKE, GUNATILLEKE, HART, HUBBELL, ITOH, KASSIM, KENFACK, LAFRANKIE, LAGUNZARD, LEE, LOSOS, MAKANA, OHKUBO, SAMPER, SAKUMAR, SUN, SUPARDI, TAN, THOMAS, THOMPSON, VALENCIA, VALLEJO, MUÑOZ, YAMAKURA, ZIMMERMAN, DATTARAJA, ESUFALI, HALL, HE, HERNÁNDEZ, KIRATIPRAYOON, SURESH, WILLS and ASHTON2006) regarding the quantitative relationship of species diameter-distribution parameters to their size-dependent growth and mortality parameters.
METHODS
Study site and plot census
Barro Colorado Island (BCI) is located in Gatun Lake, Panama, and is covered in semi-deciduous moist tropical forest. Mean temperature is 31°C and mean rainfall is 2551 mm y−1 with a 4-mo dry season from mid-December until mid-April (Leigh et al. Reference LEIGH, LAO, CONDIT, HUBBELL, FOSTER, PEREZ, Losos and Leigh2004). The forest dynamics plot has an area of 50 ha (1000 × 500 m) and is located in a fairly flat area (120 to 160 m asl) in the centre of the island (9°9ʹN, 79°51ʹW). The plot is mostly old-growth forest undisturbed for at least 400 y, except for approximately 2 ha covered by secondary forest of around 100 y old. These and other details on the physical environment, forest structure and composition can be found in Leigh et al. (Reference LEIGH, LAO, CONDIT, HUBBELL, FOSTER, PEREZ, Losos and Leigh2004). During 1981–1983, all free-standing, woody stems ≥ 10 mm dbh (diameter at breast height – 1.3 m, or above buttresses) inside the 50-ha plot were tagged, identified to species and measured for dbh with a precision of 1 mm (detailed methods are given in Condit Reference CONDIT1998). New censuses were carried out in 1985 and then every 5 y until 2010, resulting in a total of seven censuses. At each recensus, the number of new recruits and new deaths were recorded and all recruits and surviving individuals had their dbh (re)measured.
Fitting size distributions
Diameter distributions were fitted for all 174 species with 30 or more individuals, having secondary stem growth (no palms), and whose largest individuals are taller than 4 m and have dbh greater than 80 mm. The last criterion excludes small shrubs whose life cycles are often completed below the dbh cut-off, thus concealing a large proportion of their size distribution. Species were divided into four growth forms based on height of the adult plant (Hubbell & Foster Reference HUBBELL, FOSTER and Soulé1986): large shrubs (hereafter referred to simply as shrubs), understorey, midstorey and canopy trees.
Dbh distributions of each species at each census were fitted using the Weibull distribution (Bailey & Dell Reference BAILEY and DELL1973), a commonly used distribution which provides a good description of tree diameter distributions (Lima et al. Reference LIMA, BATISTA and PRADO2015, Muller-Landau et al. Reference MULLER-LANDAU, CONDIT, HARMS, MARKS, THOMAS, BUNYAVEJCHEWIN, CHUYONG, CO, DAVIES, FOSTER, GUNATILLEKE, GUNATILLEKE, HART, HUBBELL, ITOH, KASSIM, KENFACK, LAFRANKIE, LAGUNZARD, LEE, LOSOS, MAKANA, OHKUBO, SAMPER, SAKUMAR, SUN, SUPARDI, TAN, THOMAS, THOMPSON, VALENCIA, VALLEJO, MUÑOZ, YAMAKURA, ZIMMERMAN, DATTARAJA, ESUFALI, HALL, HE, HERNÁNDEZ, KIRATIPRAYOON, SURESH, WILLS and ASHTON2006). Because the dbh data is left-censored, we used the truncated Weibull, which takes the form:
 $$\begin{equation*}
f( x ){\rm{\ }} = {\rm{\ }}\frac{{\rm{\beta }}}{{\rm{\alpha }}}\ {\left( {\frac{x}{{\rm{\alpha }}}} \right)^{{\rm{\beta }} - 1}}{e^{ - {{\left( {\frac{{x - \ {x_{min}}}}{{\rm{\alpha }}}} \right)}^{\rm{\beta }}}}},\quad x \ge {x_{min}},
\end{equation*}$$
where β and α are the shape and scale parameters, and xmin is the minimum size for which dbh data are available. The Weibull reduces to an Exponential (or reverse-J) distribution when β equals 1 (distribution skewness = 2), to more skewed distributions with more small individuals relative to large individuals when β < 1 (skewness > 2) and to less skewed distribution when β > 1 (skewness < 2). When β approaches 3.6, the Weibull approximates the normal distribution (skewness = 0). The parameter α is closely related to the median of the distribution. We set x min at 10.5 mm, the minimum dbh (10 mm) plus half of the dbh measurement precision (0.5 mm), because the number of individuals in the 9.5–10.5 mm dbh category is underestimated. In the case of multiple-stemmed individuals, we used only the dbh of the largest stem. The truncated Weibull was fitted using maximum likelihood techniques and numerical optimization (Bolker Reference BOLKER2008, Burnham & Anderson Reference BURNHAM and ANDERSON2002). All fits were visually inspected to check for convergence problems. When such problems were detected, we varied the starting values of parameters and/or the optimization method until convergence was reached (Bolker Reference BOLKER2008).
Demographic analyses
For each census interval we calculated the annual diameter growth (g) for each individual and the annual mortality (m), recruitment (r) and population growth (λ) for each species following Condit et al. (Reference CONDIT, ASHTON, MANOKARAN, LAFRANKIE, HUBBELL and FOSTER1999):
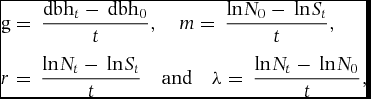 $$\begin{eqnarray*}
&&{\rm{g}} = \ \frac{{{\rm{db}}{{\rm{h}}_t} - \ {\rm{db}}{{\rm{h}}_0}}}{t},\quad m = \ \frac{{{\rm{ln}}{N_0} - \ {\rm{ln}}{S_t}}}{t},\nonumber\\
&&r = \ \frac{{{\rm{ln}}{N_t} - \ {\rm{ln}}{S_t}}}{t}\quad {\rm{and}}\quad \lambda = \ \frac{{{\rm{ln}}{N_t} - \ {\rm{ln}}{N_0}}}{t},
\end{eqnarray*}$$
where dbht and dbh0 are the individual dbh at times t and at time 0, Nt and N 0 are the population sizes at times t and 0, and St is the number of survivors at time t. Values of population growth λ < 0 indicate population decline, while values λ > 0 indicate the opposite. We excluded the first census interval from growth analysis due to measurements taken around buttresses in this census and due to dbh rounding down to the lower 5 mm for trees less than 50 mm dbh in both the first and second census. To account for dbh rounding in the second census, the dbh of the third census was also rounded down for relevant individuals before calculating g for that census interval, a procedure that generates unbiased estimates of g (Condit et al. Reference CONDIT, HUBBELL and FOSTER1993). In addition, we excluded from growth analysis records where stems were measured at different heights in different censuses and the extreme cases in which individual stems were reported to shrink >25% or grow >75 mm y−1 in dbh (Condit et al. Reference CONDIT, ASHTON, MANOKARAN, LAFRANKIE, HUBBELL and FOSTER1999, Rüger et al. Reference RÜGER, HUTH, HUBBELL and CONDIT2011).
Species growth-dbh and mortality-dbh curves were constructed by averaging stem growth and mortality rates for each dbh class. Both curves were obtained separately for each of the five census intervals considered here. Size class limits were chosen to be approximately evenly distributed on a log(dbh) scale (10, 12, 14, 16, 18, 20, 24, 28, 32, 36, 40, 45, 50, 60, 70, 80, 90, 100, 120, 140, 160, 180, 200, 240, 280, 320, 360, 400, 450, 500, 600, 700, 800, 900 and 1000 mm; following Muller-Landau et al. Reference MULLER-LANDAU, CONDIT, HARMS, MARKS, THOMAS, BUNYAVEJCHEWIN, CHUYONG, CO, DAVIES, FOSTER, GUNATILLEKE, GUNATILLEKE, HART, HUBBELL, ITOH, KASSIM, KENFACK, LAFRANKIE, LAGUNZARD, LEE, LOSOS, MAKANA, OHKUBO, SAMPER, SAKUMAR, SUN, SUPARDI, TAN, THOMAS, THOMPSON, VALENCIA, VALLEJO, MUÑOZ, YAMAKURA, ZIMMERMAN, DATTARAJA, ESUFALI, HALL, HE, HERNÁNDEZ, KIRATIPRAYOON, SURESH, WILLS and ASHTON2006). The use of averages within size classes was adopted to avoid bias related to the larger number of small individuals and to deal with negative growth observations related to measurement errors. Binning growth into size classes provided estimates that were reasonably well correlated with the ones obtained by Rüger & Condit (Reference RÜGER and CONDIT2012) in an analysis that explicitly accounted for dbh measurement errors (Appendices 1, 2).
Mean growth-dbh and mortality-dbh curves were fitted with power functions for continuous growth rates:
 $$\begin{equation*}
{g{\rm (dbh)\ }} = {a_g}{\rm{db}}{{\rm{h}}^{{b_g}}},
\end{equation*}$$
 $$\begin{equation*}
{\rm{m}}\left( {{\rm{dbh}}} \right) = {a_m}{\rm{db}}{{\rm{h}}^{{b_m}}},
\end{equation*}$$
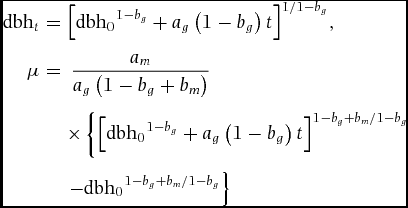
where g(dbh) is the instantaneous absolute diameter growth rate, and m(dbh) is the instantaneous mortality probability. Under the assumption that both rates change continuously as trees grow, these power function imply the following expectations for the diameter at time t, dbh, and the survival probability, exp(-μ), of an individual with initial diameter dbh0 (Muller-Landau et al. Reference MULLER-LANDAU, CONDIT, HARMS, MARKS, THOMAS, BUNYAVEJCHEWIN, CHUYONG, CO, DAVIES, FOSTER, GUNATILLEKE, GUNATILLEKE, HART, HUBBELL, ITOH, KASSIM, KENFACK, LAFRANKIE, LAGUNZARD, LEE, LOSOS, MAKANA, OHKUBO, SAMPER, SAKUMAR, SUN, SUPARDI, TAN, THOMAS, THOMPSON, VALENCIA, VALLEJO, MUÑOZ, YAMAKURA, ZIMMERMAN, DATTARAJA, ESUFALI, HALL, HE, HERNÁNDEZ, KIRATIPRAYOON, SURESH, WILLS and ASHTON2006):
 $$\begin{eqnarray*}
{\rm{db}}{{\rm{h}}_t} = {\left[{{\rm{db}}{{\rm{h}}_0}^{1 - {b_g}} + {a_g}\left( {1 - {b_g}} \right)t} \right]^{1/1 - {b_g}}},\\
\mu = {\rm{\ }}\frac{{{a_m}}}{{{a_g}\left( {1 - {b_g} + {b_m}} \right)}}\nonumber\\
&&\times\left\{ {{{\left[{{\rm{db}}{{\rm{h}}_0}^{1 - {b_g}} + {a_g}\left( {1 - {b_g}} \right)t} \right]}^{1 - {b_g} + {b_m}/1 - {b_g}}}}\right.\nonumber\\
&&\left.{- {\rm{db}}{{\rm{h}}_0}^{1 - {b_g} + {b_m}/1 - {b_g}}} \right\}
\end{eqnarray*}$$
These were the equations used to fit growth-dbh and mortality-dbh curves; full details of how they were derived are provided by Muller-Landau et al. (Reference MULLER-LANDAU, CONDIT, HARMS, MARKS, THOMAS, BUNYAVEJCHEWIN, CHUYONG, CO, DAVIES, FOSTER, GUNATILLEKE, GUNATILLEKE, HART, HUBBELL, ITOH, KASSIM, KENFACK, LAFRANKIE, LAGUNZARD, LEE, LOSOS, MAKANA, OHKUBO, SAMPER, SAKUMAR, SUN, SUPARDI, TAN, THOMAS, THOMPSON, VALENCIA, VALLEJO, MUÑOZ, YAMAKURA, ZIMMERMAN, DATTARAJA, ESUFALI, HALL, HE, HERNÁNDEZ, KIRATIPRAYOON, SURESH, WILLS and ASHTON2006). Note that the estimated dbh-dependent mortality parameters depend on the estimated growth parameters ag and bg. Power function parameters were estimated using ordinary least squares on logarithmically transformed data for each census interval. Growth-dbh and mortality-dbh curves were fitted only for census interval in which a species had at least 30 individuals. We excluded species that had fewer than 30 deaths in the 30 y of monitoring. In total, 169 species met these criteria.
Relating size distributions and demography
The relationship between dbh distribution shapes and demographic rates was evaluated by regressing the Weibull shape parameter β for individual species on bg, bm and λ using generalized linear models, with replicate analyses for each census interval. Because the distribution of residuals was not normal we used a Gamma error distribution. The amount of variation explained by the regressions was evaluated by the pseudo-R 2 (i.e. 1 − residual deviance/null deviance; Zuur et al. Reference ZUUR, IENO, WALKER, SAVELIEV and SMITH2009) and we performed analyses of deviance and Chi-squared tests to evaluate the effect of individual demographic variables on β. These regressions were fitted for all species combined and for each growth form separately. We inspected how the fitted Weibull parameters β and α and b g, b m and λ vary among growth forms using Chi-squared tests as well, with species as random effects to account for the repeated measures made for every species at each census interval. We also assessed the importance of annual mortality (m) and recruitment (r) to λ and consequently to the shape of species size distributions using a similar analysis but separately by census interval and using the normal error distribution.
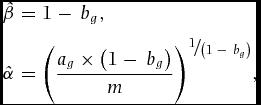
We used standardized major axis regression on log-transformed values to test how fitted Weibull size distribution parameters for each species and census related to predictions from a demographic equilibrium derivation of the Weibull (Muller-Landau et al. Reference MULLER-LANDAU, CONDIT, HARMS, MARKS, THOMAS, BUNYAVEJCHEWIN, CHUYONG, CO, DAVIES, FOSTER, GUNATILLEKE, GUNATILLEKE, HART, HUBBELL, ITOH, KASSIM, KENFACK, LAFRANKIE, LAGUNZARD, LEE, LOSOS, MAKANA, OHKUBO, SAMPER, SAKUMAR, SUN, SUPARDI, TAN, THOMAS, THOMPSON, VALENCIA, VALLEJO, MUÑOZ, YAMAKURA, ZIMMERMAN, DATTARAJA, ESUFALI, HALL, HE, HERNÁNDEZ, KIRATIPRAYOON, SURESH, WILLS and ASHTON2006). In particular, under the assumption of constant population size, power-function growth and constant mortality with respect to dbh, the predicted Weibull parameters are:
 $$\begin{eqnarray*}
{\rm{\hat \beta }} = 1 - \ {b_g},\\
{\rm{\hat \alpha }} = {\left( {\frac{{{a_g} \times \left( {1 - \ {b_g}} \right)}}{m}} \right)^{{\raise0.4ex\hbox{\scriptsize$1$} \!\mathord{\left/ {\vphantom {1 {\left( {1 - \ {b_g}} \right)}}}\right.\kern-\nulldelimiterspace} \!\lower0.4ex\hbox{\scriptsize${\left( {1 - \ {b_g}} \right)}$}}}},
\end{eqnarray*}$$
where b g and a g are the parameters of the fitted power function growth curve and m is the mean annual mortality rate for the corresponding census intervals. We chose to use standardized major axis regression to evaluate the relationship between predicted and observed parameters because there is uncertainty associated with the estimates of both predicted and observed Weibull parameters (Smith Reference SMITH2009). Although the majority of species had growth-dbh curves that were well described by power functions, some species had non-monotonic curves. Given that the theoretical predictions above are based on power-function growth (Muller-Landau et al. Reference MULLER-LANDAU, CONDIT, HARMS, MARKS, THOMAS, BUNYAVEJCHEWIN, CHUYONG, CO, DAVIES, FOSTER, GUNATILLEKE, GUNATILLEKE, HART, HUBBELL, ITOH, KASSIM, KENFACK, LAFRANKIE, LAGUNZARD, LEE, LOSOS, MAKANA, OHKUBO, SAMPER, SAKUMAR, SUN, SUPARDI, TAN, THOMAS, THOMPSON, VALENCIA, VALLEJO, MUÑOZ, YAMAKURA, ZIMMERMAN, DATTARAJA, ESUFALI, HALL, HE, HERNÁNDEZ, KIRATIPRAYOON, SURESH, WILLS and ASHTON2006), this analysis was conducted with and without these species.
Although the Weibull parameter α was generally strongly correlated with the mean of the dbh distribution and, consequently, with growth form, α estimates often took very small values (0.00002< α < 0.8) for heavily skewed distributions (27 cases with β < 0.25). The value of β = 0.25 was set as an approximate threshold below which α tended towards such small values. We fixed α at zero to check whether these very low estimates were related to estimates being on the boundary of the parameter space. Fits with α fixed at zero performed significantly less well than those in which α was fitted, meaning that parameter estimates were not on the boundary. These very low α estimates correspond to predictions of extremely high densities of trees less than 10 mm dbh that we know do not correspond to reality and were most probably related to a restriction of the truncated Weibull in describing distributions with great contributions of small and extreme values of diameter at the same time. Thus, we omitted these α estimates from the analyses linking the observed and predicted Weibull parameters. All analyses were performed using R version 2.15.1 (www.R-project.org).
RESULTS
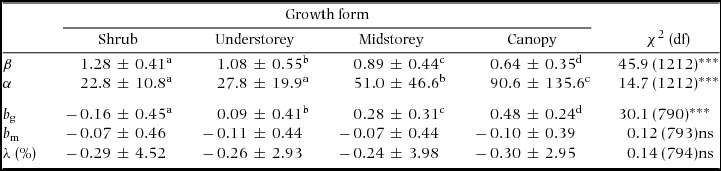
Diameter distributions were markedly skewed in all census intervals with 60–75% of species having Weibull shape parameter β < 1 (Appendix 3). Estimates of β ranged from ≤ 0.15 (e.g. Chrysophyllum cainito, Platymiscium pinnatum and Tetragastris panamensis) to >2 (e.g. Gustavia superba, Herrania purpurea and Talisia nervosa). No species had truly asymmetrical distributions (β ≈ 3.6), which are found at BCI only among palms (not included in the analysis). The fit of the Weibull to the diameter distribution for all species can be accessed in the Smithsonian data archive at http://dx.doi.org/10.5479/10088/28131. Shrub and understorey species had less skewed distributions (higher β) while midstorey and canopy species tended to have more skewed ones (Table 1).
Summary statistics by growth form of the Weibull parameters (β and α) of the fitted size distributions, power-function exponents fitted to growth-dbh (b g) and mortality-dbh (b m) curves and population growth rate (λ) at the Barro Colorado Island 50-ha plot. Values are means ± SD over all combinations of species and census interval. Chi-squared statistics (χ2) present the results of analyses of deviance across growth forms with species as random effects. Superscript letters indicate significantly different groups. Because the power function could not be fitted for some of the growth and/or mortality curves, the number of degrees of freedom (df) varied between b g and b m. Number of species of shrub, understorey, midstorey and canopy species are 13, 38, 50 and 73, respectively. ***: P < 0.001; ns = not significant (P > 0.05).
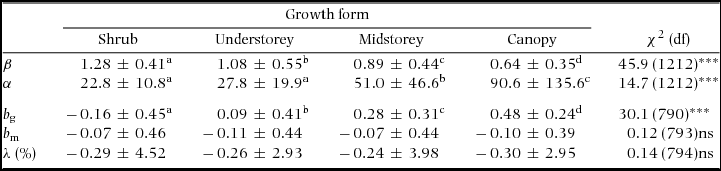
Around 80% of species had positive growth exponents (bg) and 60% had negative mortality exponents (bm − Appendix 4). The exponent bg varied among growth forms while bm and population growth (λ) did not (Table 1). Over the 30 y of monitoring, 56% of the species had negative λ. Population decline can be caused by decreases in recruitment or increases in mortality. For all but one census interval available for the BCI plot, interspecific variation in λ was explained more by variation in recruitment than by variation in mortality (regression of λ on log(r) and log(m): partial R 2 = 0.21–0.49 for log(r) vs. 0.03–0.24 for log(m); all analyses had P < 0.0001).
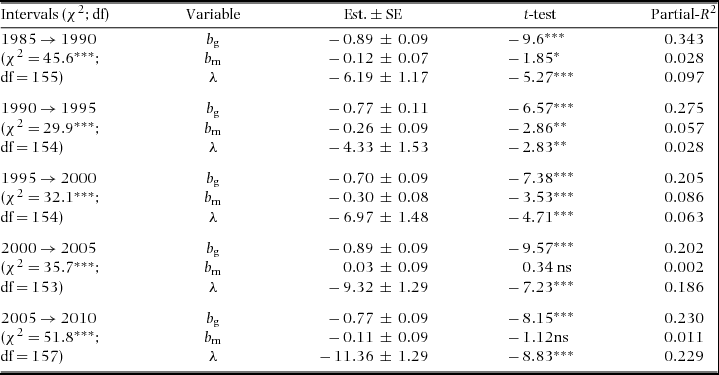
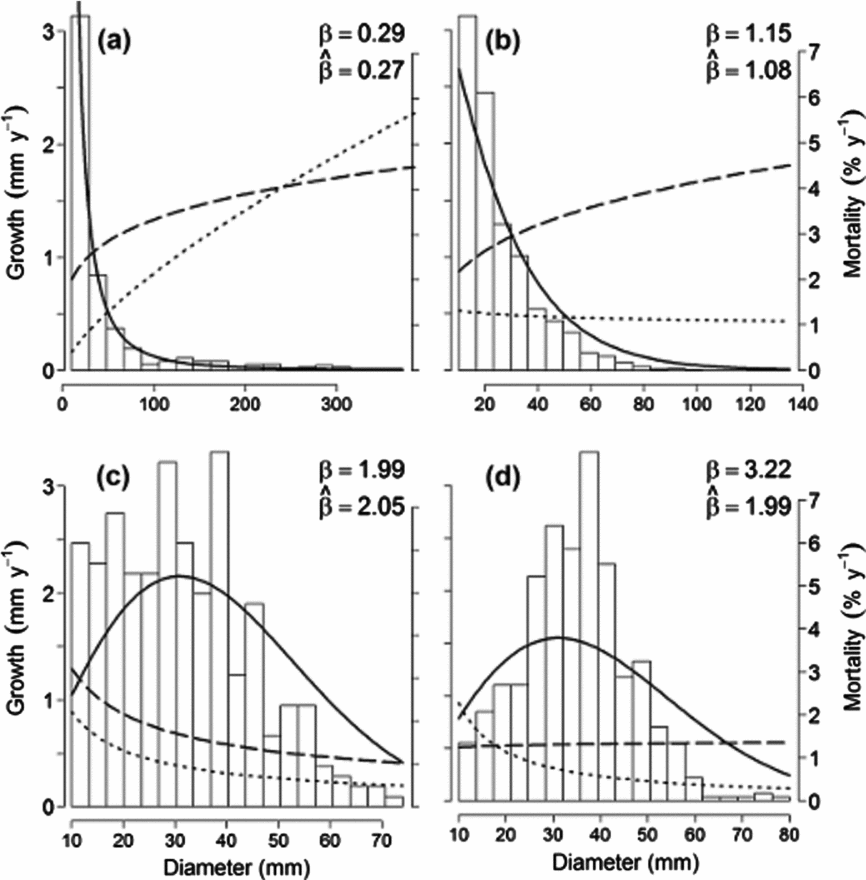
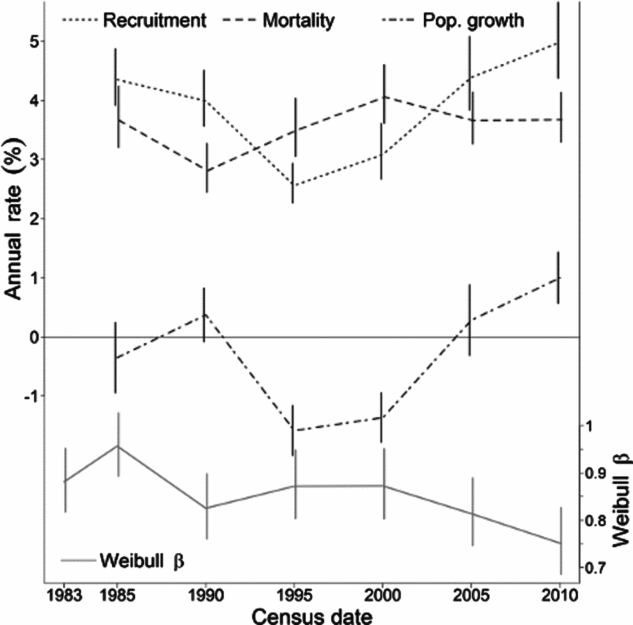
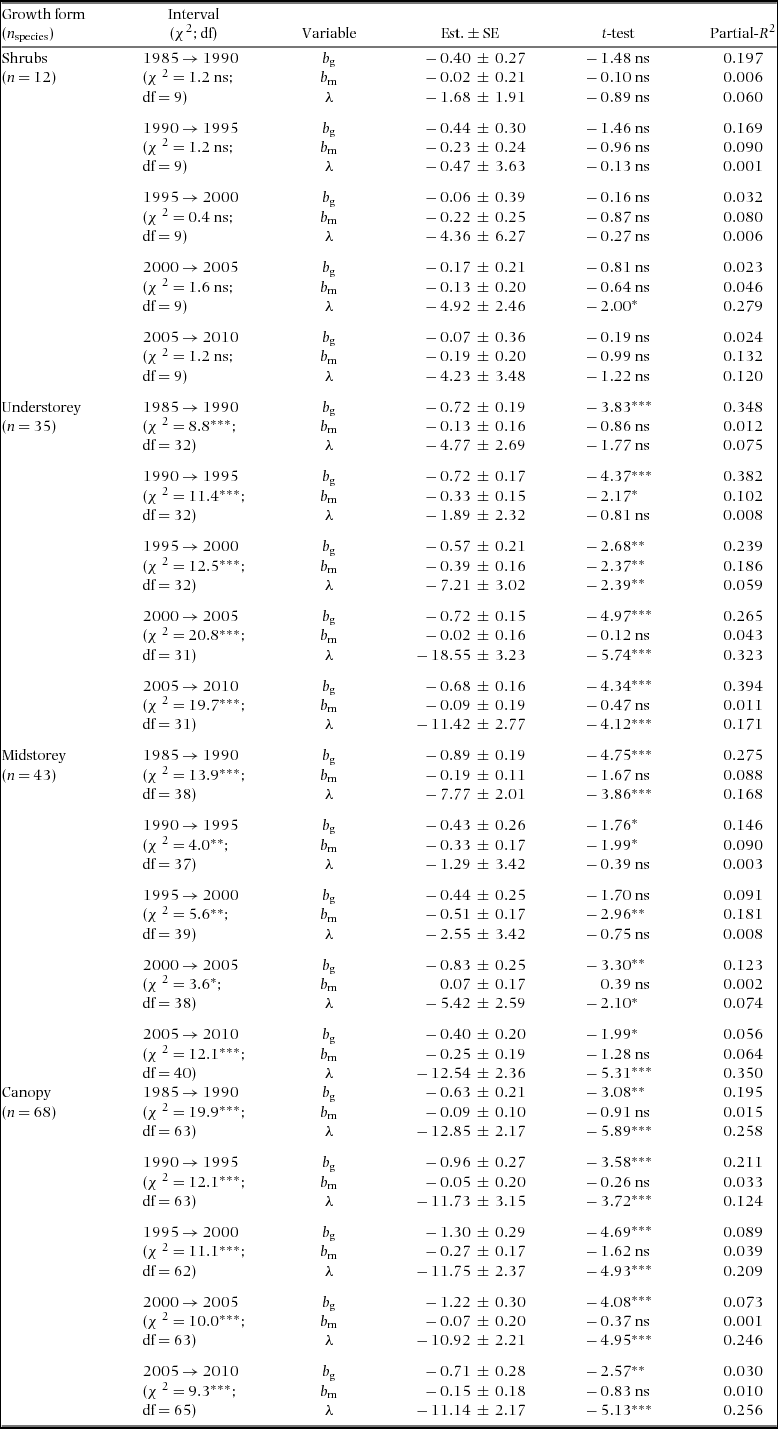
The Weibull shape parameter β was significantly negatively related to bg and λ across species in all census intervals, and negatively related with bm in three of five census intervals (Table 2). That is, diameter distributions were less skewed (higher β) for populations with relatively higher growth and mortality rates at small compared with large dbh (lower b g and b m), and lower population growth rates (lower λ). Indeed, 80% of the species with the least skewed distributions (β > 2) had negative b g; e.g. T. nervosa (Figure 1). Consistent with the general effects of λ, there were examples of high β associated with population decline (e.g. Celtis schippii and Erythrina costaricensis) and low β associated with population increase (e.g. Hampea appendiculata and Miconia argentea). Estimates of the demographic parameters for all species are given at http://dx.doi.org/10.5479/10088/28131. At the community level, there was substantial variation in mean λ and β over time, with a trend for concurrent changes between these two parameters (Figure 2).
Results of the multiple generalized linear regression of the Weibull shape parameter β of tree species size distributions on the growth-dbh curve exponent (b g), the mortality-dbh curve exponent (b m) and the population growth rate (λ) in the Barro Colorado Island 50-ha plot. Analyses were performed separately for each census interval, and they related size distributions at the end of the census interval to demographic rates assessed in that census interval. Values of the regression coefficients of each demographic variable and their respective standard error (Est. ± SE), t-test and pseudo-R 2 are given with the Chi-squared statistics (χ2) of the overall model for each interval. df: degrees of freedom; *: P < 0.05; **: P < 0.01; ***: P < 0.001; ns = not significant (i.e. P > 0.05).

Examples of species diameter distributions from the Barro Colorado Island 50-ha plot (white bars), together with the power-function fits of their growth-dbh curve (dotted line – left y-axis), the power-function fits of their mortality-dbh curve (dashed line- right y-axis) and the expected Weibull (solid line) given the power-function fit of growth and assuming constant mortality. The maximum likelihood estimate (β) and the predicted ( ${\rm{\hat \beta }}$) Weibull shape parameters of the diameter distribution are given on each panel. Note that the x-axis ranges differ among species. The four species, namely Eugenia nesiotica (a), Desmopsis panamensis (b), Herrania purpurea (c) and Talisia nervosa (d), varied less than 0.5% in their population size over the past 30 years and their growth and mortality curves were fairly well described by power functions. Distributions and parameters values are shown for the 2010 census and 2005–2010 census interval.
Temporal trends in mean demographic rates and size distribution shape parameters for 174 species over 30 y of monitoring at the Barro Colorado Island 50-ha plot. Lines connect the mean annual rates of mortality (dashed line), recruitment (dotted line), population growth (dash-dotted line) and Weibull shape parameter β (solid grey line). The vertical lines indicate 95% confidence intervals around these means. Demographic rates are given in percentages in the left y-axis. The horizontal line at zero separates declining populations (λ < 0) from increasing populations (λ > 0). The values of β are given in the right y-axis in a different scale.
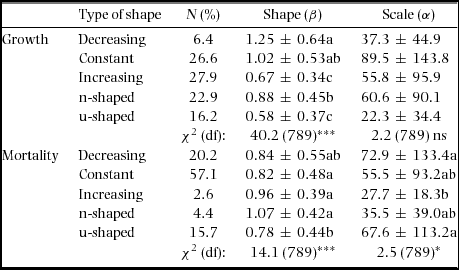
The growth exponent bg explained the largest proportion of the variation in β for every census interval (partial R 2 of 0.20–0.34), while the amount of variation explained by λ and bm was lower and varied with the census interval (Table 2). Overall regression results were similar when we considered growth forms separately, although the effect of bm on β was statistically significant only for understorey and midstorey species (Appendix 5). Similar results were obtained when species with non-monotonic growth-dbh and mortality-dbh curves were excluded or when using qualitative classifications of growth-dbh and mortality-dbh curve shape (i.e. decreasing, constant, increasing, n-shaped or u-shaped – Appendices 6, 7) instead of bg and bm (results not shown).
For all census intervals, the observed Weibull parameters were positively related to the parameters expected based on the analytical derivations parameterized with fitted power-function growth and constant mortality parameters. We found fairly narrow confidence intervals for the slope of the major axis regression for β that included 1, but the corresponding intervals for the slope for α generally did not (Figure 3). More generally, the relationship between observed and predicted α was much more variable than for β, even when non-monotonic growth curves were excluded (results not shown). It is important to note that species with highly skewed distributions (observed β < 0.25) were not included in this analysis.
Predicted vs. observed shape (β) and scale (α) parameters of the Weibull size distribution for individual species for each census interval of the Barro Colorado Island 50-ha plot and the associated major axis regression lines (solid) and 1:1 lines (dashed) for census intervals 1985–1990 (a–b), 1990–1995 (c–d), 1995–2000 (e–f), 2000–2005 (g–h) and 2005–2010 (i–j). Observed parameters were obtained from fitting diameter distributions at the end of the census interval while predicted parameters were obtained from fitted power-function growth-dbh fits and mean population mortality rate during the census interval. The legend gives the slope of the major axis regression (s), its 95% confidence intervals in parentheses and the Pearson correlation coefficient (r) between log-transformed variables. Differences in point shading indicate deviations from demographic equilibrium as assessed by per capita population growth rates, with lighter colours indicating greater deviations from equilibrium.
DISCUSSION
Tree size distributions were related to concurrently measured demographic rates across species. The shape of growth-dbh curves and population growth rates were the most important factors explaining variation in the shape of species size distributions. These findings support the suggestion of previous studies that interspecific variation in size-dependent growth is the primary determinant of interspecific variation in the shape of tree size distributions (Condit et al. Reference CONDIT, SUKUMAR, HUBBELL and FOSTER1998, Kohyama et al. Reference KOHYAMA, SUZUKI, PARTOMIHARDJO, YAMADA and KUBO2003, Reference KOHYAMA, POTTS, KOHYAMA, KASSIM and ASHTON2015; Leak Reference LEAK2002, Muller-Landau et al. Reference MULLER-LANDAU, CONDIT, HARMS, MARKS, THOMAS, BUNYAVEJCHEWIN, CHUYONG, CO, DAVIES, FOSTER, GUNATILLEKE, GUNATILLEKE, HART, HUBBELL, ITOH, KASSIM, KENFACK, LAFRANKIE, LAGUNZARD, LEE, LOSOS, MAKANA, OHKUBO, SAMPER, SAKUMAR, SUN, SUPARDI, TAN, THOMAS, THOMPSON, VALENCIA, VALLEJO, MUÑOZ, YAMAKURA, ZIMMERMAN, DATTARAJA, ESUFALI, HALL, HE, HERNÁNDEZ, KIRATIPRAYOON, SURESH, WILLS and ASHTON2006). Variation in size-dependent mortality was less important, especially for canopy species, but was still significant for the majority of census intervals. This finding is especially notable considering the lower power to test influences of mortality. Despite the 30-y interval, a number of species had very few death events, limiting the power to detect influences of size-dependent mortality on size distributions. Overall, our findings show that less skewed dbh distributions are associated with decreasing growth-dbh and mortality-dbh curves and with declining populations.
We found that modal, low-skewness size distributions were not necessarily indicative of population decline. Such distributions may instead reflect faster juvenile growth (relative to growth of larger individuals), higher juvenile mortality, and/or sporadic recruitment (Bin et al. Reference BIN, YE, MULLER-LANDAU, WU, LIAN and CAO2012, Feeley et al. Reference FEELEY, DAVIES, NOOR, KASSIM and TAN2007, Kohira & Ninomiya Reference KOHIRA and NINOMIYA2003, Kohyama et al. Reference KOHYAMA, POTTS, KOHYAMA, KASSIM and ASHTON2015). Indeed we found examples of low-skewness diameter distributions associated with increasing populations (e.g. Herrania purpurea), which were generally the result of steeply declining growth-dbh curves. Community-wide, however, we found that interspecific variation in population growth rates was almost as important as growth patterns in explaining variation in size distributions. This finding contrasts with Condit et al. (Reference CONDIT, SUKUMAR, HUBBELL and FOSTER1998) who found only a weak relationship for understorey species, a difference that can be attributed to the different metric to describe size distributions used here. We also found evidence that species with u-shaped and decreasing mortality-dbh curves had more skewed size distributions than species with decreasing, constant, or n-shaped mortality-dbh curves (Appendices 8, 9), a finding contrary to the suggestion of Bin et al. (Reference BIN, YE, MULLER-LANDAU, WU, LIAN and CAO2012) that u-shaped growth-dbh and/or mortality-dbh curves can generate low-skewness size distributions.
We documented strong temporal variation in community-level recruitment and mortality, and showed that interspecific variation in population growth rates of BCI species was associated mainly with variation in recruitment rates, rather than variation in annual mortality rates. Temporal variation in demographic rates is likely related to inter-annual climate variation including that associated with the El Niño Southern Oscillation (ENSO). El Niño events are associated with increased solar radiation and enhanced fruit production on BCI (Wright et al. Reference WRIGHT, CARRASCO, CALDERON and PATON1999), and can also alter size-dependent patterns of tree growth and mortality (Condit et al. Reference CONDIT, HUBBELL and FOSTER1995, Reference CONDIT, AGUILAR, HERNANDEZ, PEREZ, LAO, ANGEHR, HUBBELL and FOSTER2004; Nakagawa et al. Reference NAKAGAWA, TANAKA, NAKASHIZUKA, OHKUBO, KATO, MAEDA, SATO, MIGUCHI, NAGAMASU, OGINO, TEO, HAMID and LEE2000, but see Williamson et al. Reference WILLIAMSON, LAURANCE, OLIVEIRA, DELAMONICA, GASCON, LOVEJOY and POHL2000). The increase in recruitment from 1995 on, most probably induced by higher sapling growth into the small dbh classes, may be related to the strong 1982–1983, 1991–1992 and 1997–1998 El Niño events, and the lower recruitment rate between 1990 and 1995 may be related to the strong La Niña of 1988–1989 (http://www.cpc.ncep.noaa.gov/products/analysis_monitoring). El Niño/La Niña effects on mortality and growth are immediate, whereas effects on recruitment to 1 cm dbh are probably delayed by a decade or more. Fluctuations in recruitment over time may be important to the shape of tree size distributions (Bin et al. Reference BIN, YE, MULLER-LANDAU, WU, LIAN and CAO2012). Steady increases or decreases in population size over time (λ ≠ 0) also have systematic effects on size distributions (Kohyama et al. Reference KOHYAMA, SUZUKI, PARTOMIHARDJO, YAMADA and KUBO2003, Reference KOHYAMA, POTTS, KOHYAMA, KASSIM and ASHTON2015). In general, an increasing population will cause recruitment to exceed the number of individuals that die or grow out from the small size classes, leading to a disproportionate increase in these classes, making the size distribution more skewed.
Consistent with previous studies (King et al. Reference KING, DAVIES and NOOR2006), different growth forms had different patterns of size-dependency of growth, resulting in differences in the shape of their size distributions. The average value of b g, which reflects the inclination of the growth-dbh curves, was lower for shrubs and higher for canopy species, revealing different growth strategies. These results support the idea that trees with different life-history strategies have different size distributions (Wright et al. Reference WRIGHT, MULLER-LANDAU, CONDIT and HUBBELL2003). But it also reinforces that the differences between such strategies are mainly related to their growth patterns. Therefore, one could expect differences in size distributions between forests with similar proportion of life-histories but different conditions for growth (e.g. canopy openness) or trade-offs in species performance related to different ratios of population mortality to growth rates, as suggested by Kohyama et al. (Reference KOHYAMA, POTTS, KOHYAMA, KASSIM and ASHTON2015). We found little evidence of certain growth forms having relatively more species with modal growth-dbh or u-shaped mortality-dbh curves, patterns that would suggest senescence and exogenous disturbances dominating over competition after a certain tree size (Coomes & Allen Reference COOMES and ALLEN2007, Goff & West Reference GOFF and WEST1975). More detailed descriptions of the shape of the growth-dbh and mortality-dbh curves could better test this idea.
Predicted and fitted Weibull parameters were strongly related, confirming that the Weibull is not only a good phenomenological description; it is also a useful model of the demographic process underlying tree size distributions (Muller-Landau et al. Reference MULLER-LANDAU, CONDIT, HARMS, MARKS, THOMAS, BUNYAVEJCHEWIN, CHUYONG, CO, DAVIES, FOSTER, GUNATILLEKE, GUNATILLEKE, HART, HUBBELL, ITOH, KASSIM, KENFACK, LAFRANKIE, LAGUNZARD, LEE, LOSOS, MAKANA, OHKUBO, SAMPER, SAKUMAR, SUN, SUPARDI, TAN, THOMAS, THOMPSON, VALENCIA, VALLEJO, MUÑOZ, YAMAKURA, ZIMMERMAN, DATTARAJA, ESUFALI, HALL, HE, HERNÁNDEZ, KIRATIPRAYOON, SURESH, WILLS and ASHTON2006). However, observed parameters varied considerably around predicted values, particularly for the scale parameter, variation that can be explained by deviations from the assumptions underlying the predictions. First, many population sizes were not stable over time, thus violating the central assumption of demographic equilibrium (Muller-Landau et al. Reference MULLER-LANDAU, CONDIT, HARMS, MARKS, THOMAS, BUNYAVEJCHEWIN, CHUYONG, CO, DAVIES, FOSTER, GUNATILLEKE, GUNATILLEKE, HART, HUBBELL, ITOH, KASSIM, KENFACK, LAFRANKIE, LAGUNZARD, LEE, LOSOS, MAKANA, OHKUBO, SAMPER, SAKUMAR, SUN, SUPARDI, TAN, THOMAS, THOMPSON, VALENCIA, VALLEJO, MUÑOZ, YAMAKURA, ZIMMERMAN, DATTARAJA, ESUFALI, HALL, HE, HERNÁNDEZ, KIRATIPRAYOON, SURESH, WILLS and ASHTON2006). Temporal variation in annual mortality and recruitment was evident at the community level as well (Figure 2) and can be attributed at least in part to climatic variation (Condit et al. Reference CONDIT, HUBBELL and FOSTER1995, Nakagawa et al. Reference NAKAGAWA, TANAKA, NAKASHIZUKA, OHKUBO, KATO, MAEDA, SATO, MIGUCHI, NAGAMASU, OGINO, TEO, HAMID and LEE2000). Second, the predicted Weibull parameters are based on the assumptions of size-independent mortality and power function size-dependent growth, whereas mortality was clearly size-dependent for many species, and growth-dbh relationships were not always well described by power functions. For these species, more flexible functions may be required to describe growth-dbh and mortality-dbh curves (Muller-Landau et al. Reference MULLER-LANDAU, CONDIT, HARMS, MARKS, THOMAS, BUNYAVEJCHEWIN, CHUYONG, CO, DAVIES, FOSTER, GUNATILLEKE, GUNATILLEKE, HART, HUBBELL, ITOH, KASSIM, KENFACK, LAFRANKIE, LAGUNZARD, LEE, LOSOS, MAKANA, OHKUBO, SAMPER, SAKUMAR, SUN, SUPARDI, TAN, THOMAS, THOMPSON, VALENCIA, VALLEJO, MUÑOZ, YAMAKURA, ZIMMERMAN, DATTARAJA, ESUFALI, HALL, HE, HERNÁNDEZ, KIRATIPRAYOON, SURESH, WILLS and ASHTON2006), and these in turn would generate size distributions that are not Weibull. Incorporating population growth rates into predictions of size distributions would also be expected to improve the fit with observed distributions (as in Kohyama et al. Reference KOHYAMA, POTTS, KOHYAMA, KASSIM and ASHTON2015). All these sources of variation may make it difficult to accurately infer b g and m from size distributions. Nonetheless, the relationship between predicted and fitted Weibull parameters support the conclusion that size distributions can be used as indicators of general patterns of growth and mortality.
ACKNOWLEDGEMENTS
We thank the Center for Tropical Forest Science (CTFS), especially Stuart Davies, for support. We are grateful to R. Foster, S. Lao, R. Pérez, S. Aguilar, A. Hernandez and many field assistants for species identifications, tree measurements and database management. We also thank Nadja Rüger for helpful comments and for providing the digital version of the growth rate estimates of BCI species from Rüger & Condit (Reference RÜGER and CONDIT2012). The 30 years of monitoring of the BCI plot was funded by the US National Science Foundation, the John D. and Catherine T. MacArthur Foundation, the World Wildlife Fund, the Earthwatch Center for Field Studies and the Smithsonian Tropical Research Institute. RAFL was supported by CAPES and by grants #09/53413-5 and #2013/08722-5, São Paulo Research Foundation (FAPESP). PIP was supported by CNPq (grant 303878/2008-8). This manuscript was substantially advanced during the CTFS/SIGEO analytical workshop funded by the US National Science Foundation (DEB-1046113).
APPENDICES
Appendix 1. Sensitivity of growth parameters to the methods used to fit growth-dbh relationships.
In this study, we fitted power functions to growth-dbh curves of BCI species, through a regression approach to size class binned growth rates that modelled growth as a function of instantaneous dbh. Other studies have used other approaches to estimate power-function parameters for growth. Rüger & Condit (Reference RÜGER and CONDIT2012) accounted for diameter measurement errors to assess true growth rates and used hierarchical Bayesian models capable of including rare species. Rüger & Condit (Reference RÜGER and CONDIT2012) present estimates of the effect of dbh on growth in models that take into account other predictive variables that could affect growth, such as light. Estimates of dbh effect on models having only dbh as predictive variable were kindly provided by the authors. Here we compare the estimates of the power-function exponent of growth curves of Rüger & Condit (Reference RÜGER and CONDIT2012) to the ones obtained in this study to assess the robustness of the interspecific patterns we analyse.
Fitted parameters were available for comparison for 84 BCI species, and for the 1985–1990 and 1990–1995 census intervals. There was a strong positive relationship (r> 0.75) between the power-function estimates obtained when taking diameter measurement error distributions into account (Rüger & Condit Reference RÜGER and CONDIT2012) and the ones obtained in this study (Appendix 2). The confidence intervals for the slope estimates however did not include one (i.e. perfect linear relationship).
The quantitative differences between the two sets of parameters are not surprising considering the differences in the analyses. First, our analyses fitted growth as a function of instantaneous dbh rather than dbh at the start of the census interval, which means that a given growth data point essentially corresponds to a larger dbh in our analysis than in their analysis (Muller-Landau et al. Reference MULLER-LANDAU, CONDIT, HARMS, MARKS, THOMAS, BUNYAVEJCHEWIN, CHUYONG, CO, DAVIES, FOSTER, GUNATILLEKE, GUNATILLEKE, HART, HUBBELL, ITOH, KASSIM, KENFACK, LAFRANKIE, LAGUNZARD, LEE, LOSOS, MAKANA, OHKUBO, SAMPER, SAKUMAR, SUN, SUPARDI, TAN, THOMAS, THOMPSON, VALENCIA, VALLEJO, MUÑOZ, YAMAKURA, ZIMMERMAN, DATTARAJA, ESUFALI, HALL, HE, HERNÁNDEZ, KIRATIPRAYOON, SURESH, WILLS and ASHTON2006). Second, our estimates were based on regressions of size class means, while their estimates were based on individual-level data. Ours are thus potentially sensitive to unusual values in size classes (typically larger size classes) with few individuals. On the other hand, theirs will, for many species, be dominated by the many individuals of small sizes and may thus do less well at representing patterns for large sizes. Third, we separately fitted functions for each species, while they used a hierarchical approach in which fits for rare species borrow strength from fits for more common species. This means that our parameters reflect only data for the relevant species, with more sensitivity to potentially unusual values for rare species, while theirs may pull values for rare species to means for more common species. This explains why our estimates are more variable across species than theirs. Fourth, they accounted for measurement errors by including an empirical measurement distribution in the analyses and modelling latent variables for actual size of each individual at each census, while we dealt with diameter measurement errors by averaging over multiple observations within each size class.
Despite the differences, the strong community-level relationship between the two sets of parameters suggests that the qualitative conclusions of our study would remain unaltered if we took a different approach to fitting growth rates.
Appendix 2. The exponent b g of the power function relating absolute diameter growth to diameter obtained in this study (x-axis) compared with the exponent from hierarchical models obtained by Rüger & Condit (Reference RÜGER and CONDIT2012), which accounted for diameter measurement errors (y-axis), for two census intervals of the Barro Colorado Island 50-ha plot: 1985–1990 (a) and 1990–1995 (b). The solid line is the major axis regression which has slope s (95% confidence intervals in parentheses). The dashed line is the 1:1 line.
Appendix 3. Frequency distributions of the mean fitted Weibull shape (a) and scale (b) parameters of the diameter distributions of 174 tree species found at the Barro Colorado Island 50-ha plot. The two Weibull parameters, particularly α, had asymmetrical distributions among species and were well approximated by log-normal distributions (solid lines), whose maximum likelihood estimates are presented in the legend of each panel. For the shape parameter, the vertical dashed line separates values of β that describe distributions with a mode (β > 1) from those without a mode (β < 1).
Appendix 4. Frequency distribution of the mean fitted power-function exponents of the growth-dbh curve, b g(a), and of the mortality-dbh curve, b m(b), as well as the distribution of mean population growth rates, λ(c) among Barro Colorado Island tree species. The distributions of the exponents b g and b m were more asymmetrical than the distribution of λ, and there was a clear tendency of growth curves having more positive estimates (increasing growth curves). The means (± SD) of b g, b m and λ were 0.29 ± 0.34, −0.09 ± 0.33 and −0.003 ± 0.019, respectively. For exponents b g and b m, the vertical dashed lines at 0 separate the values of b that separates decreasing from increasing curves, while for λ the vertical line separates decreasing from increasing populations.
Results of the multiple generalized linear regression of the Weibull shape parameter β on the growth-dbh curve exponent (b g), the mortality-dbh curve exponent (bm) and the values of population growth rate (λ) for each growth form separately. The coefficients of each demographic variable and their respective standard errors (Est. ± SE) are given with the t-test to assess the importance of variables in the model, their partial pseudo-R 2 and the Chi-squared statistics (χ2) of the overall model for each interval. Analyses included only the last five census intervals available for the BCI plot. df = degrees of freedom; *: P < 0.05; ***: P < 0.001; ns = not significant.
Appendix 6. Classification of growth and mortality curves into different shape classes and the relationship with their power-function fits.
Curves of growth and mortality as a function of tree size can have monotonic and non-monotonic shapes, among which the most common are (1) constant, (2) decreasing, (3) increasing, (4) modal (n-shaped) and (5) u-shaped (Coomes & Allen Reference COOMES and ALLEN2007, Harcombe Reference HARCOMBE1987, Rüger et al. Reference RÜGER, HUTH, HUBBELL and CONDIT2011). In this study, although the majority of the species could be well described by monotonic functions such as power functions, other species had curves with clearly non-monotonic shapes. Therefore, a model selection procedure was performed to classify growth and mortality curves as monotonic or non-monotonic. This selection was carried out by competing the fit of three candidate functions, namely constant (y = constant), quadratic (y ~ a + bx + cx 2) and power-function (y ~ axb). First, functions were fitted to mean growth and mortality rates per dbh size classes whose limits were chosen to be approximately evenly distributed on log(dbh): 10, 12, 14, 16, 18, 20, 24, 28, 32, 36, 40, 45, 50, 60, 70, 80, 90, 100, 120, 140, 160, 180, 200, 240, 280, 320, 360, 400, 450, 500, 600, 700, 800, 900 and 1000 mm. The use of size class averages was intended to avoid bias related to the larger number of small trees and deal with negative growth observations related to measurement errors.
These functions were fitted for each species at each census interval, with the exception of the first interval for which growth data were not used (see main text Methods). Then, growth-dbh or mortality-dbh curves were classified into the five shape classes depending on the simultaneous comparison of the performance of each candidate function, which was evaluated based on their Akaike Information Criteria (AIC) value (Burnham & Anderson Reference BURNHAM and ANDERSON2002). In cases of draws, in which differences between AIC values of the candidate models (ΔAIC) were smaller than ln(8) (Burnham & Anderson Reference BURNHAM and ANDERSON2002), curves were assigned the model with fewer parameters.
Next, curves were classified as follows. Whenever the constant model was selected as a plausible model, growth-dbh/mortality-dbh curves were classified as constant (independent of dbh). Species were classified as increasing or decreasing when the constant model was not selected as plausible, but the power-function was, independent of the performance of the quadratic model. The classification into increasing or decreasing depended on the sign of the b exponent. When the quadratic model was the best model, the curve was classified as n-shaped (concave) or u-shaped (convex) depending on the sign of c.
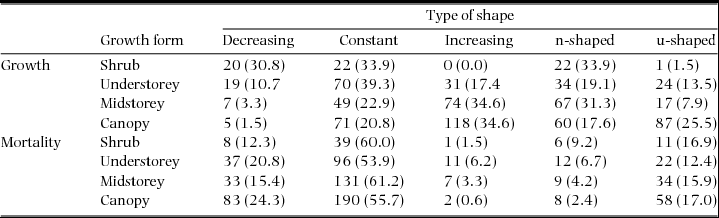
We found that 39% and 20% of species had non-monotonic growth and mortality curves in one census interval or more (Appendix 8). Although we found small differences in the parameters of the fitted Weibull dbh distributions between types of curves, we found no evidence that non-monotonic growth and mortality curves were associated with different dbh distributions than monotonic curves. There was good agreement between the classification in types of shape and the description of growth and mortality curves using power-functions (i.e. values of the b exponent), except for the non-monotonic curves for which the power-function tended to fit growth-dbh and mortality-dbh curves that were more or less increasing and constant, respectively (Appendix 9). The proportions of different types of shape among growth forms were quite similar with few exceptions (Appendix 10). Regarding growth, shrubs had much larger contributions of decreasing growth-dbh curves than midstorey and canopy species. The opposite was true regarding increasing curves. For mortality, trends were much more similar among growth forms.
Summary of the types of shape of the growth-dbh and mortality-dbh curves and their mean ± SD of shape (β) and scale (α) parameters. N(%): percentage of species in each type of shape. Values of shape and scale are the mean ± SD for all censuses together. Chi-squared statistics (χ2) present the results of the analyses of deviance of shape with species as random effects. Letters indicate pairwise significant differences among growth forms. df = degrees of freedom; *: P < 0.05; ***: P < 0.001; ns= not significant (i.e. P > 0.05).
Appendix 8. Notched box plots of the distribution of power-function exponents of growth (a) and mortality curves (b) among Barro Colorado Island 50-ha plot species classified into each of the five types of curves. The width of the box plots is proportional to the number of species within each group. Types of shape are decreasing (DECR), constant (CNST), increasing (INCR), modal or n-shaped (N-SHP) and u-shaped (U-SHP). The dotted line at 0 separates the values of b that describe increasing vs. decreasing curves.
Distribution of types of growth-dbh and mortality-dbh curves by growth form for all species-census combinations. Values in parentheses are percentages.