Introduction
While symptoms of depression lie on a continuum of severity and are measured by continuous scales, most clinical decisions are of categorical ‘yes-or-no’ nature, e.g. whether to initiate, continue or change an antidepressant. The need to support categorical decision making has led to the creation of cut-offs to dichotomize continuous measures. The most widely used categorizations of continuous scales are distinctions between responders and non-responders or remitters and non-remitters, which have become a standard way of reporting outcomes in clinical trials on depression and schizophrenia. On closer examination, most of these categorizations by cut-off appear arbitrary, based on little evidence and ill-suited to research applications (Fahndrich, Reference Fahndrich1984; Prien et al. Reference Prien, Carpenter and Kupfer1991; Mulder et al. Reference Mulder, Joyce and Frampton2003). Using such reduced outcomes is especially problematic in translational research, such as pharmacogenetics, which often depends on the statistically less powerful tests of interactions (Rietschel et al. Reference Rietschel, Kennedy, Macciardi and Meltzer1999).
The problems with categorizing a continuous outcome based on cut-offs are numerous. First, the arbitrary nature of the definition of remission becomes apparent when we compare the definitions of response and remission across disorders. In depression, ‘response’ is commonly defined as a 50% reduction in the initial symptom score (Montgomery, Reference Montgomery1994), but in schizophrenia, 40% or even 20% improvement is accepted as a response (Leucht et al. Reference Leucht, Heres, Hamann and Kane2008). When an empirical test of a cut-off for response in depression was attempted, the results suggested that a 60% improvement may be a more valid definition (Mulder et al. Reference Mulder, Joyce and Frampton2003). Similarly, a score of ⩽7 on the 17-item Hamilton Depression Rating Scale (HAMD17) has been proposed as a cut-off for defining ‘remission’ in depression (Frank et al. Reference Frank, Prien, Jarrett, Keller, Kupfer, Lavori, Rush and Weissman1991), but empirical analyses suggested a higher score and indicated that the Montgomery–Åsberg Depression Rating Scale (MADRS) is more suitable for defining remission (Mulder et al. Reference Mulder, Joyce and Frampton2003). Second, it has been demonstrated that dichotomizing a continuous score leads to inefficient analyses as it commonly cuts in the densest part of the distribution and allocates the same value to subjects who reached or missed the cut-off by a lot or by very little. It has been estimated that dichotomizing a continuous score without evidence for a bimodal distribution is equivalent to throwing away one-third of the sample (Streiner, Reference Streiner2002; Royston et al. Reference Royston, Altman and Sauerbrei2006). Third, dichotomization is based on a specified end point and requires restrictive assumptions about subjects who have missing data for that specified time point. Most commonly, the data are replaced by the last observation carried forward (LOCF) procedure, which assumes that subjects maintain the same level of severity as when the last valid observation was made. It has been repeatedly demonstrated that LOCF leads to grossly biased results (Mallinckrodt et al. Reference Mallinckrodt, Clark and David2001; Lane, Reference Lane2008). Fourth, response to antidepressants and other psychotropic medication evolves over time and it has been suggested that a temporal pattern of change may differentiate antidepressant response from placebo response (Quitkin et al. Reference Quitkin, Rabkin, Ross and Stewart1984; Beunckens et al. Reference Beunckens, Molenberghs, Verbeke and Mallinckrodt2008; Muthén et al. Reference Muthén, Brown, Leuchter, Hunter and Shrout2008). A dichotomization or any categorization based on end-point scores ignores the temporal pattern of change and relies on a single measurement, which is likely to be influenced by factors other than antidepressant treatment as it is relatively remote from the initiation of the antidepressant.
Given the numerous problems with traditional dichotomous outcomes and the need to support categorical decision making in clinical practice, it is our aim to explore alternative categorical outcomes that account for a temporal course of symptom change. Recent advances in statistical modelling make it possible to categorize subjects based on temporal patterns of change with latent variable methods, such as growth mixture modelling (GMM) (Beunckens et al. Reference Beunckens, Molenberghs, Verbeke and Mallinckrodt2008; Muthén & Asparouhov, Reference Muthén, Asparouhov, Fitzmaurice, Davidian, Verbeke and Molenberghs2008). In contrast to conventional methods of dichotomization, GMM searches for heterogeneity as it naturally occurs in the data. The fit of GMM can be compared with a single class model to establish whether categorization adds explanatory value to a single mean growth curve. In the present report, we apply GMM to data from the Genome-based Therapeutic Drugs for Depression (GENDEP) project, a large clinical and pharmacogenetic study, comparing two active antidepressants with distinct modes of action. We evaluate the alternative categorical outcomes by comparison to a mixed model analysis of the original continuous measures and by testing their effectiveness in pharmacogenetic analyses. Using course of change in pharmacogenetic analyses has been proposed (Rietschel et al. Reference Rietschel, Kennedy, Macciardi and Meltzer1999), but not yet applied. As specific pharmacogenetic hypotheses on associations between polymorphisms in functional candidate genes and response to antidepressants with corresponding modes of action have been tested in GENDEP (Uher et al. Reference Uher, Huezo-Diaz, Perroud, Smith, Rietschel, Mors, Hauser, Maier, Kozel, Henigsberg, Barreto, Placentino, Dernovsek, Schulze, Kalember, Zobel, Czerski, Larsen, Souery, Govannini, Gray, Lewis, Farmer, Aitchison, McGuffin and Craig2009a), the ability to detect the hypothesized pharmacogenetic associations serves as a tentative external validator for alternative categorical classifications of outcome.
Methods
Study design and sample
GENDEP is a part-randomized multi-centre clinical and pharmacogenetic study with two active pharmacological treatment arms. Adult participants (514 women and 297 men) of white European ethnicity suffering from unipolar major depression of at least moderate severity established using the SCAN interview (Wing et al. Reference Wing, Sartorius and Ustin1998) were recruited in eight European countries: Belgium; Croatia; Denmark; Germany; Italy; Poland; Slovenia; UK. Exclusion criteria were personal or family history of bipolar affective disorder or mood-incongruent psychotic symptoms and active substance dependence. Participants were on average 43 years old [standard deviation (s.d.)=12], with onset of depressive disorder at age 33 (s.d.=10) and duration of the current episode of 19 weeks (s.d.=12). Patients with no contraindications were randomly allocated to receive flexible dosage nortriptyline (n=235) or escitalopram (n=233) for 12 weeks. Patients with contraindications for one of the drugs were allocated non-randomly to the other antidepressant: 225 to escitalopram and 118 to nortriptyline. Of the 811 participants, 628 (77%) completed 8 weeks and 527 (65%) completed 12 weeks on the originally allocated antidepressant. The weekly measurements of depression severity were 93% complete. The sample, study design and primary outcomes have been described in detail elsewhere (Uher et al. Reference Uher, Maier, Hauser, Marusic, Schmael, Mors, Henigsberg, Souery, Placentino, Rietschel, Zobel, Dmitrzak-Weglarz, Petrovic, Jorgensen, Kalember, Govannini, Barreto, Elkin, Landau, Farmer, Aitchison and McGuffin2009b).
Measures of depressive symptoms
Depressive symptoms were assessed weekly using three established measures of depression severity. The clinician-rated 10-item MADRS (Montgomery & Asberg, Reference Montgomery and Asberg1979), the clinician-rated HAMD17 (Hamilton, Reference Hamilton1967) and the self-report 21-item Beck Depression Inventory (BDI; Beck et al. Reference Beck, Ward, Mendelson, Mock and Erbaugh1961) were administered at week 0 (baseline) and then weekly for 12 weeks. MADRS and HAMD17 were administered by trained psychologists and psychiatrists who achieved an inter-rater reliability of 0.9 (Uher et al. Reference Uher, Farmer, Maier, Rietschel, Hauser, Marusic, Mors, Elkin, Williamson, Schmael, Henigsberg, Perez, Mendlewicz, Janzing, Zobel, Skibinska, Kozel, Stamp, Bajs, Placentino, Barreto, McGuffin and Aitchison2008). At baseline, the patients had a mean MADRS score of 28.7 (s.d.=6.7), HAMD17 score of 21.7 (s.d.=5.3), and BDI score of 28.0 (s.d.=9.7). In a psychometric analysis of these scales we found that MADRS was the most internally consistent and most informative of the three scales (Uher et al. Reference Uher, Farmer, Maier, Rietschel, Hauser, Marusic, Mors, Elkin, Williamson, Schmael, Henigsberg, Perez, Mendlewicz, Janzing, Zobel, Skibinska, Kozel, Stamp, Bajs, Placentino, Barreto, McGuffin and Aitchison2008). This is consistent with other reports that MADRS is more accurate and reflects clinician's impression better than HAMD17 (Mulder et al. Reference Mulder, Joyce and Frampton2003; Carmody et al. Reference Carmody, Rush, Bernstein, Warden, Brannan, Burnham, Woo and Trivedi2006). Therefore, MADRS total score is used as a primary outcome measure in GENDEP.
The definitions of response and remissions were based on literature. ‘Response’ is most often defined as a 50% reduction in the HAMD17 score from baseline and the same 50% reduction criterion is commonly applied to other scales, including MADRS and BDI (Prien et al. Reference Prien, Carpenter and Kupfer1991; Montgomery, Reference Montgomery1994; Mulder et al. Reference Mulder, Joyce and Frampton2003). Therefore, ‘response’ was defined as 50% reduction in baseline scores and we compare this definition for the three scales used in GENDEP. ‘Remission’ was defined by a consensus board as a score of ⩽7 on HAMD17 or ⩽8 on BDI (Frank et al. Reference Frank, Prien, Jarrett, Keller, Kupfer, Lavori, Rush and Weissman1991). There has been some debate over the thresholds for remission on MADRS: a threshold of ⩽11 was first suggested, but later investigations found that a MADRS total score of 10 or 9 better corresponds to the HAMD17 score of 7 (Zimmerman et al. Reference Zimmerman, Posternak and Chelminski2004; Carmody et al. Reference Carmody, Rush, Bernstein, Warden, Brannan, Burnham, Woo and Trivedi2006; Uher et al. Reference Uher, Farmer, Maier, Rietschel, Hauser, Marusic, Mors, Elkin, Williamson, Schmael, Henigsberg, Perez, Mendlewicz, Janzing, Zobel, Skibinska, Kozel, Stamp, Bajs, Placentino, Barreto, McGuffin and Aitchison2008). Therefore, we define ‘remission’ as reaching a score of ⩽7 on HAMD17, ⩽10 on MADRS and ⩽8 on BDI, based on the last valid observation over the 12-weeks, i.e. following the LOCF rule.
Genetic measures for pharmacogenetic analyses
To test the hypothesis that there is a specific association between genetic polymorphisms in key genes of the serotonergic and noradrenergic pathways and response to antidepressants with a corresponding mode of action, 116 single nucleotide polymorphism markers were genotyped, which tag common variance in 10 functional candidate genes. Four genes coding key proteins in the serotonin signalling included serotonin receptor genes HTR1A and HTR2A and genes coding for the rate-limiting enzymes in serotonin production, the tryptophan hydroxylases TPH1 and TPH2. Two genes involved in noradrenaline signalling were genes coding for the noradrenaline transporter SLC6A2 and for noradrenaline receptor ADRA2A. We also included four genes that have been shown to be involved in action of different types of antidepressants and are likely to play a role in the final common pathway of antidepressant effect: brain derived neurotrophic factor BDNF, its receptor NTRK2, the glucocorticoid receptor NR3C1 and its associated co-chaperone FKBP5. The rationale for candidate gene selection and details of the genetic methodology are described elsewhere (Uher et al. Reference Uher, Huezo-Diaz, Perroud, Smith, Rietschel, Mors, Hauser, Maier, Kozel, Henigsberg, Barreto, Placentino, Dernovsek, Schulze, Kalember, Zobel, Czerski, Larsen, Souery, Govannini, Gray, Lewis, Farmer, Aitchison, McGuffin and Craig2009a). It was hypothesized that sequence variation in the serotonergic genes will be associated with response to the serotonin-reuptake-inhibiting antidepressant escitalopram, variation in the genes involved in noradrenaline signalling will be associated with individual differences in response to the noradrenaline-reuptake-inhibiting nortriptyline and variation in the common pathway genes will be associated with response to both antidepressants. This hypothesis was confirmed using linear mixed models and repeated measurements of total MADRS scores as an outcome (Uher et al. Reference Uher, Huezo-Diaz, Perroud, Smith, Rietschel, Mors, Hauser, Maier, Kozel, Henigsberg, Barreto, Placentino, Dernovsek, Schulze, Kalember, Zobel, Czerski, Larsen, Souery, Govannini, Gray, Lewis, Farmer, Aitchison, McGuffin and Craig2009a). Here, we repeat the pharmacogenetic analyses with the reduced outcome measures of ‘response’, defined as 50% reduction in the HAMD17 score at the end of the 12-week acute treatment period with LOCF and of ‘latent trajectory’, defined as the most likely trajectory in the final piecewise growth mixture model with two latent classes (see below). These analyses were also repeated with MADRS-based remission, but as results were almost identical with HAMD-based remission, only one set of results is reported.
Growth mixture modelling
The time course of change in depressive symptoms during treatment was modelled in 807 individuals with at least one observed post-baseline data point on the originally allocated medication. As it was our aim to externally test the classification, information on drug or genotypes was not included in the model. To establish the best classification based on the longitudinal pattern of change, we applied a series of growth mixture models. GMM is a generalization of repeated-measure mixed effect regression. In addition to random effects, GMM accounts for subject heterogeneity in temporal patterns of change by latent classes corresponding to qualitatively distinct trajectories (Muthén & Asparouhov, Reference Muthén, Asparouhov, Fitzmaurice, Davidian, Verbeke and Molenberghs2008). Growth mixture models with linear, quadratic and cubic growth factors and piecewise models with up to two transition points were fitted in the Mplus program, version 5.1 (Muthén & Muthén, Reference Muthén and Muthén2008). These models allow a variety of straight and curved trajectories with up to two sharp breaking points to capture different rates of improvement at different stages of treatment. The best model was selected that provided a good description of the data with relatively few parameters and classified individuals into few trajectories, each of them including a significant number of subjects. Details of model fitting procedures and model selection are given in the on-line Technical Appendix.
Other statistical analyses
Analyses of continuous outcomes was performed using linear mixed effect models fitted with maximum likelihood as previously described (Uher et al. Reference Uher, Maier, Hauser, Marusic, Schmael, Mors, Henigsberg, Souery, Placentino, Rietschel, Zobel, Dmitrzak-Weglarz, Petrovic, Jorgensen, Kalember, Govannini, Barreto, Elkin, Landau, Farmer, Aitchison and McGuffin2009b). Linear mixed effect modelling uses all available measurements, takes account of non-independence of repeated measurements within individuals and provides unbiased estimates in the presence of missing data under relatively unrestrictive assumptions (Mallinckrodt et al. Reference Mallinckrodt, Clark and David2001; Gueorguieva & Krystal, Reference Gueorguieva and Krystal2004; Lane, Reference Lane2008).
Agreement between various definitions of categorical outcomes was tested using the Cohen's κ coefficient (Cohen, Reference Cohen1960). Drug comparisons on categorical outcomes were performed with logistic regression models. Where latent class membership was used as an outcome, the analyses were repeated with individual probabilities of class membership as probability weights. Effects of genotypes on categorical outcomes were tested in logistic regression, assuming additive genetic model, and were compared with previously reported results obtained with total MADRS score as a continuous outcome (Uher et al. Reference Uher, Huezo-Diaz, Perroud, Smith, Rietschel, Mors, Hauser, Maier, Kozel, Henigsberg, Barreto, Placentino, Dernovsek, Schulze, Kalember, Zobel, Czerski, Larsen, Souery, Govannini, Gray, Lewis, Farmer, Aitchison, McGuffin and Craig2009a). These analyses were implemented in Stata, release 10 (StataCorp, 2007).
Results
Latent trajectories of response to antidepressants
The aim of GMM was to find whether the individual variability in time course of change during antidepressant treatment can be captured in several types of trajectories of distinct shape. Simple growth models with linear and quadratic effects of time provided good representation of initial changes but tended to depart markedly from observed data in the second half of the 12-week period. This was due to a rapid rate of change in the initial weeks in a proportion of subjects. Addition of a cubic effect of time or separation of the growth into two serial components in a piecewise growth model improved the fit. Of the simple mean curve linear mixed effect models, the model with a cubic growth factor (Model 3.1) provided the best fit to the observe data. An even better fit was achieved with two-piece growth mixture models separately modelling the change in weeks 0–2 and in weeks 3–12 with linear change over the first period and a quadratic curve for the second period and allowing more than one class (Supplementary Table S1). Comparisons of models with different number of classes showed a marked advantage of a mixture model with two latent classes over a single-class model (p<0.0001) and a marginal advantage for a three-class model over model with two classes (p=0.0445, Supplementary Table S1). These models provided comparably good quality of classification of individuals into latent trajectory classes (see online Technical Appendix for details).
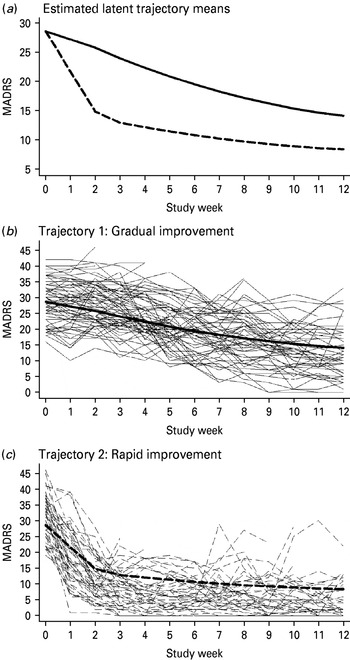
The two-class piecewise growth mixture model separated the subjects into a larger class of subjects with relatively slow and approximately linear improvement over the 12 weeks (class 1, gradual improvement; 75% subjects) and a smaller class of subjects with rapid improvement over the first 3 weeks, followed by a more gradual improvement over the rest of the study period (class 2, rapid improvement; 25% subjects; Fig. 1, Supplementary Table S2). The better outcome in the rapid improvement class was maintained until the end of the study period with 76% improvement compared with 56% in the gradual improvement class. In the three-class piecewise growth mixture model, a small third class separated with extremely rapid improvement and a floor effect after week 3 (6% subjects; Supplementary Table S3 and Fig. S5). As it was our aim to find an alternative to dichotomous outcome measures, the advantage of the three-class model was marginal and the additional class included only a small proportion of subjects, we primarily explored the usefulness of the classification based on the two-class piecewise growth mixture Model 4.2. Further details of model fitting results are available in the online Technical Appendix.
The final two-class piecewise growth mixture model. (a) Estimated latent trajectories; (b) estimated means and observed values in randomly selected 100 subjects for trajectory 1: gradual improvement; (c) estimated means and observed values in randomly selected 100 subjects for trajectory 2: rapid improvement. MADRS, Montgomery–Åsberg Depression Rating Scale.

Characteristics of individuals following distinct trajectories of change
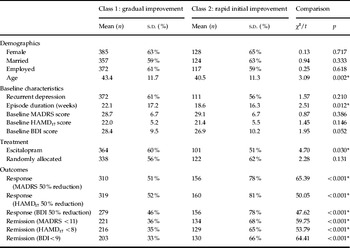
Characteristics of subjects following each latent trajectory of the best-fitting two-class two-piece model are described in Table 1. Individuals following the rapid improvement trajectory class were on average younger and had a shorter duration of the current episode than individuals following the gradual improvement trajectory. The subjects following the two distinct trajectories did not differ on any measure of depression severity at baseline, sex composition, number of previous episodes, marital status, occupational status or number of children.
Characteristics of subjects following the two latent trajectories

s.d., Standard deviation; MADRS, Montgomery–Åsberg Depression Rating Scale; HAMD17, 17-item Hamilton Depression Rating Scale; BDI, Beck Depression Inventory.
Demographics, baseline clinical characteristics and categorical outcomes are provided as number and percentages for categorical and means and standard deviations for continuous variables. Class membership is based on the most likely class.
* Indicates significant differences at 5% level.
Relationships between alternative categorical outcomes
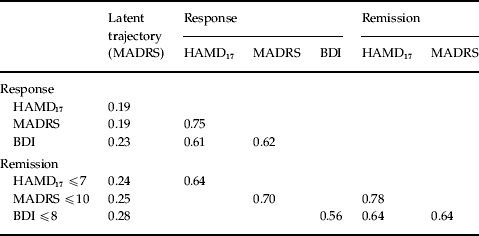
To find out whether GMM provides outcomes distinct from conventional response and remission, the agreement between the most likely latent trajectory class in the final two-class model and response/remission outcomes was quantified with the κ coefficient of agreement. There was high agreement in ‘response’ defined as 50% reduction on HAMD17, MADRS or BDI (κ=0.61–0.75, Table 2). There was equally good agreement between the three definitions of ‘remission’ by cut-off scores on HAMD17, MADRS or BDI (κ=0.64–0.78, Table 2) and between remission and response defined on the same scale (κ=0.56–0.70, Table 2). There was only a weak relationship between latent trajectory membership and conventional end-point-based categorical outcomes (κ=0.19 to 0.28, Table 2). As all coefficients of agreement were significantly different from zero (all p<0.001) and were established with high precision [all standard errors (s.e.) between 0.03 and 0.04], only the estimates of κ are given in Table 2. The percentages of subjects in each trajectory class reaching response and remission are given in Table 1.
Agreement between various categorical definitions of outcome

MADRS, Montgomery–Åsberg Depression Rating Scale; HAMD17, 17-item Hamilton Depression Rating Scale; BDI, Beck Depression Inventory.
Numbers in this table correspond to the Cohen's coefficient of agreement κ. As all coefficients of agreement were significantly different from zero (all p<0.001) and were established with high precision (all standard errors between 0.03 and 0.04), only the estimates of κ are given.
Latent trajectories, response and remission in efficacy comparisons of antidepressants
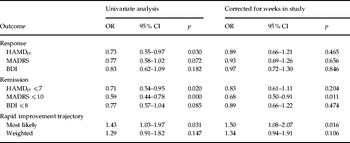
Results of logistic regressions with either latent trajectories or response/remission as dependent variables were compared to establish whether the different outcomes agree in efficacy comparisons between the two antidepressant drugs. Subjects treated with escitalopram were more likely to achieve remission and response as defined by the conventional end-point-based outcomes with LOCF: all odds ratios (OR) were <1 and three of the six tests achieved nominal significance with p<0.05 (Table 3). In contrast, subjects treated with nortriptyline were more likely to be in the rapidly improving trajectory than subjects treated with escitalopram. This was significant when the most likely trajectory was used, but not in the analysis weighted by posterior probability of latent class membership. Both OR were >1 and well outside the 95% confidence intervals (CI) for analyses with response and remission (Table 3). In comparison, the previously reported primary analyses of continuous outcomes have shown no difference between nortriptyline and escitalopram on any of the three scales (Uher et al. Reference Uher, Maier, Hauser, Marusic, Schmael, Mors, Henigsberg, Souery, Placentino, Rietschel, Zobel, Dmitrzak-Weglarz, Petrovic, Jorgensen, Kalember, Govannini, Barreto, Elkin, Landau, Farmer, Aitchison and McGuffin2009b).
Drug comparisons on traditional categorical outcomes and latent trajectories

OR, odds ratio; CI, confidence interval; HAMD17, 17-item Hamilton Depression Rating Scale; MADRS, Montgomery–Åsberg Depression Rating Scale; BDI, Beck Depression Inventory.
Odds ratios are for positive outcome on nortriptyline as compared with escitalopram so OR <1 indicate an advantage of escitalopram and OR >1 indicate an advantage of nortriptyline. The left part of the table shows results for univariate analysis with no covariates. To explore the extend of bias from missing data, the right part of the table shows the effect of drug after correcting for the number of weeks in the study.
As there was a major discrepancy of drug effects with response/remission and latent trajectory outcomes, we tested potential sources of bias and confounders that may have caused this discrepancy. First, to test whether non-random allocation of a proportion of subjects to study medication played a role, we performed a series of sensitivity analyses restricted to the randomly allocated subjects. These showed results similar to the analysis of the whole sample with estimates within 1 s.e. of the whole-sample analyses (see on-line Technical Appendix for details). As expected, the standard errors were larger and the drug differences in latent class membership were no longer significant in the analysis restricted to randomly allocated subjects. Second, to test whether the analyses were confounded by drop-out, we entered the number of weeks in the study as a covariate (this was 12 for subjects who completed the 12 weeks and less for those who dropped out or switched medication before week 12). Controlling for time in the study markedly reduced drug effects in the analyses with response/remission, but did not affect the results of the latent class analyses (Table 3). Inclusion of age and episode duration as covariates did not affect the drug difference when latent trajectory membership was the outcome (OR 1.47, 95% CI 1.06–2.05, p=0.022 correcting for both).
Comparison of latent trajectories and response as outcomes in pharmacogenetic analyses
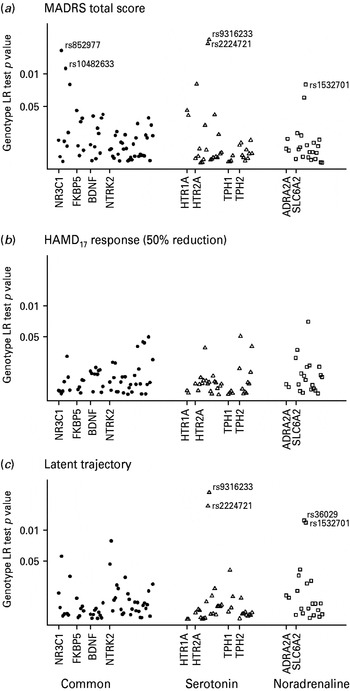
As ‘response’, defined as a 50% improvement on the last observed HAMD17 score, has become the most common outcome in pharmacogenetic studies, we evaluate latent trajectories as an alternative in the GENDEP candidate gene pharmacogenetic analyses. The GENDEP primary outcome (repeated measures of continuous MADRS score) and the latent trajectory membership produced closely similar sets of results, supporting the general hypothesis of specific gene-response association according to the antidepressant mode of action (Fig. 2 a, c). This stood in contrast to few positive findings in the analyses with an end-point response (50% reduction in HAMD17 or MADRS) as an outcome (Fig. 2 b). The false discovery rate (FDR) q values were used to quantify the joint probability of the multiple positive findings being false (FDR q value is the likelihood of a finding being false after taking into account all tests performed). For latent trajectory class, the four strongest associations had q values between 0.15 and 0.19 and the posterior likelihood of all four of these being false was 0.0007. This was similar to the continuous outcome mixed model analyses, where the three strongest associations had q values 0.11 and a joint posterior probability of being false of 0.0012. In contrast, the lowest q value in the set of analyses with HAMD17 response as outcome was 0.996, indicating a distribution of findings consistent with chance level.
Pharmacogenetic analyses with continuous and categorical outcomes. The p values of pharmacogenetic analyses of markers in serotonergic, noradrenergic and common pathway genes predicting outcome measured as (a) Montgomery–Åsberg Depression Rating Scale (MADRS) total score over repeated measurements (linear mixed model analysis); (b) response defined as 50% reduction in the 17-item Hamilton Depression Rating Scale (HAMD17) score at end point with the last observation carried forward (logistic regression); (c) most likely latent trajectory estimated from the final piecewise growth mixture model (rapid improvement versus gradual improvement trajectory as shown in Fig. 1). •, Combined; ▵, escitalopram; □, nortriptyline.

Discussion
The exploration of the GENDEP sample shows important heterogeneity in the temporal patterns of change over the weeks following initiation of an antidepressant, which has only a weak relationship to traditional measures of response or remission, but captures drug-specific effects in efficacy comparison and pharmacogenetic analyses.
In most clinical trials to date, depression severity has been measured repeatedly over the course of a study, but only the last measurement has been used in primary outcome analyses. The rich information on the course of change in depressive symptoms that is commonly discarded in favour of end-point measures may be crucial for understanding how and for whom antidepressants work (Bech et al. Reference Bech, Allerup, Reisby and Gram1984; Stassen et al. Reference Stassen, Angst, Hell, Scharfetter and Szegedi2007; Muthén et al. Reference Muthén, Brown, Leuchter, Hunter and Shrout2008; Szegedi et al. Reference Szegedi, Jansen, Willigenburg, van der, Stassen and Thase2009). An inspection of individual trajectories of change shows that most variability occurs in the first 3 weeks of the study. This is in agreement with other clinical studies of antidepressants (Szegedi et al. Reference Szegedi, Jansen, Willigenburg, van der, Stassen and Thase2009). Subsequently, information on early changes in depressive symptoms has crucially contributed to the categorization of individuals into distinct latent trajectories of change in the present study and other similar investigations (Beunckens et al. Reference Beunckens, Molenberghs, Verbeke and Mallinckrodt2008; Muthén et al. Reference Muthén, Brown, Leuchter, Hunter and Shrout2008). Separating a group of individuals with a dramatic initial improvement significantly enhanced the explanatory ability of the statistical model, compared with a standard mixed linear regression, indicating presence of naturally occurring heterogeneity in the temporal patterns of response to antidepressants.
Marked initial improvement was traditionally considered a hallmark of placebo response (Quitkin et al. Reference Quitkin, Rabkin, Ross and Stewart1984). However, rigorous analyses of placebo-controlled trials have dispelled the myth of a necessary delay in antidepressant effect (Taylor et al. Reference Taylor, Freemantle, Geddes and Bhagwagar2006) and have shown that early improvement predicts stable long-term improvement (Szegedi et al. Reference Szegedi, Muller, Anghelescu, Klawe, Kohnen and Benkert2003; Papakostas et al. Reference Papakostas, Crawford, Scalia and Fava2007; Szegedi et al. Reference Szegedi, Jansen, Willigenburg, van der, Stassen and Thase2009). Our analysis supports this view by showing that initial gains in individuals following the rapid improvement trajectory are maintained after 12 weeks of treatment.
While the measurement scales used in antidepressant trials are continuous, the outcomes are commonly discussed in terms of response versus non-response or remission versus non-remission, giving an impression that clinical effect of antidepressants is a yes-or-no phenomenon. Inspection of individual trajectories of change clearly shows that response to antidepressants is a matter of degree. Even within the gradual improvement trajectory, followed by the majority of subjects, there is a wide variation of depression severity, encompassing MADRS scores from 0 to 30 at the end of the 12-weeks of treatment. There is no obvious point of rarity that would suggest a bimodal distribution. Subsequently, any classification into categories will be imperfect. In the present investigation, the uncertainty of classification into trajectories is quantified by entropy of 0.71, corresponding to a moderate level of uncertainty. Even with this uncertainty, the reduced outcome measure of most likely trajectory membership has proven surprisingly useful, giving a set of results very similar to the linear mixed model analyses of repeated measurements in the pharmacogenetic analyses (Uher et al. Reference Uher, Huezo-Diaz, Perroud, Smith, Rietschel, Mors, Hauser, Maier, Kozel, Henigsberg, Barreto, Placentino, Dernovsek, Schulze, Kalember, Zobel, Czerski, Larsen, Souery, Govannini, Gray, Lewis, Farmer, Aitchison, McGuffin and Craig2009a). This amount of data reduction with little loss of efficiency is attractive for analyses that have to be repeated a large number of times, such as in genome-wide pharmacogenetic association studies. While analysis of the temporal course of symptom change for pharmacogenetic studies was proposed 10 years ago (Rietschel et al. Reference Rietschel, Kennedy, Macciardi and Meltzer1999), the present investigation is the first application of GMM in pharmacogenetics. A drug-specific pattern of pharmacogenetic associations and a good agreement with mixed linear model analyses in GENDEP provide preliminary evidence indicating that GMM-based categorization may be useful for pharmacogenetic investigations. However, a more definite test will require an assessment of replicability of pharmacogenetic associations across independent samples.
There was a relatively poor correspondence between latent trajectory membership and conventional end-point-based outcomes of response or remission. Intriguingly, efficacy comparisons between the two antidepressants give opposite results depending on which categorical outcome measure is used. Traditional end-point outcomes favour escitalopram. However, entering the length of time in study as a covariate nearly eliminates these differences, confirming that end-point measures with LOCF are biased by differential rates of drop-out, generally favouring drugs with less discontinuation, as has been shown elsewhere (Joyce et al. Reference Joyce, Mulder, Luty, Sullivan, McKenzie, Abbott and Stevens2002; Lane, Reference Lane2008). In contrast, analysis of latent trajectory membership favours nortriptyline, as nortriptyline-treated subjects were more likely to follow the rapid improvement trajectory. This relationship diminishes when the likelihood of trajectory membership is taken into account as a probability weight in the analyses. In comparison, the repeated measurement analysis of this dataset with linear mixed effect models has shown no between-drug difference in MADRS score change (Uher et al. Reference Uher, Maier, Hauser, Marusic, Schmael, Mors, Henigsberg, Souery, Placentino, Rietschel, Zobel, Dmitrzak-Weglarz, Petrovic, Jorgensen, Kalember, Govannini, Barreto, Elkin, Landau, Farmer, Aitchison and McGuffin2009b). These discrepancies highlight the somewhat arbitrary nature of analyses with categorical outcomes and point to the need for performing sensitivity analyses to assess the impact of drop-out and classification certainty. Unfortunately, multifaceted exploration of drug effects is discouraged in the current climate with a focus on a single ‘primary’ outcome measure, which is qualified by advance registration rather than evidence (Vandenbroucke, Reference Vandenbroucke2008).
The thresholds for response and remissions have been repeatedly discussed and have often been adjusted to give approximately equal numbers of positive and negative outcomes (Montgomery, Reference Montgomery1994) even if it meant different rules for different disorders (Leucht et al. Reference Leucht, Heres, Hamann and Kane2008). Some authors have even suggested more liberal cut-offs for more resistant forms of the same disorder (Montgomery, Reference Montgomery1994; Bandelow et al. Reference Bandelow, Baldwin, Dolberg, Andersen and Stein2006). On the other hand, empirical investigation suggested that a threshold for response higher than 50% improvement may be more valid (Mulder et al. Reference Mulder, Joyce and Frampton2003). In the present set of analyses, all two-class models distinguished a slow improving majority from a minority group with a more marked improvement. This indicates that there is heterogeneity among individuals commonly grouped under the umbrella of ‘major depression’, with only a smaller subgroup showing a substantial clinical response to antidepressants. Such heterogeneity may be linked to aetiologically distinct types of depression (Uher, Reference Uher2008) and may be responsible for the disappointingly low average efficacy of antidepressants in recent meta analyses (Parker, Reference Parker2009). This is likely to be compounded by analyses focusing on the end point, which is relatively remote from the initiation of the antidepressant and discriminates less well between treatments than initial measurements.
From the present study and other recent investigations (Beunckens et al. Reference Beunckens, Molenberghs, Verbeke and Mallinckrodt2008; Muthén et al. Reference Muthén, Brown, Leuchter, Hunter and Shrout2008), it can be concluded that growth mixture models have a number of advantages over end-point outcome measures. These include sensitivity to the pattern of change over time, better agreement with repeated measure analyses and robustness in the presence of missing data. While two latent trajectories appear to improve the description of change in depression severity during antidepressant treatment in GENDEP, the classification of subjects into trajectories is not clear cut and the generalizability of these findings is yet to be established. Application of GMM to other large datasets including placebo-controlled trials will be needed to establish which aspects of the present results are replicable across studies. We hope that combined evidence from the explorations of the time course of change in multiple clinical trials will contribute to the design of more effective a priori outcome measures for randomized controlled trials and pharmacogenetic investigations. Temporal patterns of change during different treatments, including psychological therapies and non-monoaminergic antidepressants will need to be explored to advance our understanding of how treatments for depression work and whether there are multiple pathways to recovery.
Acknowledgements
The GENDEP study was funded by a European Commission Framework 6 grant, EC Contract Ref.: LSHB-CT-2003–503428. Lundbeck provided both nortriptyline and escitalopram free of charge. Biomedical Research Centre for Mental Health at the Institute of Psychiatry, King's College London and South London and Maudsley NHS Foundation Trust (funded by the National Institute for Health Research, Department of Health, UK) and GlaxoSmithKline contributed by funding add-on projects at the London centre. The funders had no role in the design and conduct of the study, in data collection, analysis, interpretation or writing the report.
Note
Supplementary material accompanies this paper on the journal's website (http://journals.cambridge.org/psm).
Declaration of interest
Henigsberg has participated in clinical trials sponsored by pharmaceutical companies including GlaxoSmithKline and Lundbeck. Farmer, McGuffin and Aitchison have received consultancy fees and honoraria for participating in expert panels from pharmaceutical companies including Lundbeck and GlaxoSmithKline.