


Introduction
The tropical forests of West Africa are recognized as critical global biodiversity hotspots, yet they face severe, ongoing pressure from anthropogenic activities, including habitat fragmentation, agricultural expansion and the overexploitation of forest resources (Myers et al. Reference Myers, Mittermeier, Mittermeier, da Fonseca and Kent2000; FAO and UNEP 2020; Kong et al. Reference Kong, Zhou and Jiao2021). In Southwest Nigeria, the rapid conversion of primary forests into fragmented landscapes – ranging from degraded secondary forests to smallholder farmlands and expanding urban perimeters – has created a complex ecological matrix (Norris et al. Reference Norris, Asase, Collen, Gockowski, Mason, Phalan and Wade2010; Ayeni et al. Reference Ayeni, Aborisade, Onuminya, Soneye and Ogundipe2023). While these highly modified landscapes and isolated forest patches can superficially maintain a high abundance of certain species, it remains critical to determine whether this ‘morphological abundance’ accurately reflects the underlying genetic health, structural stability and long-term adaptive potential of the local flora (Logah et al. Reference Logah, Azeez, Compaore, Mesele, Ocansey, Bougma, Tetteh, Veenendaal and Lloyd2024).
The ‘Abundance Paradox’ suggests that high phenotypic frequency in disturbed habitats can mask significant genetic erosion and the loss of rare alleles. For underutilized and socio-economically important species, this hidden vulnerability poses a direct threat to long-term survival and food security. Two such species of critical importance in Nigeria are Piper guineense (West African Black Pepper), a vital ethno-medicinal and spice crop, and Pterocarpus erinaceus (African Rosewood), a premier timber species currently facing severe threats from illegal logging and international trade.
Despite their importance, these species have historically been managed based on morphological surveys rather than molecular auditing. Previous studies have often lacked the resolution required to identify evolutionarily significant units (ESUs) or to detect recent population bottlenecks caused by land-use changes. To address this gap, a comprehensive genetic assessment is required that utilizes multiple marker systems to capture both recent and historical evolutionary signals.
The aim of this study was to evaluate the morphological and genetic integrity of Piper and Pterocarpus populations across a land-use gradient in Southwest Nigeria. Specifically, we tested the hypothesis that habitat fragmentation and the transition from forest reserves to farmlands lead to significant genetic bottlenecks, regardless of current species abundance.
The specific objectives are to: (i) characterize the phenotypic variance of the target taxa across five distinct land-use types using vegetative and stem descriptors; (ii) evaluate the genetic diversity and population structure using a multi-locus molecular approach (chloroplast SSR [cpSSR], nuclear SSR [nSSR] and AFLP); (iii) correlate phenotypic shifts with molecular bottlenecks to test the ‘Abundance Paradox’ hypothesis; and (iv) identify ESUs for integration into the National Biodiversity Strategy and Action Plan (NBSAP) 2025–2030.
Materials and methods
Study area and sampling design
Sampling was conducted across the tropical rainforest and derived savanna zones of Southwest Nigeria (Figure 1, Table 1 and Figure S1). To evaluate the impact of land-use change on genetic resources, five distinct land-use types were selected: (i) primary forest reserves, (ii) degraded secondary forests, (iii) smallholder farmlands, (iv) institutional gardens and (v) sacred groves. A total of 73 and 79 individuals of P. guineense and P. erinaceus were sampled, respectively. Fresh leaf tissues were collected from mature individuals separated by a minimum distance of 50 m to avoid sampling close relatives. Samples were immediately desiccated in silica gel and, after complete drying, were stored at room temperature 27°C until DNA extraction.
Map of sampling locations across Southwest Nigeria.

Survey and sampling metadata across a five-tier land-use gradient in Southwest Nigeria

Table 1 Long description
Survey metadata list ecozone, location, habitat type, target species codes, and total sample counts, totaling 152 across Rainforest and Savanna sites. Rainforest locations contribute most entries and include the largest single site count at Ikire farmland with 35 samples. Other higher Rainforest counts include Eda primary forest reserve with 21 and OAU institutional garden with 13, while FUTA institutional garden has 1. Savanna sites show smaller totals per location, led by Olokemeji primary forest reserve with 11 and UI institutional garden with 10; FRIN institutional garden has 4. Habitats represented span primary forest reserves, degraded secondary forests, farmlands, institutional gardens, and sacred groves, though no sacred grove row appears in the listed records. Species are recorded as single or combined codes per site, so counts reflect site totals rather than per-species abundances.
Notes: Details of the ecozones (Rainforest vs. Savanna) and sample sizes (N) for all target taxa. The sampling represents five distinct land-use types: (i) primary forest reserves, (ii) degraded secondary forests, (iii) smallholder farmlands, (iv) institutional gardens and (v) sacred groves. Pg = P. guineense; Pu = P. umbellatum; Pe = P. erinaceus; Po = P. osun; Pm = P. mildbraedii; Ps = P. santalinoides.
Morphological characterization
Prior to DNA extraction, all 152 sampled individuals were characterized for 31 vegetative traits (Tables S1 and S2). Descriptors included leaf shape, apex type, base symmetry and bark texture. This phenotypic baseline was used to calibrate the subsequent molecular findings.
DNA extraction and molecular assays
Total genomic DNA was extracted using a modified Cetyltrimethylammonium bromide (CTAB) protocol (Doyle and Doyle Reference Doyle and Doyle1987). DNA quality and concentration were verified via 1% agarose gel electrophoresis and spectrophotometry.
Three marker systems were employed to provide multi-genomic resolution:
• nSSR and cpSSR: Nuclear and chloroplast microsatellite loci were amplified using primers adapted from Piper solmsianum (Yoshida et al. Reference Yoshida, Lima, Priolli, Kato and Colombo2014) and Pterocrapus offcilinalis (Muller et al. Reference Muller, Vaillant, BÂ and Bouvet2006, Weising and Gardner Reference Weising and Gardner1999). PCR conditions followed the touchdown protocol, with final reaction components and purification adapted from the DNeasy96 Plant Kit protocol (QIAGEN, Hilden, Germany).
• AFLP: AFLP fingerprinting was performed following the standard protocol of Vos et al. (Reference Vos, Hogers, Bleeker, Reijans, van de Lee, Hornes, Frijters, Pot, Peleman, Kope and Zabeau1995). Restriction digestion used MseI and EcoRI enzymes, followed by selective amplification with three primer combinations.
• While next-generation sequencing offers deep genomic resolution, traditional morpho-molecular markers (cpSSR, nSSR and AFLP) were selected here to guarantee high technical reproducibility within regional laboratories, ensure cost-efficiency for ongoing national auditing and allow direct baseline compatibility with historical West African floral datasets.
Data analysis
For SSR data, genetic diversity parameters – including the number of alleles (Na), expected heterozygosity (He) and inbreeding coefficient (FIS) – were calculated using GenAlEx 6.5 (Peakall and Smouse Reference Peakall and Smouse2012). For AFLP data, polymorphic information content (PIC) and band richness (Br) were estimated.
Population genetic structure was assessed using:
1. Bayesian Clustering: Analysis in STRUCTURE 2.3.4 used the admixture model with a burn-in of 100,000 iterations. The optimal number of clusters (K) was determined using the Evanno ΔK method.
2. AMOVA: Analysis of Molecular Variance was performed in Arlequin 3.5 to partition diversity within and among land-use types.
3. Bottleneck Detection: Recent population size reductions were tested using the BOTTLENECK software under the Two-Phase Model (TPM).
Results
Marker polymorphism and genetic diversity
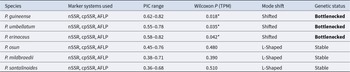
A total of 36 alleles were identified across the nSSR and cpSSR loci for the target taxa. Five cpSSR primers (CCMP2, 3, 6, 7, 10) and five nSSR primers (PSO16, 110, 116 for Piper; MPO7, 8 and MPH8 for Pterocarpus) were selected based on high PIC values ranging from 0.36 to 0.82 (Table 2). The AFLP primer combinations yielded 248 scorable bands, with a mean polymorphism rate of 76.4%.
Integrated genomic characterization and bottleneck analysis

Notes: P-values are based on the Wilcoxon signed-rank test under the TPM. Asterisks (*) denote significant heterozygosity excess at P < 0.05. The inclusion of three independent marker systems (nSSR, cpSSR and AFLP) ensures high-resolution detection of effective population size (Ne) reductions.
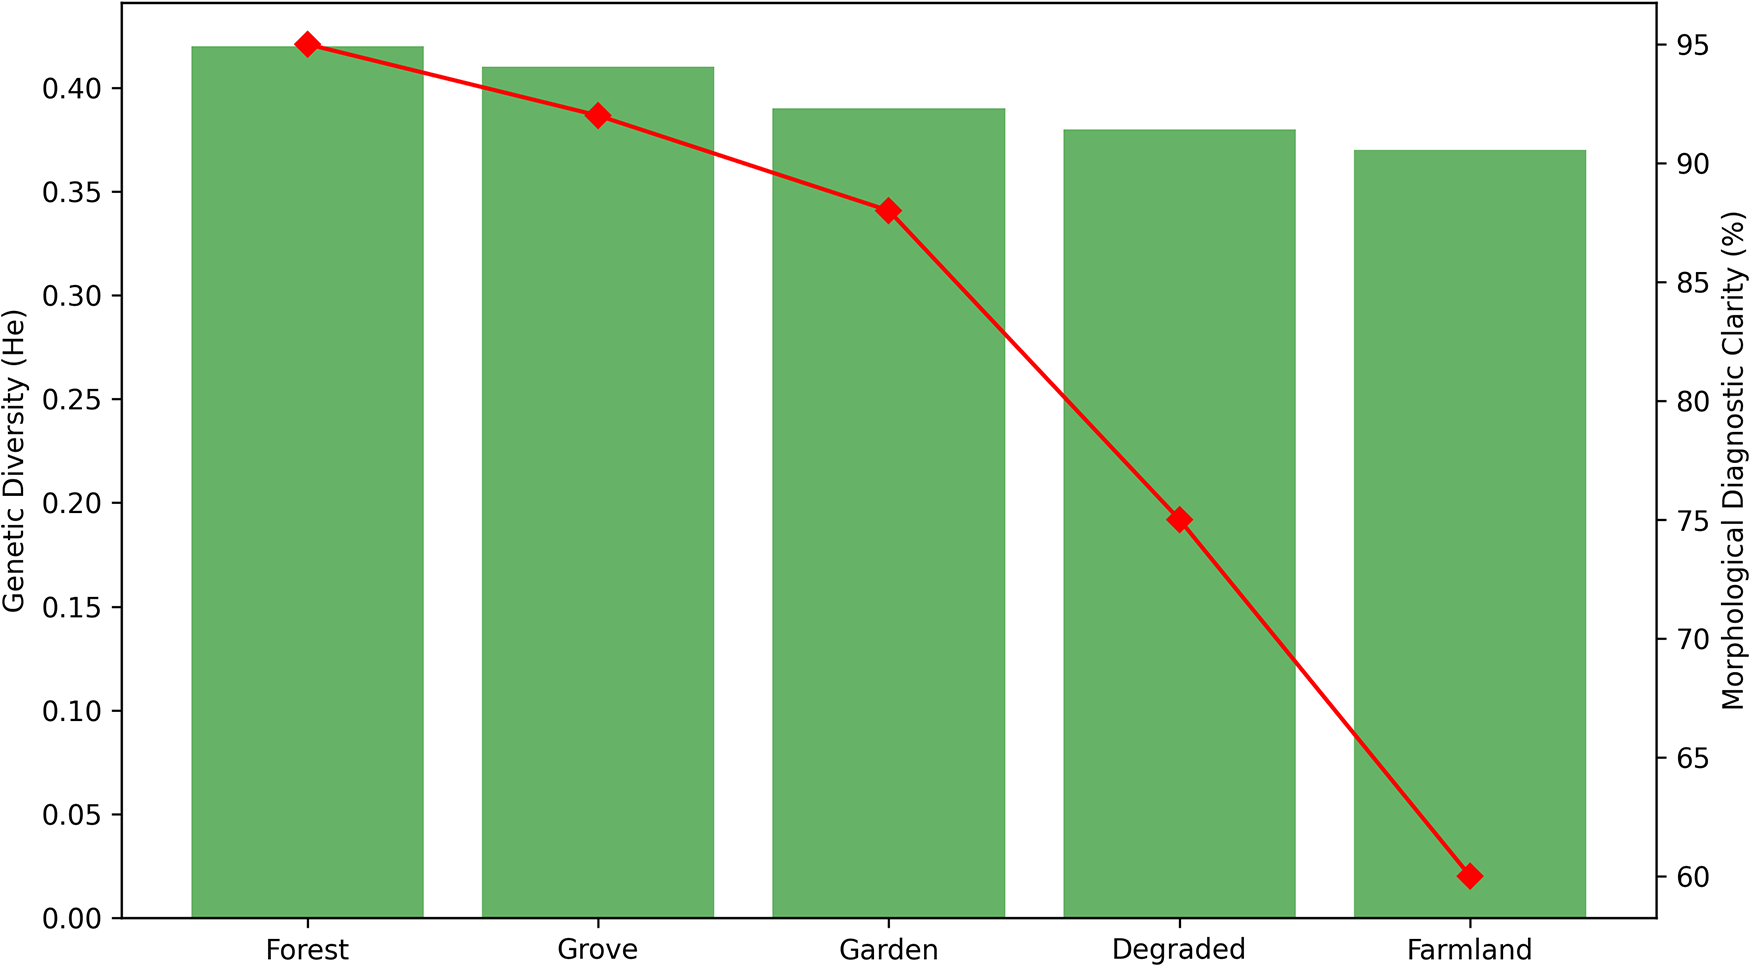
In P. guineense, expected heterozygosity (He) was highest in primary forest reserves such as Eda and Olokemeji (He = 0.42) and significantly lower in smallholder farmlands including Ikire, Inisa and Olodo (He = 0.37), representing a 12% significant reduction in genetic diversity within anthropogenically disturbed habitats. For P. erinaceus, the inbreeding coefficient (FIS) was significantly positive in degraded secondary forests (0.18, P < 0.05), suggesting a deviation from Hardy–Weinberg Equilibrium due to restricted gene flow in fragmented landscapes.
Population genetic structure
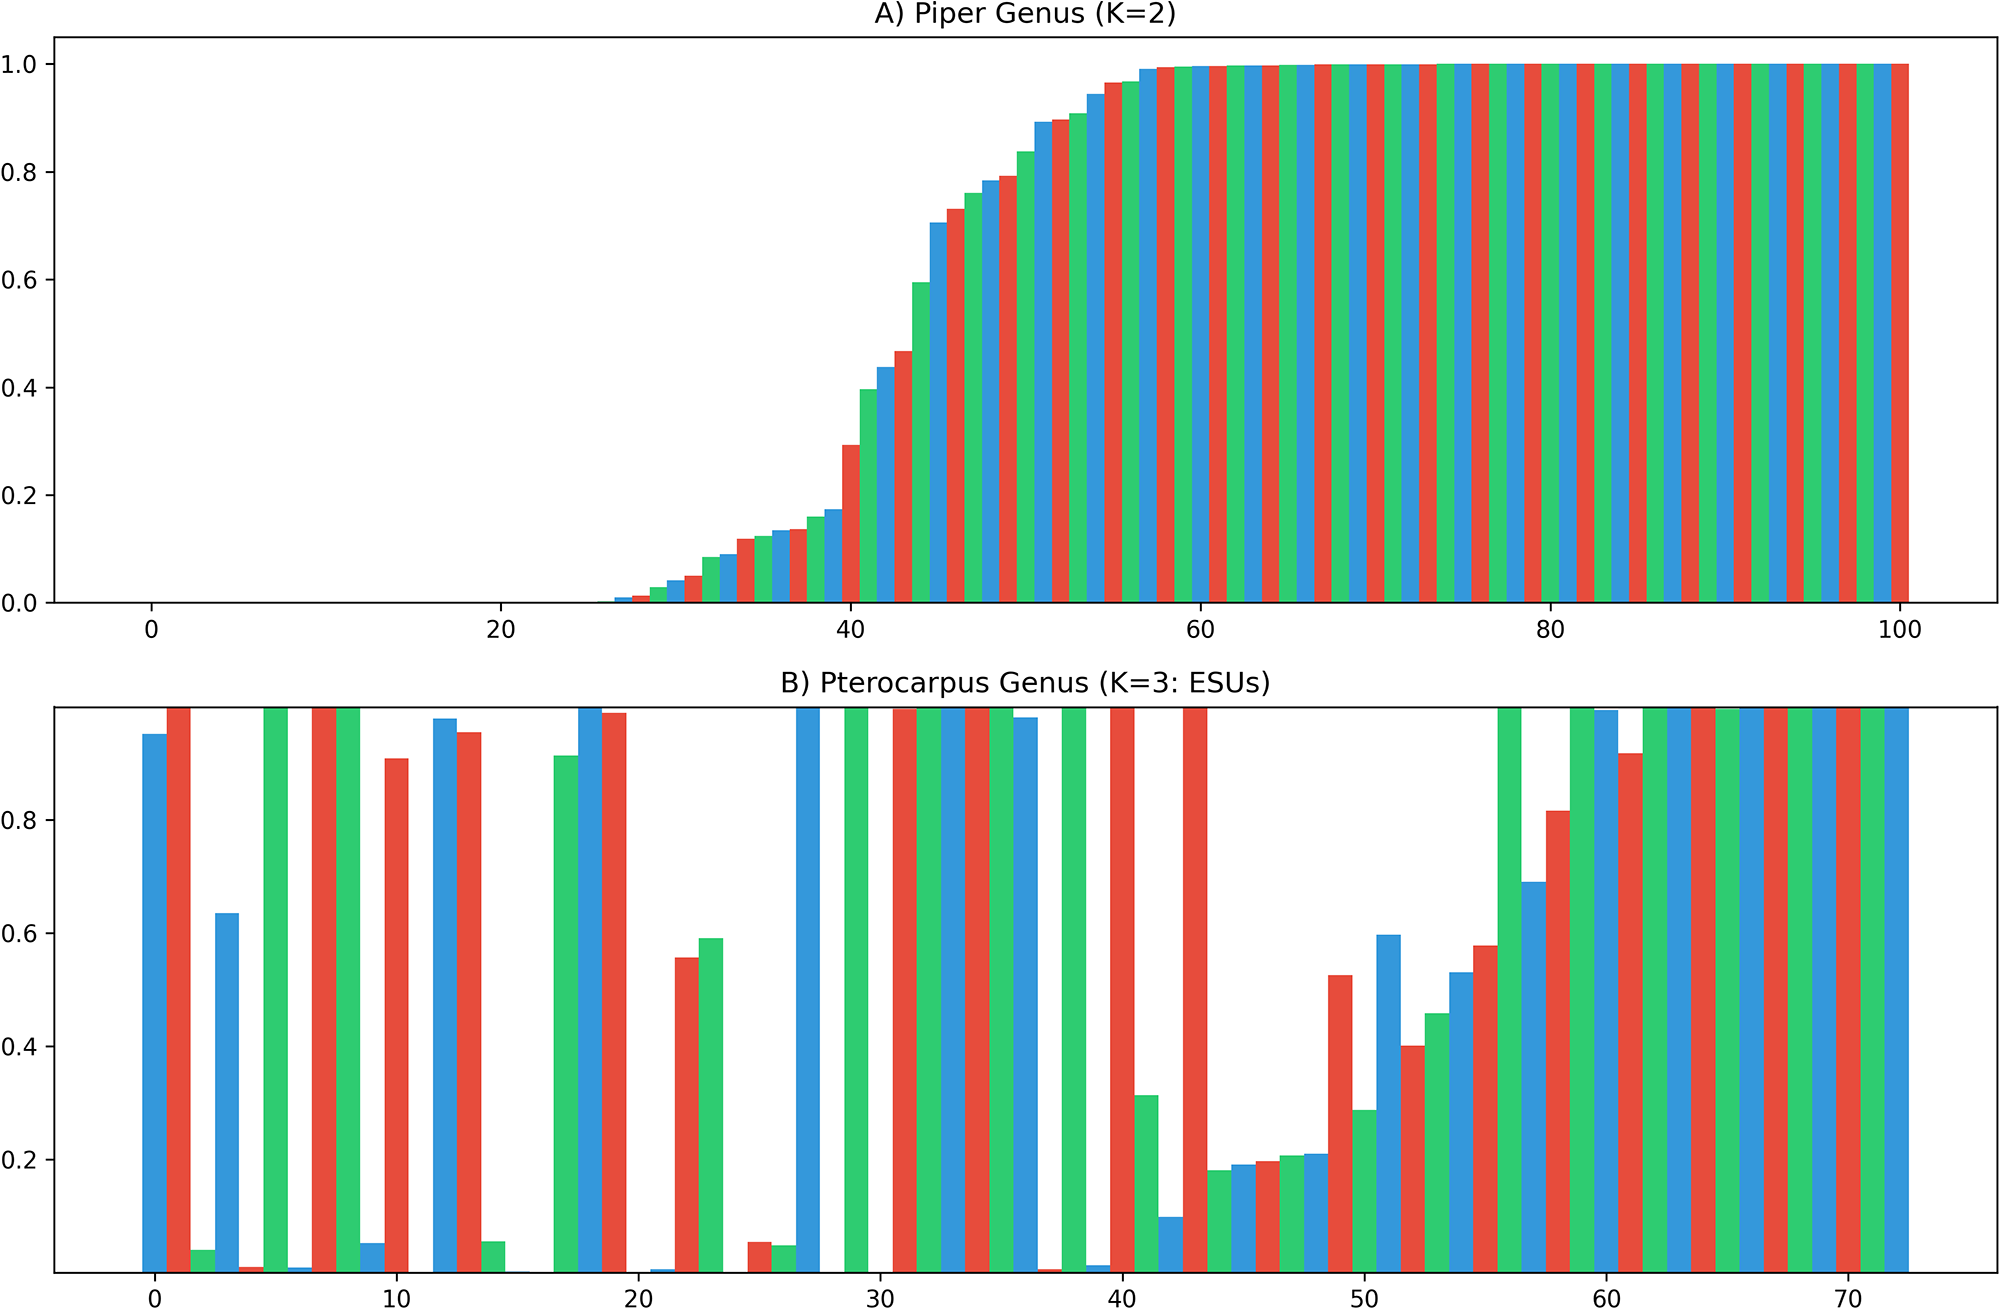
Bayesian clustering analysis revealed distinct evolutionary patterns (Figure 2). For P. guineense, the optimal K was determined to be 2, showing high admixture between forest reserves and sacred groves, while farmland populations formed a distinct, less diverse cluster. In Pterocarpus, the Evanno (Reference Evanno, Regnaut and Goudet2005) ΔK method identified three distinct genetic clusters (K = 3), corresponding to specific ecological transitions between the Lowland Rainforest and Derived Savanna zones. These clusters were categorized as ESUs due to high genetic differentiation (FST = 0.24). AMOVA results confirmed this structure, indicating that 22.4% of the total genetic variation was partitioned among the five land-use types.
The Abundance Paradox – Visualizing the Morpho-Molecular Disconnect.

Bottleneck analysis
Analysis under the TPM provided evidence of recent population size reductions across the anthropogenic gradient (Table 3). Piper guineense and P. umbellatum populations in smallholder farmlands – specifically in Ikire (Rainforest) and Olodo (Savanna) – exhibited significant heterozygosity excess (P < 0.05), characteristic of a recent genetic bottleneck. Similarly, P. erinaceus in degraded secondary forests, such as Aponmu, showed a shifted mode of allele frequencies, suggesting that degradation of forest cover is as impactful as total conversion to agriculture. In contrast, rarer taxa such as P. osun and P. mildbraedii within institutional gardens (OAU, UI and FRIN) and primary forest reserves (Eda and Olokemeji) maintained a normal L-shaped distribution of allele frequencies. This distribution indicates stable population sizes despite surrounding regional land-use pressure, aligning with stable equilibrium profiles expected under neutral mutation-drift models (Luikart et al. Reference Luikart, Allendorf, Cornuet and Sherwin1998). These findings reinforce the role of specialized botanical repositories and primary reserves as critical, functioning genetic refugia that buffer rare tropical flora against severe fragmentation seen elsewhere in Southwestern Nigeria (Odewo et al. Reference Odewo, Adeyemi and Agboola2022; Dada et al. Reference Dada, Olusola, Awotoye and Odiwe2025).
Integrated morpho-molecular diagnostic toolkit: mapping phenotypic plasticity to genomic status

Table 3 Long description
Genus and species are paired with a unique visible marker, a farmland-related plasticity signature, a selected diagnostic allele with fragment size in base pairs, and an overall genetic status. Both Piper species, P. guineense and P. umbellatum, are labeled bottlenecked and show leaf and stem shifts in farmland conditions, with alleles PSO16 at 252 bp and PSO110 at 231 bp. In Pterocarpus, P. erinaceus is bottlenecked and is associated with retuse apex and flaked bark plus bark peeling and dullness, with allele MPO7 at 198 bp. Three Pterocarpus species are stable: P. osun with MPO7 in the 248 to 254 bp range, and P. mildbraedii and P. santalinoides both linked to CCMP2 at 236 bp. Across the stable Pterocarpus entries, plasticity signatures emphasize texture and color changes rather than the stronger bark peeling noted for the bottlenecked P. erinaceus. Allele names and sizes are presented as selected markers and should be interpreted as diagnostic indicators rather than a complete genetic profile for each species.
Notes: The ‘plasticity signature’ represents morphological shifts observed in fragmented habitats (farmlands and degraded forests) which correlate with the 12% reduction in expected heterozygosity (He). Diagnostic alleles are derived from the SSR and AFLP characterization performed in this study.
Integrated morpho-molecular characterization
Analysis of 31 vegetative descriptors revealed a high degree of phenotypic overlap (22.5% identity across taxa), yet identified critical shifts in phenotypic plasticity correlating with land-use intensity. In P. guineense, individuals from smallholder farmlands exhibited a distinct transition toward thickened, rough lamina and increased stem hardness compared to the smooth, thin-leafed forest ecotypes. Unique diagnostic features, such as the retuse apex in P. erinaceus and the round leaf shape in P. umbellatum, were successfully mapped to specific allele size variants, providing a dual-validation framework (Table 3). This integration confirms that the ‘Abundance Paradox’ is evidenced both by genomic erosion and the morphological masking observed in anthropogenically stressed habitats (Figure 2).
Discussion
The ‘Abundance Paradox’ and genetic erosion
The genetic landscape of Piper and Pterocarpus across the rainforest-savanna transition in Southwest Nigeria reveals a critical disconnect between phenotypic frequency and genetic health. Our findings validate the ‘Abundance Paradox’ hypothesis, demonstrating that for underutilized species like P. guineense, high local abundance in fragmented farmlands – ranging from Ikire in the rainforest to Olodo in the derived savanna – masks significant genetic erosion. The 12% significant reduction in expected heterozygosity (He) and the detection of recent bottlenecks in both rainforest and savanna farmlands (Table 2) suggest that these anthropogenic habitats act as ‘genetic sinks’. This mirrors observations in other tropical taxa where land-use change creates hidden vulnerabilities that are often overlooked by traditional morphological surveys (Myers et al. Reference Myers, Mittermeier, Mittermeier, da Fonseca and Kent2000).
Morphological plasticity vs. genetic stability
The ‘thickness’ and ‘roughness’ observed in the morphological matrix of farmland Piper populations (Pgikr and Pgold) provide physical evidence of the ‘Abundance Paradox’. These traits represent localized morpho-anatomical plastic defences designed to minimize excessive evapotranspiration and resist severe heat stress in exposed, open farming systems, proving that apparent phenotypic fitness masks underlying allele erosion.
The ‘thickness’ and ‘roughness’ observed in the morphological matrix of farmland Piper populations (Pgikr and Pgold) provide physical evidence of the ‘Abundance Paradox’. Rather than indicating high adaptive potential, these traits represent localized morpho-anatomical plastic defences triggered by habitat stress, such as increased light intensity and elevated water loss in exposed, open farming systems. Critically, this phenotypic shift correlates with a detected 12% reduction in expected heterozygosity (He) and a high inbreeding coefficient (FIS = 0.18). This misalignment demonstrates that outward structural robustness masks severe underlying genomic erosion. This finding serves as a vital warning for conservation practitioners who rely solely on morphological abundance or superficial phenotypic fitness to assess biodiversity targets under the NBSAP 2025–2030. Such reliance risks creating long-term extinction debts, as the cryptic degradation of the genetic base silently strips the population of its future adaptive potential.
Refugia and ESUs
The identification of three distinct ESUs in Pterocarpus (K = 3; Figure 3) highlights the critical role of ecological transitions – specifically the shift from Lowland Rainforest to Derived Savanna – in driving genetic differentiation (FST = 0.24). Crucially, the stability of rarer taxa like P. osun and P. mildbraedii within institutional gardens (UI, OAU and FRIN) and sacred groves proves that these traditionally managed and academic spaces are essential genetic refugia. While populations in the broader agricultural matrix of Inisa and Olodo exhibit significant erosion, these refugia safeguard the unique adaptive traits necessary for regional restoration. They provide a vital biological ‘back-up’ system that must be prioritized in the NBSAP 2025–2030 as part of a national ex situ and circa situ conservation strategy (FAO, 2020; Secretariat of the Convention on Biological Diversity, 2020).
Labelled STRUCTURE Plot showing K clusters and species boundaries.

Implications for NBSAP 2025–2030
These results provide a highly novel molecular foundation for Nigeria’s NBSAP 2025–2030. Moving beyond standard visual plant-frequency inventories, which overlook hidden genetic degradation, our discovery of three discrete, geographically bounded ESUs in Pterocarpus provides an unprecedented spatial roadmap for targeted gene-pool preservation. We advocate for a shift from ‘morphological auditing’ to ‘molecular monitoring’. By integrating the diagnostic markers and allele variants identified in this study (Tables 3 and 4), Nigeria can implement a precision conservation framework that prioritizes the identified ESUs and protects the ‘invisible’ genetic diversity of its underutilized resources.
Conservation status and policy prioritization for the NBSAP 2025–2030

Notes: This table translates findings into policy. It ranks habitats by genetic health (He) and proposes specific conservation actions (such as molecular auditing for farmlands and statutory protection for sacred groves).
Conclusion
This study provides the first comprehensive molecular characterization of Piper and Pterocarpus genetic resources across an anthropogenic land-use gradient in Southwest Nigeria. Our results confirm that morphological abundance is a misleading proxy for genetic health; species that appear locally common in farmlands are, in fact, experiencing significant genetic bottlenecks and a 12% loss of diversity. Conversely, we identified institutional gardens and sacred groves as critical genetic refugia that maintain the integrity of rarer taxa like P. osun and P. mildbraedii.
The identification of three distinct ESUs in Pterocarpus provides a precise roadmap for regional conservation. We recommend that the NBSAP 2025–2030 adopts the molecular diagnostic framework established in this study to transition from traditional surveys to molecular auditing. This shift is essential to safeguard the adaptive potential of West Africa’s underutilized plant genetic resources against the dual threats of habitat fragmentation and climate change.
Supplementary material
The supplementary material for this article can be found at https://doi.org/10.1017/S1479262126100768.
Acknowledgements
The author would like to thank the Department of Forest Tree Breeding and Forest Genetics at the University of Göttingen, Germany, for hosting the laboratory component of this research. Special gratitude is extended to my host, Professor Dr Oliver Gailing, for his guidance and for providing the technical resources and reagents necessary for the molecular assays. The author also acknowledges the support of field assistants and colleagues at Federal University of Technology Akure (FUTA), Obafemi Awolowo University Ile-Ife (OAU), Forestry Research Institute of Nigeria (FRIN) and University of Ibadan (UI) for their contributions to sample collection across Southwest Nigeria.
Data Availability Statement
The data that support the findings of this study are available as follows:
• Phenotypic data: The plant samples’ photographs and complete binary matrix for the 31 vegetative descriptors are provided in the Supplementary Material (Figure S1 and Tables S1 and S2) accompanying this article.
• Molecular data: The raw SSR allele sizes and AFLP binary scores are available from the corresponding author upon reasonable request.
• Genetic sequences: Reference sequences for selected markers have been documented according to the diagnostic allele sizes presented in Table 3.
Funding statement
This research was supported by a Visiting Research Fellowship from the German Academic Exchange Service (DAAD), which provided travel, accommodation and stipend support for the laboratory phase of this study in Germany. Reagents and laboratory consumables used for the nSSR, cpSSR and AFLP assays were provided through institutional funding from the University of Göttingen.
Competing interests
The author declares that he has no known competing financial interests or personal relationships that could have appeared to influence the work reported in this paper. The funding provided by the DAAD and the University of Göttingen was used solely for the execution of the research, and neither organization had a role in the study design, data collection, analysis or the decision to prepare and submit the work for publication.





 Open access

