

1. Introduction
Recently, large scale climate risks are observed with higher frequency and severity, including extreme weather events, such as heavy storms, floods, cyclones, heat waves, and droughts. These extreme weather events have also had extreme impacts in policy circles, as well as in academic research. Climate risks have been decomposed into physical and transition risks, associated with climate-related extreme weather events and their disruption and cost to economic and financial systems.Footnote 1 Carney (Reference Carney2015) phrases those risks as challenges to economic short-termism in market economies, and pointed to the threat of “stranded assets.” Central Banks (CBs) also started worrying about climate change from a risk and financial stability perspective, discussing measures, such as bank stress tests. However, challenges of inflation rate spikes driven by fossil fuel prices, and the issue of green finance for the energy transition, have come to the forefront. Academics in empirical research have also demonstrated an increasing concern with CBs’ biased asset purchases through Quantitative Easing (QE) programs (De Grauwe, Reference De Grauwe2019; Papoutsi et al. Reference Papoutsi, Piazzesi and Schneider2021, and Appendix E).
Academics, policy makers, and CBs have controversial views on those issues: Should monetary policy be market-neutral, even when markets create economic externalities? Is the decision horizon of CBs long enough, given their short and medium-run business cycle focus? Are the CBs operations becoming too complex since they are driven by multiple targets? Are issues, such as climate risks and the transition to a low carbon economy legitimizing policy objectives? Are there sufficient macro policy tools available for this new task? Can policy objectives be prioritized? Do excessively long decision delays compromise the efficacy of carbon emission reduction? Are there enough empirical and practical experiences available given that policies have side effects on other policy objectives, such as distributional issues? Overall, to what extent can CBs reverse climate risks and flatten or revert the emissions curve?
The analytical efforts of academics and researchers working with a variety of macro models can provide proper guidance on the climate risks and policies needed for a transition to a low carbon economy. As a 2023 publication of the Central Banks’ Network for Greening the Financial System (NGFS) asks: Do we have a “systematic analytical framework to properly understand what climate change and the net-zero transition mean for our economies—and the households, businesses and policymakers” (NGFS, 2023, p. 2).
There are numerous macro models trying to answer the above questions. We propose a macroeconomic Non-Linear Quadratic (NLQ) model to assess various aspects of CBs’ climate policies, and to answer to what extent they can flatten, or reverse the emissions curve. Instead of a Dynamic Stochastic General EquilibriumFootnote 2 and linearized (LQ) monetary policy models (De Groot et al. Reference De Groot, Mazelis, Motto and Ristiniemi2021), we develop a NLQ model, with AMPL algorithms and a finite horizon model structure. The NLQ model includes non-stationary variables where multiple objectives are considered and is more appropriate because CBs face many policy goals simultaneously. These multiple goals are prioritized through the application of weights for different targets in the model.
As Brunnermeier and Landau (Reference Brunnermeier and Landau2021) have argued, one main issue in this context is that CBs are focused mainly on business cycle time scales and work with stationary variables and models. Yet, some important non-stationary variables are driven by long-run forces, and are becoming a macroeconomic challenge. A typical example being carbon emission trends creating multiple vulnerabilities and risks. Therefore, non-stationary and stationary macro variables are included when climate considerations are emphasized in dynamic macro models. The need to discuss and solve models with non-stationarity where one cannot simply detrend the variables is also stressed in Cai and Judd (Reference Cai and Judd2023). They write that most intertemporal models are “defined by a set of equations, which may depend on time if, for example, population, productivity, or preferences depend on time in a manner that cannot be simplified by detrending” (p. 652 and see also p. 662).Footnote 3 In this context, see also Gruene and Pirkelmann (Reference Gruene and Pirkelmann2020).
Given these non-stationarities, there are not only modeling issues (which are addressed in the theoretical part of this paper), but also significant econometric challenges which Cai and Judd (Reference Cai and Judd2023) do not address. In the empirical part of our paper, we therefore use a mix of stationary and non-stationary variables by employing a mixed Vector Error Correction Model (VECM) that has stationary variables with mean reversion to a stationary level; and non-stationary variables with level shift after shocks.
It is also important to consider the delay effects in policy decisions and transmission mechanisms, an issue that Goellmann and Maurer (Reference Goellmann and Maurer2014) have extensively studied. In fact, it is urgent, as Aghion et al. (Reference Aghion, Boneva, Breckenfelder, Laeven, Olovsson, Popov and Rancoita2022) argue, that the model takes into account the delay costs created by policy decisions. In fact, delays can, when long enough, reverse the intended stabilizing policy decisions, see Chen et al. (Reference Chen, Semmler and Maurer2022). Another important issue is which weights decision authorities, such as CBs, should assign to their targets when facing multiple conventional macroeconomic objectives, and also climate risks. The issue of multiple target decisions and how they can be modeled is an issue studied extensively in Kaya and Maurer (Reference Kaya and Maurer2023).
The following sections present the analytical model, with its novelties and empirical and econometric implications. Technical issues, as well as practical and policy issues, and experiences of polices, are relegated to the appendices.
The paper is organized as follows. In Section 2, relevant literature for this work is discussed, while related literature is evaluated in Appendix E. Section 3 presents a finite horizon CB decision-making problem with multiple objectives. The model includes a non-stationary carbon emission trend, as a drift variable among the state equations. We also study the issue of delayed policy and transmission effects on the emission trend. In Section 4, we study econometrically the mean reversion and level effects of shocks for a mixed VECM model with stationary and non-stationary variables. Section 5 addresses an extension of how to assign proper weights to the different targets and concerns of the CBs. A Pareto front construction along the line of Kaya and Maurer (Reference Kaya and Maurer2023) is suggested. Section 6 concludes the paper. The Appendix presents some technical aspects and a summary of distinct climate actions and decisions recommended for monetary policy makers.Footnote 4
2. Some related literature
There is a long tradition in central bank studies supporting the argument that CBs should avoid climate-risk issues and focus on traditional targets, such as inflation, employment (output), and financial stability. Some authors believe the private sector should be a major driver of new energy technology, see Aghion et al. (Reference Aghion, Boneva, Breckenfelder, Laeven, Olovsson, Popov and Rancoita2022). However, recently, climate risks and the transition to a low carbon economy, including renewable energy incentives, are also increasingly viewed by some authors as a monetary policy task.
In fact, a growing body of literature defends the use of monetary and financial policies, in addition to existing fiscal policies to support climate transition (Campiglio, Reference Campiglio2016; Coeure, Reference Coeure2018). However, the policy effectiveness of CBs seems to differ depending on the tools used. In addition, market failures are emerging with a long delay, see Chen et al. (Reference Chen, Semmler and Maurer2022) The effects of these policies are not visible for a long time, and may be accelerated by tipping points (Greiner et al. Reference Greiner, Gruene, Semmler, Greiner, Gruene and Semmler2010).
Central banks are also often seen as neutral with respect to credit flows, and thus not able to target credit and financial flows towards climate mitigation and adaptation-oriented investments. However, carbon-intensive financial assets carry long-term climate-related risks that may create higher volatility, and occasional disruptions (Carney, Reference Carney2015; Semmler et al. Reference Semmler, Braga, Lichtenberger, Toure and Hayde2021). Therefore, some authors advocate that CBs should pursue proactive climate mitigation policies. Other authors argue that CBs should be market-neutral and focus on climate risks only as they affect conventional monetary policy goals, including financial instability risks, inflation, and the output gap. For an extensive discussion, see Brunnermeier and Landau (Reference Brunnermeier and Landau2021).
In practice, however, CBs are already implementing instruments to assess climate risks, such as climate stress tests, and helping to channel financial resources to green investments. In March 2021, the Bank of England explicitly announced a climate mandate—see Bailey (Reference Bailey2021)—while the European Central Bank (ECB), in February 2021, created a climate change center to better design its climate agenda—see (ECB, 2021a). These initiatives, and more, are discussed in CBs‘ international networks—such as the NGFS and the Sustainable Banking Network.
Furthermore, a large body of literature on monetary policy discusses the role of Unconventional Monetary Policy (UMP) instruments, or Quantitative Easing (QE), which has so far tended to be market-neutral, without environmental concerns (De Grauwe, Reference De Grauwe2019; Dafermos et al. Reference Dafermos, Gabor, Nikolaidi, Pawloff and van Lerven2020; Papoutsi et al. Reference Papoutsi, Piazzesi and Schneider2021). Yet, a policy orientation that pursues market-neutrality in asset purchases concentrates CBs’ portfolios mostly on fossil fuel assets, as they represent the majority of the existing assets likely to benefit capital costs of carbon-intensive investments (De Santis et al. Reference De Santis, Roos, Hettler and Tamburrini2018; Battiston and Monasterolo, Reference Battiston and Monasterolo2019). This literature also provides evidence that green bonds can hedge investors against market and oil price volatilities,Footnote 5 but the impact of CBs policy on prices has not been sufficiently studied yet.Footnote 6
Recent papers join the effort to assess green bond performance but also consider other assets—see Hilmi et al. (Reference Hilmi, Djoundourian, Shahin and Safa2021), Bremus et al. (Reference Bremus, Schuetze and Zaklan2021) and Lichtenberger et al. (Reference Lichtenberger, Braga and Semmler2022). There is also an extensive literature on potential hedge benefits from green bonds and CBs impacting green asset returns. In Appendix E, we discuss CBs’ actions concerning climate risk and climate finance, as well as bond purchasing programs. This discussion also covers initiatives in developing economies with its specifities that might also affect monetary policy and climate risks, such as exchange rate dynamics and constraints (Gevorkyan and Khemraj, Reference Gevorkyan and Khemraj2024; Gevorkyan et al. Reference Gevorkyan2023).
In the present paper, we propose a Nonlinear Qudratic Model, NLQ, solved with AMPL algorithms to study CBs’ green climate goals. This model is directly influenced by Gross et al. (Reference Gross, Loungani and Semmler2019), Faulwasser et al. (Reference Faulwasser, Gross, Semmler and Loungani2020), and Chen et al. (Reference Chen, Semmler and Maurer2022). In the model, we allow the use of delays, and explore the effect of CB policies, guided by a finite horizon decision-making process, that allows CBs to consider climate change and climate risks. The model prioritizes multiple goals, including carbon emissions, as well as inflation, output gaps, and credit flows. The inclusion of climate considerations is a novelty in this model that allows for the study of the effect of carbon emission trends and targets.
Green financial and monetary policy goals supported by instruments and operational procedures can in principle allow for more directed green credit financial flows combating carbon emission trends. An example is the use of long-term credit operations on the financial system with “Targeted Longer-Term Refinancing Operations” (TLTROs)—see ECB (2021b). Since 2014, these operations are key to promoting targeted credit and financial flows. This could allow for an active CB policy for climate risks and impacts, if specific operational instruments channel credit and financial flows to green investments with positive externalities, including R&D and renewable energy.
In the spirit of the CBs’ awareness of climate risks, the NGFS network papers (NGFS, 2023) have also suggested operational instruments to achieve a low carbon economy. The NGFS has dealt extensively with monetary policy issues that take into account climate considerations. Given the above mentioned targeted credit flows and following NGFS communications as viable instruments, we deviate here from the position taken in the work by Aghion et al. (Reference Aghion, Boneva, Breckenfelder, Laeven, Olovsson, Popov and Rancoita2022) who posit that CBs play only a negligible role in impacting green technological transition.
But indeed there are significant obstacles. As to our knowledge there is still very little research on specific macro models dealing with the issue of short-term decision horizons, or with the decision and transmission delays of monetary policies. Furthermore, there is no work on the role of mixed stationary and non-stationary macro variables in this context, and how to combine these variables for policy-decision making with multiple goals. Additionally, explicit weights for these objectives should be implemented (in our case, we use weights for climate, macroeconomic, and financial concerns).
3. A multiple objective dynamic model with climate-macro policies
To build relevant components for this endeavor, we first employ an NLQ model to study the macroeconomic effects of CBs’ decisions in an economy facing climate risks. In this NLQ model, CBs can influence the economy by setting the interest rate (the control variable in the proposed model), managing the risk premium and credit flows through UMP, and taking into consideration climate change in their monetary operations by channeling credit flows to certain sectors.Footnote 7 The NLQ model also allows the study of CBs’ decisions when multiple objectives hold: inflation, output, financial stability, as well as arising climate risks.
Secondly, a multiple objective dynamic model is proposed and roughly calibrated using the recent economic performance of selected countries. This multiple objective NLQ model with quadratic penalty functions and nonlinear state equations is described in the following subsections by referring to a climate risk variable, the CO2 emissions trend, as a possible non-stationary variable of concern of the CB. In addition, this model deals also with stationary variables, such as the traditional macro variables referring to economic targets: the inflation rate, the output gap, and the credit flows (related to financial stability). In Section 4, we have also included other variables, and in particular the carbon emission trend for econometric studies.
3.1 Climate risks and policies to flatten the emission curve
Next, we present a macro model in which policy makers react to the previously described basic macroeconomic variables, but are also worried about climate risks. As mentioned, our model type is influenced by Gross et al. (Reference Gross, Loungani and Semmler2019), Faulwasser et al. (Reference Faulwasser, Gross, Semmler and Loungani2020), and Semmler et al. (Reference Semmler, Henry and Maurer2022). These authors use an NLQ model, solved by AMPL algorithms, to represent a CB decision problem with multiple goals and the basic state variables: inflation, output gap, and credit flow dynamics.
A type of Taylor Rule is implemented to account for financial stability, including credit flow dynamics as a financial variable.Footnote 8 Although inflation targeting models have traditionally used linear approaches, Faulwasser et al. (Reference Faulwasser, Gross, Semmler and Loungani2020) justify using a NLQ model to account for the nonlinear propagation mechanism of credit flows and credit spreads.Footnote 9 However, the model used in this paper has both non-stationary and stationary variables. This brings further theoretical modeling benefits, as well as econometric challenges.
3.1.1 A partial dynamic with a non-stationary carbon emission
Since major macro variables are stationary in CB research (or are made stationary to study them over some business cycle time scale), we focus on the non-stationarity of the carbon emissions data. Making the carbon emission variables stationary, on the other hand, would keep CBs from achieving actual international climate goals. As stated by the Paris Agreement, countries should decrease net emissions by half until 2030, and have net-zero emissions by 2050. This is needed to avoid exceeding the carbon budget the earth is able to sustain, see Edenhofer et al. (Reference Edenhofer, Kadner, von Stechow, Schwerhoff, Luderer, Edenhofer, Kadner, von Stechow, Schwerhoff and Luderer2014).
The emissions trend is the new feature of the dynamic decision model and should be discussed first before we present the full dynamic model. Most Integrated Assessment Models (IAMs), such as the Nordhaus Dynamic Integrated Climate-Economy (DICE) model are modified growth models, and in principle are non-stationary. However, most policy oriented dynamic macro models exhibit stationary features, formulated in linearized form as LQ models with a quadratic penalty, and linear state equations, see for example De Groot et al. (Reference De Groot, Mazelis, Motto and Ristiniemi2021). Often, the state variables are stationary, or made stationary through de-trending or first differencing.
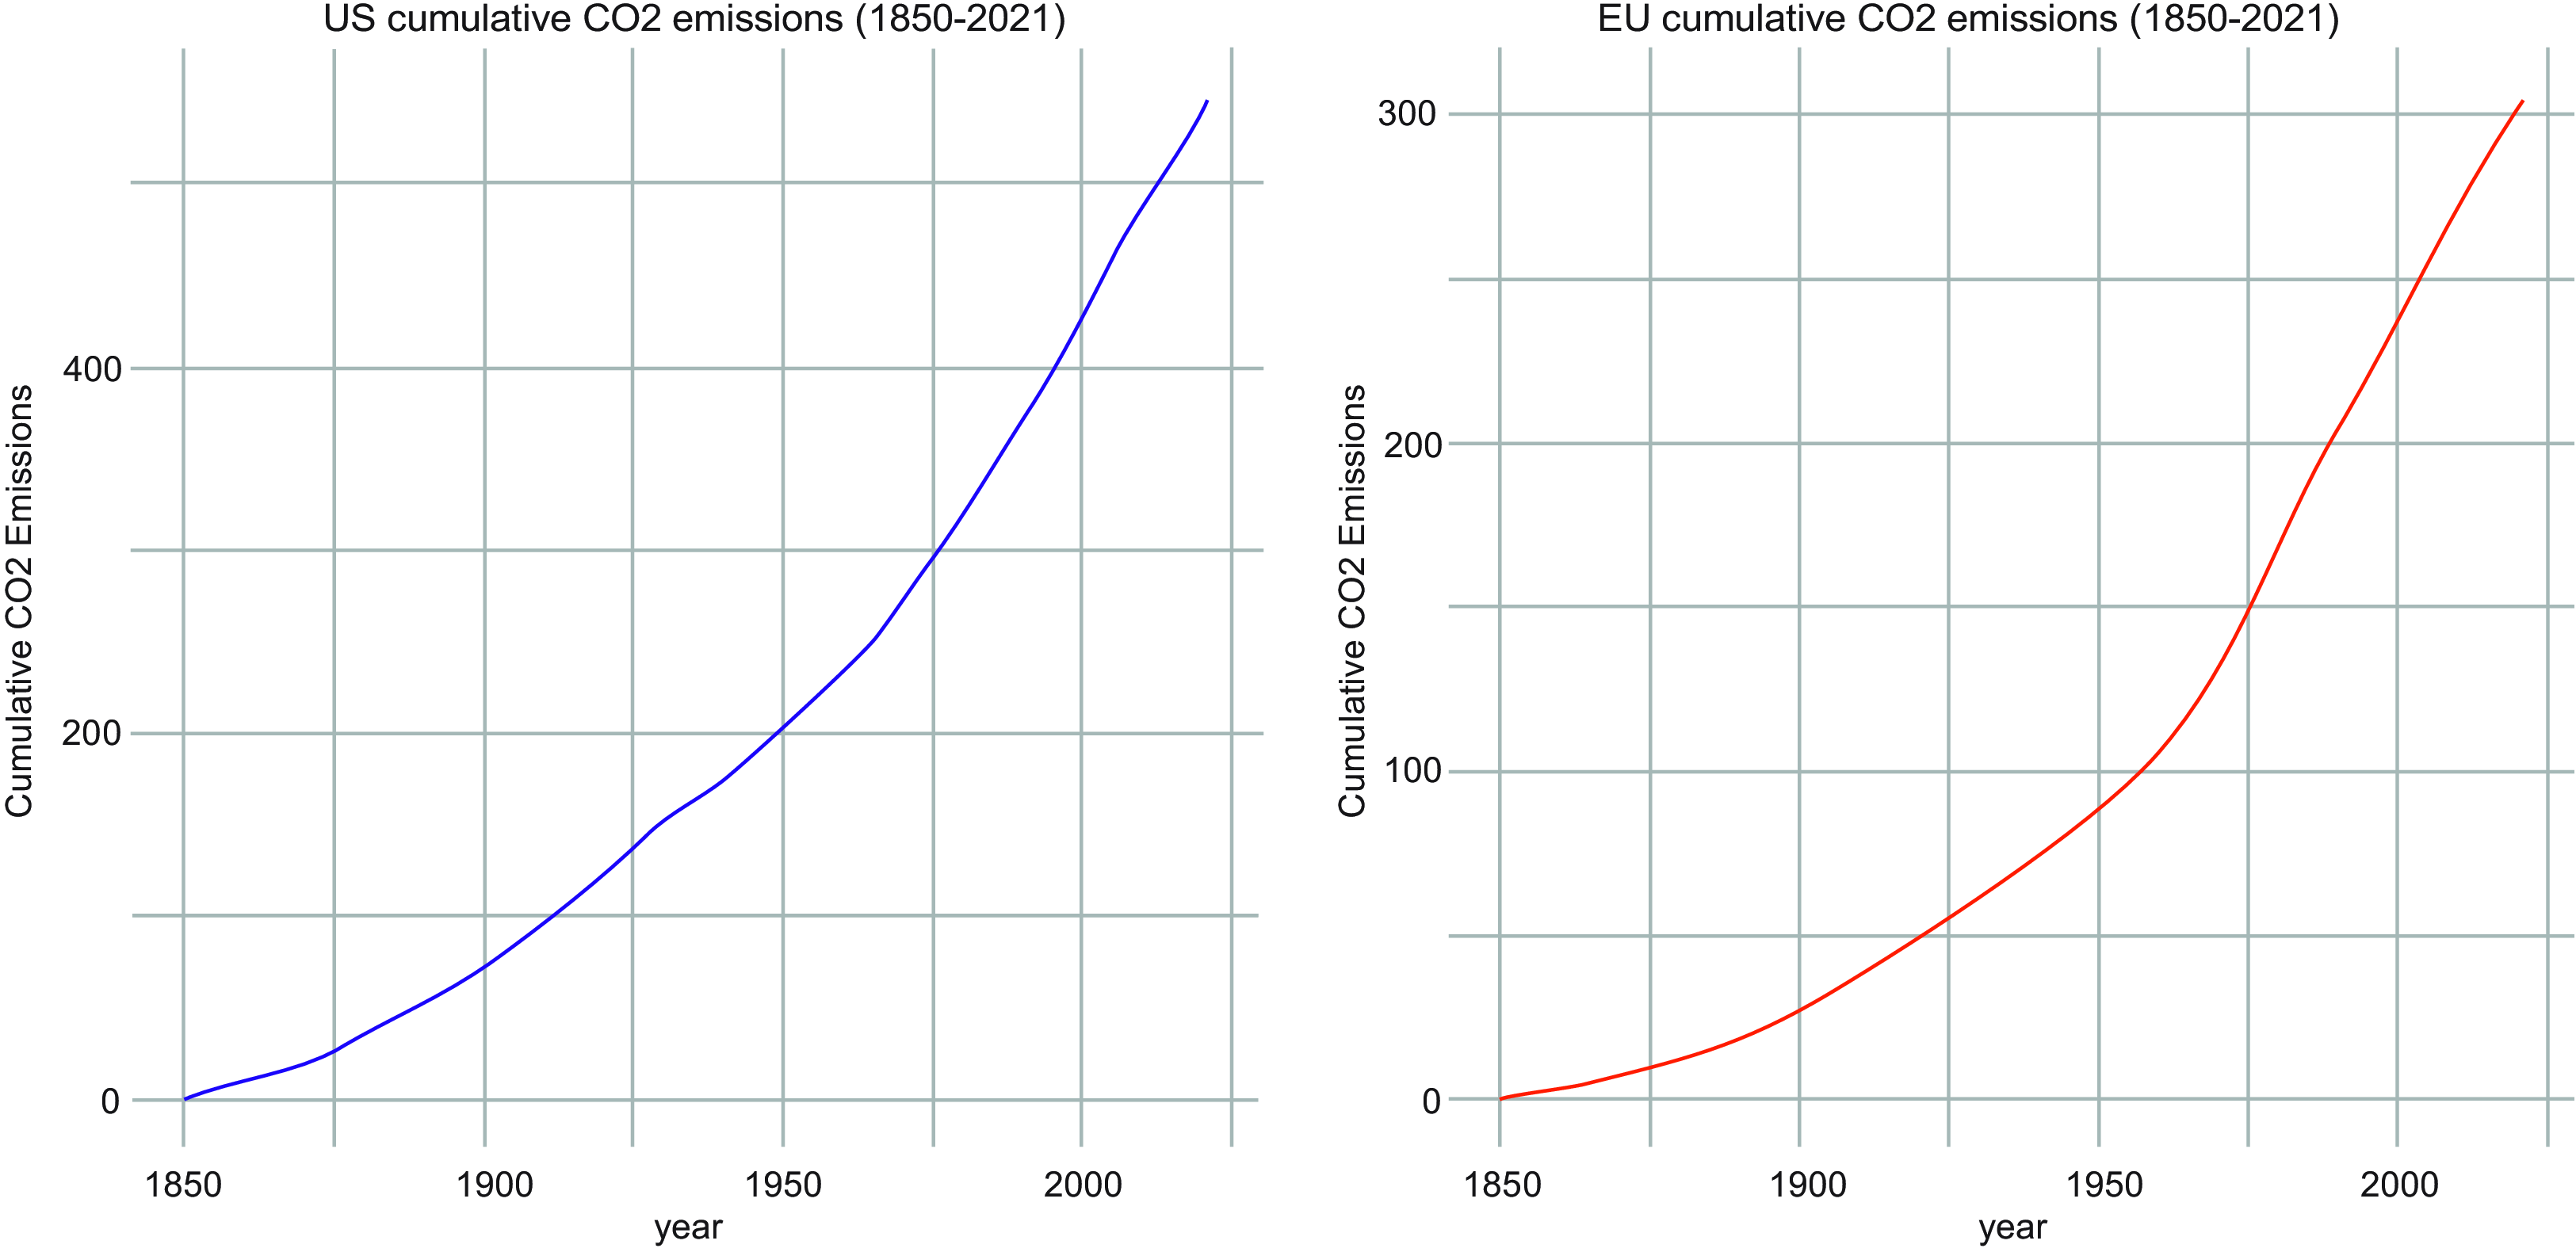
In more formal terms, the literature works with autonomous dynamic systems, meaning autonomous differential equations. In our case, our major concern is the treatment of some non-stationary state variables as state variables. Our dynamic system will thus be a non-autonomous dynamic system, driven in the simplest case by a variable with a time trend. In our case, this concerns mainly the trend in CO2 emissions, since the 1850s, depicted below for the US and Europe in Figure 1.
Cumulative emissions in Giga tons plotted from 1850 to 2021; LHS carbon emission US; RHS carbon emission Europe, source: Owid-CO2.

Figure 1 shows the annual cumulative CO2 emissions since 1850 for both the USA and all 27 European countries. Since the year 2000, the curves become less steep, with a lower net emission growth rate. However, a huge stock of CO2 has already been emitted since 1850: in the US, roughly 500 billion tons; in the EU, over 300 billion tons. These emissions have contributed to moving the world closer to its carbon budget constraint, which is roughly 400 ppm—for details see Edenhofer et al. (Reference Edenhofer, Kadner, von Stechow, Schwerhoff, Luderer, Edenhofer, Kadner, von Stechow, Schwerhoff and Luderer2014).
Technically, we can represent the type of curve in Figure 1 by a dynamic non-stationary process, leading to a rising stock of carbon in the atmosphere. These processes are then stylized by a non-autonomous differential equation in one variable with time as an independent variable:
 \begin{align} \dot {ce}(t)=-\alpha *ce(t)+log(e^{(g_{ce}t)}). \end{align}
Hereby
 $\dot {ce}(t)$
is the carbon emission flow that is driven by time, as an independent variable, but decreases due to dissipation of the atmospheric stock of carbon, for example by the rate of dissipation of carbon emission
 $\alpha$
, see the first term in eq. (1). The second term in eq. (1),
 $g_{ce}t$
, is the exogenous growth rate of emissions resulting from the use of fossil fuel due to rising output in growing economies. Here, the second term is first taken exogenously (later, this term is made endogenous through system variables). Note, however, that the exogenous growth rate of emissions,
 $g_{ce}$
could be made time dependent as well. The general solution of such a non-autonomous differential equation is driven by the two terms of the differential equation, for details see Appendix A.
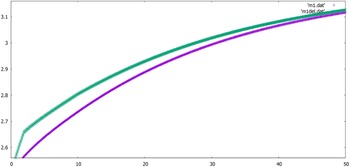
The solution of the eq. (1) can be illustrated by a numerical solution. In Figure 2, the LHS model on the left, represents actual US and EU carbon emissions and their growth rate decline. The RHS, model on the right, presents results of the simulations of the dynamic eq. (1), that includes a time-varying drift term through time-dependent growth rates.
LHS: the actual decline of net emissions for the US and EU; RHS: non-stationary carbon emissions simulated; starting from the upper curve:
 $g_{ce}=0.002,$
 $g_{ce}=0.0015$
,
 $g_{ce}=0.001$
,
 $g_{ce}=0.0005,$
and
 $g_{ce}=0.0001$
. Note: the lowest growth rate is not only flattening the curve, but reversing it.

In Figure 2, the parameters,
 $\alpha, $
 $g_{ce}$
, and the variable
 $t$
will determine the shapes of the curves. In the Figure 2 LHS, the effects of an energy transition policy in creating a low carbon economy with a lower growth rate of emissions,
 $g_{ce}$
(or other forces generating lower GDP growth rates), can flatten or reverse the stock of carbon emission curves.
The five cases in Figure 2 RHS, read from above, represent declining growth rates of
 $g_{ce}$
, given by the lower envelope. The public policy measures—such as carbon tax, cap & trade, emission standards, new green technology for energy production—but also business cycle downturns with negative economic growth rates, bring down the emissions growth rates. This stylized fact seems to match the LHS graph.
RHS, in Figure 2 gives similar results: at each curve and at a later point, the growth rate of carbon emission shrinks. In fact, in the RHS, we have assumed a lower growth rate of emission over time,
 $g_{ce}=0.002,$
 $g_{ce}=0.0015$
,
 $g_{ce}=0.001$
,
 $g_{ce}=0.0005,$
and
 $g_{ce}=0.0001$
. The previous growth rate flattens the curve, but only the lowest growth rate of CO2 emission of
 $g_{ce}=0.0001$
will reverse the curve. Then, for the growth rate of
 $g_{ce}=0.0005$
, the dissipation of the CO2 from the atmosphere is not sufficient to eventually bring the curve back to its 2000 level.Footnote 10
In this context, net zero carbon emissions means that the first term of the carbon emission dynamics eq. (1) cancels out the second term. Hereby, a slight increase in carbon stocks is allowed, given the atmospheric dissipation of carbon represented by the first term in eq. (1). Yet, note that the stock of carbon has reached a level that indicates the world has already moved beyond the carbon budget. In order to reverse this, the first term has to be larger than the second term, see Edenhofer et al. (Reference Edenhofer, Kadner, von Stechow, Schwerhoff, Luderer, Edenhofer, Kadner, von Stechow, Schwerhoff and Luderer2014). Yet, this takes time and presumably we will observe delayed effects as obstacles for this requirement. From our dynamic of eq. (1), and the curves of Figure 2, RHS, it is obvious that the sooner the growth rate of emissions
 $g_{ce}$
is brought down, the more the actual emission curve, as shown in Figure 1 will be flattened or even reversed. For Europe, this mechanism for halting the emission flows is more clear (see Figure 2, LHS). For the US, emission flows decrease to less than half, since the year 2000. But one should note that even for the EU economies, it has further decreased since the 2008-9 Global Financial Crisis (GFC) and the 2020 Covid shock.
We have the following explanation of the issue of a temporary decline of net emission since 2000 in the US and Europe, as shown in Figure 2, LHS, There was an economic cyclical effect, but also an effect from mitigation policies. In Figure 2, RHS, we observe a similar effect using declining growth rates of carbon emissions. In fact, both pictures might be explained by the work of Cohen et al. (Reference Cohen, Jalles, Loungani and Marto2018, Reference Cohen, Jalle, Loungani and Pizzuto2022) who use Okun’s gap theory to show that carbon emissions are decoupling growth rates (and decreasing) since the 2000s which can be represented by those two effects. Here, the two effects are also captured by the two components of eq. (1). The net emission goes down when the new emission slows down due to mitigation policies and business cycle effects. Yet overall, if the constraint of the carbon budget can not be maintained, the resulting vulnerabilities might trigger, tipping points and, accelerate climate-related disasters—see Greiner et al. (Reference Greiner, Gruene, Semmler, Greiner, Gruene and Semmler2010).
Another important aspect, stressed by climate researchers, is that delays until actual mitigation policies are activated or effective are too long for reducing the global warming (and thus extreme weather events), see also Nyambuu and Semmler (Reference Nyambuu and Semmler2023, ch. 9 and 10). Next, in a more generic model we will study a mix of both stationary and non-stationary variables and delayed effects.
3.1.2 The generic dynamic model with non-stationary and stationary variables
In order to study the macro policies, we combine the cyclical and the secular drivers of carbon emissions into a generic extension of the NLQ model used in Chen et al. (Reference Chen, Semmler and Maurer2022). However, we also add a slow-moving externality, as a carbon emissions trend, to drive a climate target for the generic model. Thus, the CB sets the interest rates (
 $i$
) based on its policy targets and current levels of inflation (
 $\pi$
), output gap (
 $y$
), credit flows (
 $l$
), and carbon emissions
 $(m)$
, but also has several different tools in its monetary operations toolbox for climate considerations. As often mentioned, the CBs’ monetary operations can help, but other measures, such as technological innovation, carbon pricing, financial and macro policies are also needed to affect the emission trend.
We presume in a finite horizon decision model a quadratic objective function given by eq. (2).
 \begin{equation} Min_{i(.)}\int _{0}^{T}e^{-\rho t}[w_{\pi }(\pi (t)-\pi _{s})^{2}+w_{y}(y(t)-y_{s})^{2}+w_{l}(l(t)-l_{s})^{2}+w_{m}(m(t)-m_{s})^{2}+w_{i}i(t)^{2}]dt \end{equation}
The CB exogenously sets the policy targets given by
 $\pi _{s},_{\,\,}y_{s},_{\,\,}$
and
 $l_{s}$
. Eq. (2) assigns a quadratic penalty to each variable deviation from their target value, and defines weights for each target. The weights are given by
 $w_{\pi },_{\,\,}w_{y},_{\,\,}w_{l}$
,
 $w_{i}$
and
 $w_{m}$
.Footnote 11 Furthermore, the objective function faces the constraints of the macro behavior of each variable. The state variables are represented by the following dynamic state equations:
 \begin{align} \dot {\pi }(t)=-\alpha _{1}\pi (t)+\alpha _{2}y(t), & \,\,with\,\,\pi (0)=\pi _{0} \end{align}
 \begin{align} \dot {y}(t)=-\beta _{1}y(t)-\beta _{2}(i(t)+\sigma (y(t))-\pi (t)-r) & \,\,with\,\,_{_{}}y(0)=y_{0} \end{align}
 \begin{align} \dot {l}(t)=\gamma _{1}l(t)+\gamma _{2}(y(t))-\gamma _{3}(i(t)+\sigma (y(t)))-\gamma _{4}\pi (t), & \,\,with\,\,_{_{}}l(0)=l_{0} \end{align}
 \begin{align} \dot {m}(t)=-\sigma _{1}(m(t)-m_{s})+\frac {\sigma _{2}(y(t)+d(t))}{g_{r}(s)(\sigma _{3}l(t)+\sigma _{4}d(t))+\sigma _{5}}, & \,\,with\,\,m(0)=m_{0}\\[6pt]\nonumber \end{align}
The inflation dynamics are represented by a Phillips Curve, as in eq. (3). The inflation dynamics depend on the inflation itself, and the output gap, with a negative relationship with inflation and a positive relationship with the output gap.
The output gap dynamics, eq. (4), is given by a type of IS curve. The dynamics depend on the output gap itself, and the real interest rate term:
 $(i(t)+\sigma (y(t))-\pi (t)-r)$
. The real interest rate term, as defined by Faulwasser et al. (Reference Faulwasser, Gross, Semmler and Loungani2020), is composed of the nominal interest rate,
 $i(t)$
(policy rate, the control variable), increased by the risk premium,
 $\sigma (y(t))$
, and decreased by inflation, and the natural (or neutral) interest rate,
 $r$
. The model´s control variable
 $i(t)$
is the interest rate, a conventional monetary policy tool that responds to the inflation rate and the output gap, as in a conventional Taylor Rule. Furthermore, the CB’s action also responds to the level of credit flows.
As in Faulwasser et al. (Reference Faulwasser, Gross, Semmler and Loungani2020), a credit flow
 $l(t)$
dynamic is added in eq. (5) where the credit flows have feedback effects, rresponding positively to the output gap, and negatively to the interest rate, to the risk premium
 $\sigma (y(t))$
, and to the inflation rate, since we are assuming real credit flows.
Another novelty in our set up is adding a climate trend dynamic variable, eq. (6), to the model to account for future climate disruptions. CBs are presumed to monitor this variable when deciding on monetary policy. This new variable of eq. (6) is added as a new state equation to the system where it is assumed that CBs are able to impact the share of green credit flows
 $g_{r}$
(s) towards a green transition, which will be defined as time or state dependent; we presume
 $0\leq g_{r}(s)\leq 1$
. The share of green credit flows is 0 when CBs avoid to have a climate policy and 1 if CB policy helps to replace fossil fuel investments with green investments. The monetary authorities are usually monitoring the credit flows because they have a significant impact on their objectives—the output gap, inflation rate, and financial stability, see Coenen et al. (Reference Coenen, Lozej and Priftis2024).
Note that usually macrodynamic decision problems are explored based on stationary variables, see Cai and Judd (Reference Cai and Judd2023), with fluctuations over the business cycle. Empirical literature shows that emission dynamics are highly correlated with output gap cycles following the “Okun’s Law,” as demonstrated by Cohen et al. (Reference Cohen, Jalles, Loungani and Marto2018, Reference Cohen, Jalle, Loungani and Pizzuto2022). However, climate model—such as the Nordhaus DICE model (Nordhaus, Reference Nordhaus2008)—rely on economic growth models and depend on the levels of GDP and capital stocks (with a trend which is often augmented by population growth). To introduce a climate model perspective in a dynamic macro model, an additional variable
 $d(t)$
, representing a carbon emission trend as a drift term, needs to be added to the output gap to model the emission dynamics—that might or might not be impacted by macro policies.Footnote 12
The output gap can be defined in log form as:
 $y(t)=log(Y_{a}(t))-log(Y_{p}(t))$
, where
 $Y_{a}$
is the actual output and
 $Y_{p}$
is the potential output, which is actually affecting the drift term,
 $d(t),$
in eq. (6). Negative externality effects, such as weather extremes and climate disasters can reduce the potential output,Footnote 13 but one can assume that overall there is still a net growth rate of potential output:
 \begin{align} d(t)=log(e^{(g_{n}t)}) \end{align}
In eq. (7), the
 $g_{n}$
is the net growth rate of the potential output,Footnote 14 starting with period
 $t$
=1 as the first time period, which leads to dynamics such as eq. (7).
In our model, the risk premium,
 $\sigma (y(t))$
depends on the output gap—as in Chen et al. (Reference Chen, Semmler and Maurer2022)—and can also be indirectly impacted by green credit flows. It is reasonable to assume that green credit flows carry lower risk in the long-run, due to lower carbon emissions. The risk premium itself is driven by a non-linear relationship between risk and the output gap based on a discontinuous function. It increases with a negative output gap, but can also be affected by QE and other policies undertaken by the CB.Footnote 15
As shown in eq. (8), a discontinuous function simulates this regime change. The risk premium is capped at
 $mu_{1}$
, but a QE policy is able to decrease this maximum level of risk exogenously. Hereby, we follow Chen et al. (Reference Chen, Semmler and Maurer2022) and assume
 $mu_{1}:=0.15$
, then we have:
 \begin{align} \sigma (y(t))=\begin{cases} mu_{1} & \text { if }y(t)\leq 0\\ 0 & \text {otherwise} \end{cases} \end{align}
Eq. (8) represents an essential non-linearity arising from the state-dependent risk premium.
The emission dynamics
 $m(t)$
of eq. (6) is driven by itself (first term and the second term), by the actual and trend output as part of the numerator of eq. (6)—
 $\sigma _{2}(y(t)+d(t))$
—and also by the carbon emission and the mitigation policy, both represented in the denominator, defined in eq. (9) below. Given the role of
 $g_{r}(s)$
, the emission dynamics are impacted by the denominator of eq. (6) where the credit flows and the output trend play an important role:
 \begin{align} g_{r}(s)(\sigma _{3}l(t)+\sigma _{4}d(t))+\sigma _{5} \end{align}
Hereby, the first term is zero when there is no green credit flow for supporting the mitigation policy, otherwise it is 1.Footnote 16 One should note that for a matter of simplification, we have assumed only two extreme cases.
The carbon emission dynamic in eq. (6) is formulated in a similar way as in eq. (1), but in eq. (6) the exogenously-driven (time-dependent) second part of eq. (1) increases with a higher output
 $(y(t)+d(t))$
, but can also be decreased with a higher credit mitigation policy effort, indicated by
 $g_{r}(s)(\sigma _{3}l(t)+\sigma _{4}d(t))$
. Thus, the exogenous time-dependent part of eq. (1) is now endogenized. Note that the increasing green credit flows, possibly a policy tool, given by
 $g_{r}(s)$
, decreases the carbon intensity of the output
 $(y(t)+d(t))$
. As in the Nordhaus DICE model (Nordhaus, Reference Nordhaus2008), mitigation policy can decrease emission intensities per unit of output and thus, emission growth.
We can also relate the credit flow and emission dynamics to the financial conditions in general and more specifically to the interest rate. By assuming that higher credit flows to green investments occur under low interest rates.Footnote 17 Using this idea,
 $g_{r}$
(s) is made state dependent. Instead of taking
 $g_{r}$
as a continuous function of the interest rate, we are taking it as a discrete, step wise function. In eq. (9), we propose
 $g_{r}(s)(\sigma _{3}l(t)+\sigma _{4}d(t))+\sigma _{5}$
whereby
 $g_{r}(s)$
depends on the state of the interest rate:
 $s$
exhibits a threshold with interest rates over, or below, that threshold.Footnote 18 This means that lower interest rates promote green investments while higher interest rates slow down green investments.Footnote 19 Note that lower interest rates are also often associated with declining risk premia, appearing as conducive to issuing public bonds for the decarbonization of the economy, see Braga et al. (Reference Braga, Semmler and Grass2021).
Note that if there is a relevant emission trend and green credit flows, as defined in eq. (6), this might affect other CB goals—inflation rates, the output gap, and financial stability—and this in turn affects the risk premia and policy goals, see Coenen et al. (2024).
Next, we study the model’s numerical solutions when CBs allow for climate considerations. This type of policy is represented by the carbon emission dynamics in eq. (6) by the parameter
 $g_{r}$
(s), which for illustrative reasons will be taken 1 or 0. As also shown in the CBs network publications, NGFS, there are other monetary and financial policy operations possible, which we will discuss below.
3.2 Numerical Solutions of the Generic Model
This Section studies the macroeconomic impact of a monetary and financial policy response in a recession when the CB also pursues a climate objective and uses green operational policy instruments. The CB direct targets are:
 $\pi _{s}=0$
,
 $y_{s}=0$
,
 $l_{s}=0$
, and we use an indirect target for
 $m_{s}$
,
 $m_{s}=3.0$
, with an initial conditionFootnote 20
 $m_{0}=2.5$
. First, we solve the model for the cases with no policy delay (
 $d=0$
) if the economy faces at the initial period: (i) a positive output gap, inflation, and slightly positive credit flows; and (ii) a negative output gap, a slightly positive inflation rate, and positive credit flows.
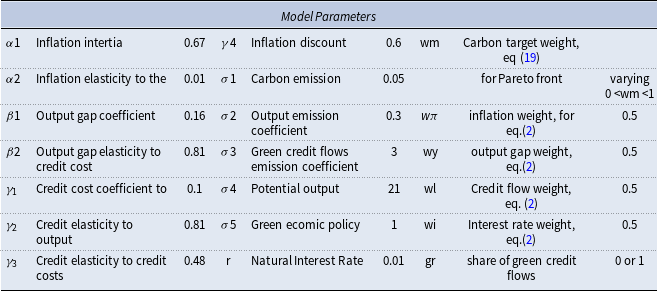
The following table, Table 1, contains the model parameters and values.
NLQ model parameters

The model versions presented in Section 3.1 are solved by using AMPL. A short sketch of the AMPL methodology with and without delays is presented in Appendices B and C.
Simulation 1
For the Simulation 1, the economy faces the following initial conditions:
 $\pi _{o}=0.015$
,
 $y_{o}=0.05$
,
 $l_{o}=0.05$
,
 $m_{o}=2.5$
. The CB keeps the interest rate high for a period of time, but decreases it to lower levels while the output gap and inflation decrease. This is why we take
 $g_{r}(s)$
as time or state dependent. In eq. (9) we have proposed
 $g_{r}(s)(\sigma _{3}l(t)+\sigma _{4}d(t))+\sigma _{5}$
whereby the
 $g_{r}(s)$
depends on time, or on the interest rate level. In the latter case, state
 $s$
exhibits a threshold with respect to the interest rates which will be higher above that threshold.
When the interest rates move down to 2%, we have a state of easy credit and the parameter
 $g_{r}(s)$
switches to 1. All interest rates above 2% will have a parameter
 $g_{r}(s)=0.$
The solutions to eqs. (3)–(5) turn out to be the same regardless of whether the state
 $g_{r}(s)$
is, 0 or 1, but the trajectories are different for the eq. (6). It depends on
 $g_{r}(s)$
, if it is 1 or
 $0$
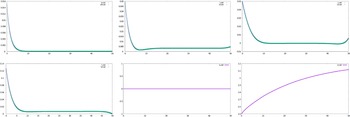
. The trajectories for the state variables and the optimal interest rate are shown in Figure 3, below.
Model simulation 1: above: inflation rate, positive output gap and credit flow; below: interest rate (
 $u$
), risk premium (
 $sy$
), and emission (
 $m$
) (when
 $g_{r}(s)=$
0 or 1); emissions are controlled implicitly through
 $g_{r}(s)$
with time-dependent switches, as soon as interest rate moves down to 2%.

Note that, in Figure 3, the inflation rate, the output gap and the credit flows start positive and then rapidly move towards the zero-bound. The interest rate also starts at a high level and then rapidly decreases towards the zero-bound. CB monetary policy attempts to keep the inflation rate and the output under control. Given that the control
 $u(t)$
represents interest rate
 $i(t)=u(t))$
, the latter moves to the zero bound. The risk premium is zero at all times since the output gap never becomes negative. The emission moves steadily up and exhibits non-stationarity since there is a drift term in the eq. (6). The emissions arising from potential output is a driver for global warming. The dissipation of emissions can also be reduced, due to the first term of eq. (6). However, emissions from output, can drive global warming and climate disasters, becoming a peril in the long run and is studied further in Atolia et al. (Reference Atolia, Loungani, Maurer and Semmler2023).
3.2.1 Simulation 2
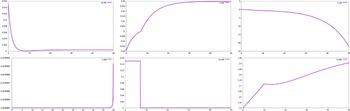
For the next simulation, see figure 4, we assume the economy faces the following initial conditions:
 $\pi _{o}=0.015$
,
 $y_{o}=-0.03$
,
 $l_{o}=0.05$
,
 $m_{o}=2.5$
and
 $m_{s}=3.0$
.
Simulation 2: above: inflation rate, negative output gap, and credit flow; below: interest rate, risk premium and emission (when
 $g_{r}(s)=$
0 up to period 10 then
 $g_{r}(s)=1$
); time-dependent regime change and the risk premium stays high as long as the output gap is negative; the emission curve is first increasing then flattening when the credit flow for decarbonization is phased in.

The interesting overall observation in both cases, simulations 1 and 2, is that the dynamics of macro variables do not change much while green credit policy (
 $g_{r}=1$
) seems to significantly favor the decarbonization efforts as compared to a no green credit policy scenario (
 $g_{r}=0$
). As a green credit policy, we could have for example ECB’s TLTROs, as it has been generally engineered since 2014. Though in our set up we first worked with an exogenously given
 $g_{r}=1\thinspace \thinspace or\thinspace \thinspace 0,$
it is now utilized in a regime switching model when
 $g_{r}(s)=$
0 up to period 10 then
 $g_{r}(s)=1$
, resulting in a flattening of the emissions curve. Here, the regime switch is modeled as a time-dependent regime change, whereby in the first 10 periods no acceleration of credit flows takes place for green credit flows. This issue will also be further explored below and in the econometric part of the paper, Section 4.
3.3 Numerical solution with delayed effects
Before exploring the econometrics of the model, we first introduce a model with delayed effects of policies. The technical features are discussed in Appendix C. The delay effects in these policies can come from decision delays and/or transmission delays. In the latter case, as the implementation of policies is supposed to work through transmission channels, their impact occurs slowly.Footnote 21 In fact, the growth rate of carbon emissions may slow down and reach net zero by 2030. Moreover, the stock of carbon emissions is projected to only start decreasing (slowly) after 2050, while weather extremes and climate disasters are still predicted to occur. Economists consider this a serious problem in climate economics research, see Nyambuu and Semmler (Reference Nyambuu and Semmler2023, ch. 9).
A dynamic finite horizon decision model with delayed effects is described by the following modified dynamics of eq. (6) while the remaining equations remain the same:
 \begin{align} \dot {m}(t)=g_{m_{0}}(t-d)-\sigma _{1}(m(t)-m_{s})+\frac {\sigma _{2}(y(t)+d(t))}{g_{r}(\sigma _{3}l(t)+\sigma _{4}d(t))+\sigma _{5}}, & \,\,with\,\,m(0)=m_{0} \end{align}
Eq. (10) replaces eq. (6). Eq. (10) now shows that the policy maker exerts her or his impact on the carbon emission variable with a decision delay and/or transmission delay.Footnote 22 This has effects on actual decarbonization. Thus, delay
 $d$
amounts to a sticky and still positive increase of
 $C02$
emissions, and a decarbonization delay of roughly 2 to 3 years.Footnote 23 There is a positive growth of net emissions,
 $g_{m_{0}}(t-d),$
which is only after
 $d-$
periods slowly reduced through policies, while the natural decay of carbon,
 $-\sigma _{1}(m(t)-m_{s}),$
still occurs later when the emissions are controlled. The third term in eq. (10) is actually effective. In other words, the growth of emissions
 $g_{m_{0}}(t-d)$
continuous to increase until the emission reduction given by the denominator in the the third term of eq. (10) becomes effective.
The major difference between the previous set-up to the model with no delayed policy—which is arising in non-delayed controlled dynamic macroeconomics as compared to the delayed policy effects as in eq. (10)—is clearly observable in our numerical results for the stock of the
 $CO2$
emissions.
In the simulations, on the lower graph of Figure 5, when we assume a regime dependence of green investments and credit flows, the dynamics of carbon emissions depends on
 $g_{r}$
(s). In fact, in Figure 5 the emissions at the beginning rises faster with a delay and then slows down when the climate policies decision becomes effective through the third term of eq. (10). Here, the higher green credit flows are phased in after period 10 and the emissions
 $m(t)$
slow down since credit flows are eventually reducing the emissions to a lower level, once
 $g_{r}=1$
is phased in, generating improved credit flows for green investments. On the the other hand, high interest rates and worsening of financial conditions (rising risk premia and credit costs), are likely to slow down effective demand triggering a financially induced recession, which then reduces output growth causing carbon emissions to decline, see Cohen et al. (Reference Cohen, Jalles, Loungani and Marto2018, Reference Cohen, Jalle, Loungani and Pizzuto2022).
Upper graph: model solution with delay, lower graph: no delay; both graphs with regime switching
 $g_{r}(s)$
of credit flows.

All together, the carbon budget is likely to move to its atmospheric constraints faster with policy and transmission delays than without those delays. Also, emissions accelerate with higher interest rates, higher risk premia, and with a lack of credit flows, as observable in the initial periods of the lower part of Figure 5. As to the delayed effects, as Nyambuu and Semmler (Reference Nyambuu and Semmler2023, ch. 10) discuss, there are many reasons why there might be delays in decisions, as well as in the transition mechanism of decarbonization policies. Reasons for delays include non-cooperative games in policy making, irreversibility of capital investments, and lock-ins in previous behavior, and policies.
Overall, the model outcomes of Sections 3.2 and 3.3 demonstrate the need for an active CB policy and support the view of including climate considerations in CBs policies. These climate facing CB policies are necessary because of the long-run negative externalities, generating upward trends in emissions with delayed impacts, that result from fossil fuel use by industrial and other sector’s activities. Yet, monetary policy and other CBs priorities—like inflation control, output gap, employment, and financial stability—can create constraints and make climate goals of CBs a great challenge.
But, as the CBs network NGFS argues, specific financial and monetary policy instruments and operations can be implemented to channel credit flows to green investments. There is of course still a need for other policies to support carbon emission reduction. Governments should, for example, promote green investments, complementary to the CBs efforts, with other types of climate policy, notably technology and fiscal policies.Footnote 24 Furthermore, although recessions are reducing carbon emission, overall emissions are still rising.Footnote 25 As we will show next, several types of policies and economic shocks are likely to affect the
 $C02$
emissions.
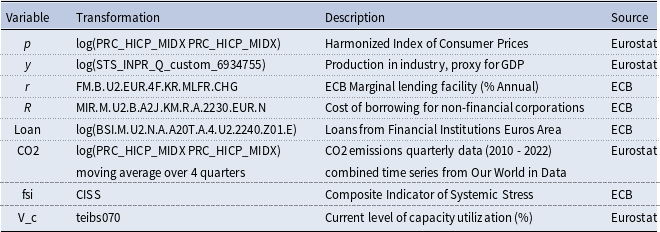
Data transformation and data sources

4. Empirical study— VECM with mixed stationary and non-stationary variables
In this Section, we address the econometric treatment of some of the issues discussed above, in particular how to deal with stationary and non-de-trended non-stationary variables. We use: “Industrial Output” and the “Harmonized Consumer Price Index” as measures of the real activity and the price level; “Current Level of Capacity Utilization” and “Composite Indicator of Systemic Stress,” as measures of the risk stress in the economy; “ECB Margin Lending Facility” as a direct monetary policy variable; “Cost of Borrowing for Non-financial Corporations” and “Loan from Financial Institutions,” as indirect policy variables. “CO2 Emissions Quarterly” is also used as the non-stationary variable, a critical variable for our investigation. The data sources and their transformation are summarized in Table 2.
Figure 6 presents a plot for the eight time series. Some of the time series data show considerable non-stationarity with co-movements across the time-series variables. However, other time series show features of stationary variables. VECM with co-integration relations are standard models for non-stationary time series because the stationary co-integrating relations among non-stationary data provide an appealing notion of equilibrium towards which the dynamic system is evolving. A large body of research works using VECM methodology can be found in the relevant literature.
Plot of actual time series.

Applying a set of unit-root tests—ADF-test, KPSS-test and PP-test—to the eight time series we find that
 $p$
,
 $y$
,
 $r$
,
 $R$
,
 $Loan$
, and
 $CO2$
are I(1) series while
 $V_{c}$
and
 $fsi$
are I(0) series. A VECM seems to be a suitable econometric model for this set of data, but the standard VECM only applies to time series with the same degree of integration, i.e. if all time series are I(1). However in this case, there are two I(0) time series. Common practice is thus to exclude the I(0) variables from the co-integration analysis. We, however, want to keep the stationary variables in the model. Following the method in Gonzalo and Ng (Reference Gonzalo and Ng2001) and Chen et al. (Reference Chen, Semmler and Maurer2022), we use a constrained VECM to handle both mixed stationary and non-stationary variables.
To present the constraint, we start with a conventional VECM.
 \begin{align} \Delta Y_{t} = \alpha \beta ^{\prime} Y_{t-1} + \sum ^{L-1}_{j=1} \phi _j \Delta Y_{t-j} + u_{t} \end{align}
where
 $Y_{t}$
is an
 $n$
vector of variables,
 $\alpha$
and
 $\beta$
are
 $n\times h$
vectors of parameter with
 $h\lt n$
, and
 $u_{t}\sim i.i.d.N(0,\Omega )$
represent the noise. We also consider
 $h$
as the dimension of the co-integration space, i.e. the dimension of the I(0) space.
We decompose the variables into two subsets. Let
 $Y_{t}=(Y_{1t}^{\prime},Y_{2t}^{\prime})^{\prime}$
with
 $Y_{2t}$
is
 $k$
-dimensional I(0) series and
 $Y_{1t}$
is
 $n-k$
dimensional I(1) series. Decomposing the co-integration vectors accordingly we have:
 \begin{eqnarray} \left [\begin{array}{c} \Delta Y_{1,t}\\ \Delta Y_{2,t} \end{array}\right ] = \left [\begin{array}{c@{\quad}c} \beta ^\prime _{11} & \beta ^\prime _{12}\\ \beta ^\prime _{21} & \beta ^\prime _{22} \end{array}\right ] \left [\begin{array}{c}Y_{1,t-1}\\ Y_{2,t-1}\end{array} \right ] + \sum ^{L-1}_{j=1} \phi _j \Delta Y_{t-j} + u_t \end{eqnarray}
The necessary and sufficient condition for
 $Y_{t}$
to contain
 $k$
I(0) components are formulated as follows:
 \begin{equation} \mathcal {H}_{m}\,:\,\beta _{12}^{\prime}=0\mbox { and }\beta _{21}^{\prime}=0. \end{equation}
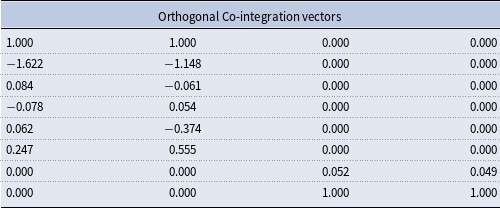
The constraints imply that the co-integration space, i.e. the I(0) space, of a mixed VECM can be decomposed into two orthogonal sub-spaces: the I(0) subspace spanning the I(0) variable, and the I(0) subspace of the linear combinations of the I(1) variables. These two restrictions are intuitively appealing. Indeed,
 $\beta _{12}=0$
and
 $\beta _{21}=0$
as I(1) variables do not form linear combinations with I(0) variables to become stationary.
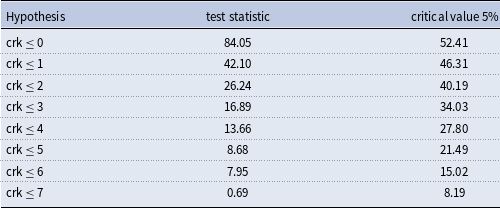
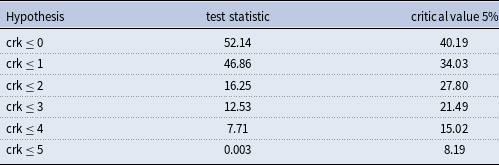
Condition (13) implies that a mixed VECM with I(1) and I(0) components is a special case of a conventional VECM, with restrictions on the co-integrating vectors. Therefore, the Johansen procedure can be used to determine the co-integration rank—i.e. the dimension of the I(0) space—and a test of the presence of I(0) components can be conducted with the condition (13) as the null hypothesis. It is worth noting that the Johansen’s test gives the dimension of the I(0) space, but not the number of independent co-integration relations in a mixed VECM. In a VECM where all variable are I(1), the dimension of the I(0) space corresponds to the number of independent co-integration relations. In a mixed VECM with six I(1) variables and two I(0) variables, if the Johansen’s test results in
 $rank=4$
, this implies that there are two I(0) components, and two independent co-integration relations among the six I(1) variables.
Both conditions are linear restrictions on
 $\beta$
. Following Boswijk and Doornik (Reference Boswijk and Doornik2004), linear restrictions on
 $\alpha$
and
 $\beta$
can be formulated in the following form:
 \begin{equation} \mbox {vec}(\alpha ^{\prime})=G\psi,\quad\mbox {vec}\beta =H\phi +h_{0}, \end{equation}
where
 $G$
and
 $H$
serve as selection matrices and
 $\psi$
and
 $\phi$
are freely varying parameters. If there are no restrictions on
 $\alpha$
,
 $G$
is chosen as an identity matrix, and hence
 $\mbox {vec}(\alpha ^{\prime})=\psi, $
and all elements of
 $\alpha$
are freely varying parameters. Similarly,
 $H$
is also a selection matrix.
 $H$
is chosen as an identity matrix and
 $h_{0}={\bf 0}$
. If there are no restrictions on
 $\beta$
and if the
 $i-th$
element of
 $\mbox {vec}\beta$
is restricted to be zero,
 $H$
is obtained by leaving out the
 $i-th$
column of the identity matrix and the
 $i-th$
element of
 $h_{0}$
is set to be
 $0$
. If the
 $i-th$
element of
 $\mbox {vec}\beta$
is a constant
 $c$
,
 $H$
is obtained by leaving out the
 $i-th$
column of the identity matrix and the
 $i-th$
element of
 $h_{0}$
is set to be
 $c$
.
Boswijk and Doornik (Reference Boswijk and Doornik2004) propose the following iteration process to calculate the constrained parameter and thus to test the hypothesis related to the constraints.
 \begin{equation*} \tilde {\psi }(\phi, \Omega )=[G^{\prime}(\Omega ^{-1}\otimes \beta^{\prime}S_{11}\beta )G]^{-1}(\Omega ^{-1}\otimes \beta^{\prime}S_{11})\mbox {vec}(\hat {\Pi }^{\prime}_{LS}) \end{equation*}
 \begin{equation*} \tilde {\phi }(\psi, \Omega )=[H^{\prime}(\alpha ^{\prime}\Omega ^{-1}\alpha \otimes S_{11}\beta )H]^{-1}H^{\prime}(\alpha ^{\prime}\Omega ^{-1}\otimes S_{11})\Big [\mbox {vec}\big (\hat {\Pi }^{\prime}_{LS}\big )-(\alpha \otimes I_{p1})h_{0}\Big ]. \end{equation*}
 \begin{equation*} \tilde {\Omega }(\psi, \phi )=S_{00}-S_{01}\beta \alpha ^{\prime}-\alpha \beta ^{\prime}S_{10}+\alpha \beta ^{\prime}S_{11}\beta \alpha ^{\prime}, \end{equation*}
where
 $\Omega$
is the covariance matrix of the residuals
 $u_{t}$
in VECM in (11),
 $S_{01}$
,
 $S_{11}$
, and
 $S_{00}$
are the cross products of the two auxiliary regressions in the Johansen procedure.
 \begin{equation} S_{00}=\frac {1}{T}(\Delta Y^{\prime}\Delta Y-\Delta Y^{\prime}W[W^{\prime}W]^{-1}W^{\prime}\Delta Y), \end{equation}
 \begin{equation} S_{11}=\frac {1}{T}(Y_{-1}^{\prime}Y_{-1}-Y_{-1}^{\prime}W[W^{\prime}W]^{-1}W^{\prime}Y_{-1}), \end{equation}
 \begin{equation} S_{01}=S^{\prime}_{10}=\frac {1}{T}(\Delta Y^{\prime}Y_{-1}-\Delta Y^{\prime}W[W^{\prime}W]^{-1}W^{\prime}Y_{-1}), \end{equation}
where the
 $\Delta Y$
,
 $Y_{-1}$
and
 $W$
are the data matrices (consisting of
 $T$
rows) of
 $\Delta Y^{\prime}_{t}$
,
 $Y^{\prime}_{t-1}$
and
 $W^{\prime}_{t}$
with
 $W^{\prime}_{t}=\Delta Y^{\prime}_{t-1},\ldots, \Delta Y^{\prime}_{t-p}$
, and
 $\hat {\Pi }_{LS}=S_{01}^{-1}S_{11}^{-1}$
.
Starting from a set of initial values
 $(\psi _{0},\phi _{0},\Omega _{0})$
, the iterations then become
 ${\psi }_{j}=\tilde {\psi }(\phi _{j-1},\Omega _{j-1})$
,
 ${\phi }_{j}=\tilde {\phi }(\psi _{j},\Omega _{j-1})$
,
 ${\Omega }_{j}=\tilde {\Omega }(\psi _{j},\phi _{j})$
. The iteration procedure stops when the changes in estimated values between two steps are below a prescribed threshold. According to Boswijk and Doornik (Reference Boswijk and Doornik2004), the following likelihood ratio is asymptotically
 $\chi ^{2}$
with degree of freedom
 $rk$
 \begin{equation} \mathcal {LR}(\mathcal {H}_{m}|\mathcal {H}_{u})=T\big [\log |{\tilde {\Omega }}|-\log |\hat {{\Omega }}|\big ] \xrightarrow{d} \chi ^{2}(rk), \end{equation}
where
 $\tilde {\Omega }$
is the constrained estimate under constraint (13) and
 $\hat {\Omega }$
is the unconstrained estimate in (12) denoted by
 $\mathcal {H}_{u}$
.
This likelihood ratio test can be used to test the number of I(0) variables in a mixed VECM. For the hypotheses of 1, 2, 3, I(0) components
 $b_{12}$
and
 $b_{21}^{\prime}$
are (
 $7\times 1$
), (
 $6\times 2$
) and (
 $5\times 3$
) matrices of zeros respectively. The p-values of the three tests are: 0.31, 0.048, and 0.01 respectively. We conclude that there are two I(0) variables and that the p-value is slightly less than 0.05.
For the estimated mixed VECM, we calculate the impulse response functions. To avoid the problem of identification of shocks, we use the generalized impulse response proposed in Pesaran and Shin (Reference Pesaran and Shin1998). The shocks are all one-unit positive shocks.
In the subsequent figures, we have summarized the shocks to both non-stationary and stationary variables and their effect on the CO2 emissions. Details of the Impulse Response trajectories from any of the eight variables to other variable are reported in Appendix D.
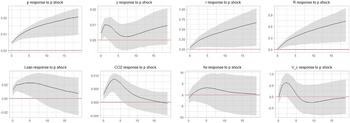
The econometric analysis, with mixed stationary and non-stationary variables, predict shocks to non-stationary variables and show a mean reversion to the stationary variables. In Figure 7, we report only the IRs of the shocks of each macro variable on the CO2 emissions and observe some important results.
CO2 responses, impulse responses.

First, as Figure 7 shows, a shock to a non-stationary variable, such as GDP, is correlated with the growth rate shift of CO2 emissions. Their growth rates depend heavily on the GDP shocks and experiences which shifts with higher GDP. At the beginning there is some overshooting of the CO2 emissions with a subsequent reduction. But overall there is an upward shift. Since the price level is correlated with the GDP growth, a similar effect can be seen for the impact of the price level shocks on CO2 emissions, though less pronounced. Conversely, if the GDP shock is negative, it would lead, at least in the shorter-run, to a decline of CO2 emissions, see also Cohen et al. (Reference Cohen, Jalles, Loungani and Marto2018, Reference Cohen, Jalle, Loungani and Pizzuto2022).Footnote 26
Second, a further result of Figure 7 is that shocks to other non-stationary variables, such as financial condition (credit cost), cause level shifts: a rise of the interest rate and the risk premium will reduce the CO2 emissions. This is likely the effects of the rising cost of borrowing and output contractions. These are also macroeconomic demand effects: falling demand and output contraction will reduce CO2 emissions. There is also a supply effect: positive credit or loan shocks, and an increase in credit flows, as we have found in Figure 6, is likely to decrease emissions in the longer run (see the non-stationary effect of a loan shock in Figure 7). Higher credit flows, possibly accompanied by a lower cost of borrowing, are likely to cause more green investments and lower CO2 emissions.Footnote 27
Third, in Figure 7, for the stationary variables, a shock to the Financial Stress Index (FSI) leads to a decline in CO2 emissions, presumably through more financial stress and output decline. In contrast, for rising capacity utilization, a temporary rise in the CO2 emission occurs. These are also two plausible results. In the latter two cases we can, however, as predicted, observe mean reversion to zero, since both variables are constructed as stationary.
As to operational tools of CBs, one can classify interest rates, credit cost, and credit flows as direct operational tools against climate risks, but the output variation only as an indirect tool (which, of course, CBs cannot steer easily). Moreover, we can observe, see eqs. (3)–(6) and Appendix D, that each possible operational tool of CBs to reduce CO2 emissions and avoid climate risk has side effects on other targets and objectives.
As Allen et al. (Reference Allen, Mathieu Boullot, D?es, de Gaye, Lisack, Thubin and Wegner2023) argue, macroeconomic imbalances and disruptions are likely to be present through dynamically generated imbalances resulting from climate risks and/or transition efforts to a low carbon economy. CBs are thus not neutral given their target imbalances. It thus raises the question of what relative weights should CBs assign to their policy objectives (and goals), so they can manage multiple vulnerabilities when their objectives have become imbalanced.
5. How to manage multiple vulnerabilities and conflicting goals?
Whereas the above solutions in Section 3 assume fixed and equal weights for the multiple targets, CBs are usually confronted with multiple vulnerabilities and conflicting goals arising at certain time periods. CBs have to manage, and need to set, primary objectives for a certain time period. Often CBs confirm that they have multiple worries, but are optimistic by stating that they have tools and operational instruments for the different objectives. But as Allen et al. (Reference Allen, Mathieu Boullot, D?es, de Gaye, Lisack, Thubin and Wegner2023) argue, climate risk will generate threats to the other macroeconomic targets as well.
In this spirit, we introduce a method that helps prioritizing objectives and their time variation. We explore what the suitable weights for certain objectives could be to manage these multiple goals. We also briefly discuss time varying objectives for different time horizons, indicated by a regime-switching model, see also Brunnermeier and Landau (Reference Brunnermeier and Landau2021).
The managing of multiple vulnerabilities and conflicting goals with the prioritizing policy decision objectives when several macroeconomic worries have emerged is indeed an important issue of dynamic decision making, where one has to assign plausible weights to the objectives. We are motivated by Kaya and Maurer (Reference Kaya and Maurer2023) who revive a traditional construction known as Pareto front. We transform our dynamic decision problem with multiple objectives into a bi-objective problem.Footnote 28 We want to note that such an exploration is particularly needed when multiple vulnerabilities and conflicting goals interact—and which could be quite disruptive.
We include the monitoring of the squared deviation of actual emission from a target emission
 $(m(t)-m_{s})^{2}$
in the multiple objective function.Footnote 29 We then decompose the problem of decision making with multiple objectives into two sub-problems by assigning different weights to the sub-problems to obtain a final solution. Let us define a sub-divided function with two groups of objectives where we also include the trend of the carbon emissions:
 \begin{equation} Min_{i(.)}\int _{0}^{T}e^{-\rho t}[w\{(\pi (t)-\pi _{s})^{2}+(y(t)-y_{s})^{2}+(l(t)-l_{s})^{2}\}+(1-w)\{(m(t)-m_{s})^{2}+i(t)^{2}\}]dt \end{equation}
Hereby, one sub-group of objectives has the weight
 $w$
and the other the weight
 $(1-w)$
whereby we introduce a loop of a varying
 $w,$
with
 $0\leq w\leq 1$
, to the two following sub-integrals that are computed recursively, but are connected in a loop with eq. (19). The two looped sub-integrals are:
 \begin{equation} int1=\int _{0}^{T}e^{-\rho t}[\{(\pi (t)-\pi _{s})^{2}+(y(t)-y_{s})^{2}+(l(t)-l_{s})^{2}\}]dt \end{equation}
and
 \begin{equation} int2=\int _{0}^{T}e^{-\rho t}[\{(m(t)-m_{s})^{2}+i(t)^{2}\}]dt \end{equation}
Note that other bi-objective problems could be chosen as well.
Here, we have chosen the above two bi-objective, denoting two groups of objectives used to solve the integral eq. (19), but one sub-group is relevant for the climate considerations of the policy makers. Then the aggregate integral value should have a minimum at
 $0\leq w\leq 1$
.Footnote 30 Given our dynamic state equations of eqs. (3)–(6) and the recursively solved eqs. (19)–(21) with varying weights
 $w$
, we obtain the following Pareto front, resulting from a global minimum of eqs. (19)–(21) when the weight
 $w$
varies.
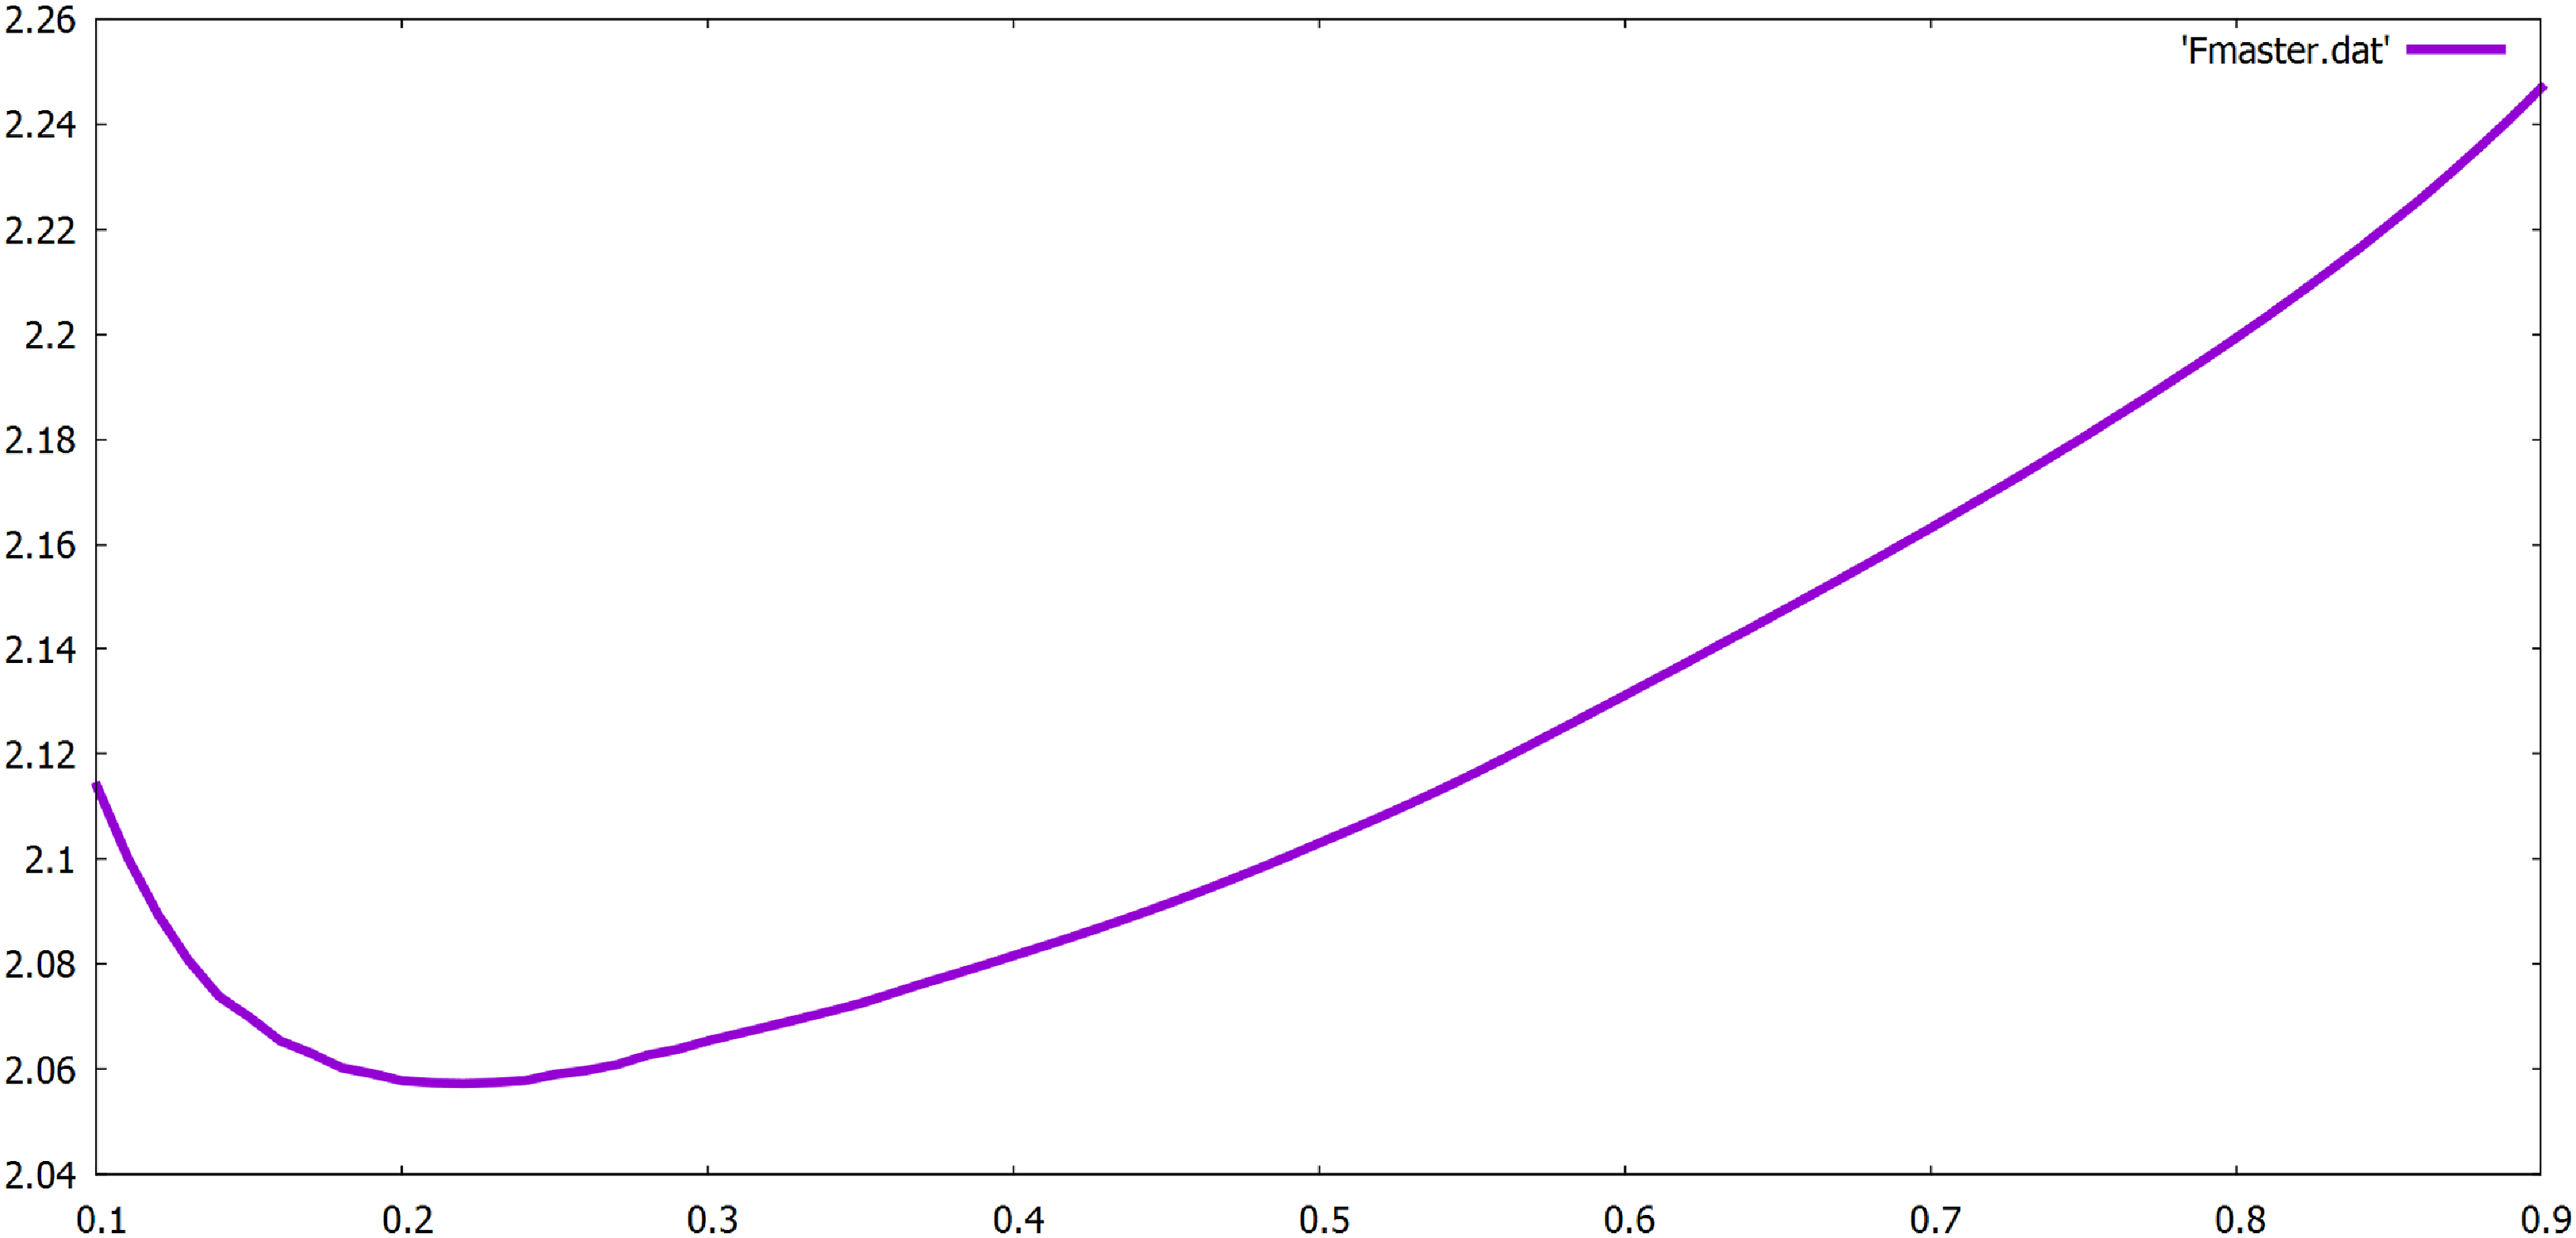
The Fmaster functionFootnote 31 of Figure 8 is based on eqs. (19)–(21), using the above initial conditionsFootnote 32 and the loops for
 $w$
, which provide at the global minimum of the Fmaster function, proper weights for prioritization of objectives for the decision maker considering multiple macroeconomic worries.Footnote 33 The solution of the Fmaster function which represents a Pareto front provides the suitable weights for the first and second objective functions when those are viewed as desirable objective groups. In the above case, the weights should be roughly
 $w=0.2$
and
 $(1-w)=0.8$
, at the minimum of the curve in Figure 8.
Fmaster function for the pareto front, with initial conditions and parameters:
 $m_{0}=2.5$
and
 $m_{s}=3.0$
for eqs. (19)–(21) and
 $\pi _{o}=0.015$
,
 $y_{o}=0.05$
,
 $l_{o}=0.1$
;
 $m_{0}$
corresponds to the current situation and
 $m_{s}$
to the requirement to keep the carbon emission below the constraints of the carbon budget.

Furthermore, Brunnermeier and Landau (Reference Brunnermeier and Landau2021) raise an important issue concerning the time horizon for different objectives. They state that central banks have shorter, business cycle oriented objectives, such as inflation, output and financial stabilization; and longer run objectives, for example climate goal oriented objectives. This issue could also be treated in this context by using a dynamic model with different decision horizon, as proposed by a number of papers in Haunschmied et al. (Reference Haunschmied, Kovacevic, Semmler and Veliov2020), and see also Di Bartolomeo et al. (Reference Di Bartolomeo, Minooei Fard and Semmler2023), where there is a model with a shorter run and longer run decision making process. A further discussion of measures against climate risks and operational tools of CBs is relegated to appendix E.
6. Conclusions
A growing number of studies defend the use of green monetary and financial policy instruments and those authors argue that CBs should have active climate mitigation goals. While other authors promote conventional monetary policy targets only. However, we cannot ignore the fact that climate change will affect monetary policy behavior and its effectiveness. We have demonstrated in this paper that physical risks and transition efforts can increase financial market risk and instability, and require additional CBs actions. Though monetary and financial policies, such as mitigation efforts are needed, frictions and risks in green credit allocation and risk pricing will also become important for CBs policy actions. With respect to these efforts, there is an important trend variable to be considered, the carbon emissions trend arising from market externalities. This becomes particularly important when there are delayed effects of policy actions, see appendix C, that cause and generate, when not effective enough, tipping points, amplifying the frequency and intensity of extreme weather events.
In terms of challenges for macroeconomic modeling, such trend variable effects have recently become an analytical topic in dynamic optimization solution methods, see Cai and Judd (Reference Cai and Judd2023) and Gruene and Pirkelmann (Reference Gruene and Pirkelmann2020). A further advancement in the econometric data treatment to deal with mixed stationary and non-stationary VECM and IRs are also needed, as suggested in Chen et al. (Reference Chen, Semmler and Maurer2022) and Pesaran and Shin (Reference Pesaran and Shin1998). Decision and transmission delays are other issues to be considered as studied in more general terms by Goellmann and Maurer (Reference Goellmann and Maurer2014), and so are the multiple objective policy problems as studied in Kaya and Maurer (Reference Kaya and Maurer2023).
Imbalances, multiple vulnerabilities, and conflicting goals for policies indeed may arise and even mitigation or adaptation measures may generate those imbalances. Multi-target decision models for climate policies should be utilized where a specific choice of decision weights are needed for more urgent vulnerabilities and objectives, in particular when monetary and financial policies are added to help to flatten, or reverse the emission curve. Our paper adds a carbon emission trend and climate target—among other targets—and suggests the potential use of additional policy tools which are also extensively discussed by the NGFS (2023) paper.
Monetary authorities usually have direct operational instruments available, such as the interest rate, reserve requirements, and other instruments to impact risk and term premia. These tools can impact risk premia, the credit cost, and credit flows. Other indirect methods such as purchasing specifically climate-related assets and bonds, as well as stress tests for the prevention, or buffering, of climate risks and disruptions are needed. Also, as the transition to a low carbon economy may proceed orderly, or disorderly (with economic and financial disruptions), the study of different scenarios are needed. Only the Bank of England has explicitly announced a climate mandate, but tools—such as green lending quotas, directed credit flows, reserve requirements and mandatory climate risk assessments—can be implemented by other CBs as well, see NGFS (2023).
Our model shows that CBs with climate goals, or acting with green financial and monetary policy instruments, help reduce the carbon emission trajectory while reaching lower risk premiums and credit costs to reduce the carbon emissions thereby flattening and reversing the emission curve and reducing climate risks and costs. However, in order to decrease this emissions trajectory even faster, priorities should be considered, as in Section 5, and other climate policies should also be implemented, such as green energy innovations, fiscal and sectoral policies. In the area of monetary and financial policy, multiple objective studies should be encouraged. Although we have not included a study of the frequency and severity of damages arising from such emission trends, a more detailed exploration of this perspective is provided by a model in Atolia et al. (Reference Atolia, Loungani, Maurer and Semmler2023) and econometrically in Mittnik et al. (Reference Mittnik, Semmler and Haider2020).
Acknowledgements
We are very grateful to Helmut Maurer for providing help with the computational part of the paper and for comments and discussions on an earlier version of our work. We also would like to thank Athanasius Orphanides, Jerome Henry and Andrea Roventini for discussions. We are grateful for comments from the audience of the conference of the Society for Computational Economics, CEF, Nice 2023. We also want to thank Lars Gruene for helpful discussions and clarifications, Bob Tetlow from the FED for productive correspondences and Stephane Dees from the Banque de France for making available to us the research from the Central Banks’ Network for Greening the Financial System, NGFS. The research on this topic started when Willi Semmler was a visitor at the ECB and the IMF IEO.
Appendices: Technical details and policy decisions
Appendix A: Solution of the non-autonomous equation
In Section 3.1. we have introduced the following non-autonomous differential equation:
 \begin{align} \dot {ce}(t)=-ce(t)+log(e^{(g_{ce}t)}) \end{align}
The CO2 emissions change is driven by two terms: the first term represents the dissipation of CO2 (a fraction of the stock of atmospheric CO2 absorbed by forests, oceans, and land). The second term represents new emission flows, this being the total amount dependent on time. New emission flows are defined by the growth rate
 $g_{ce}$
and time
 $t$
. One should note that the growth rate itself could vary over time.
In general, the non-autonomous differential equation (A1) is of the form:
 \begin{align} \dot {x}=\lambda x(t)+by(t) \end{align}
This type of non-autonomous differential equation, in which the time dependency is additive, has been previously used in economics, see Gandolfo (Reference Gandolfo1997). Since there is a convergence to a long-run trajectory defined by the function
 $\bar {x}(t)$
., we assume that
 $\lambda \lt 0$
, and
 $y(t)$
is a time-dependent exogenous variable (here the CO2 emissions growth trend). Given eq. (A1),
 $y(t)$
grows exponentially as
 $y(t)=e^{\gamma t}$
, where
 $\gamma \gt 0$
and can change over time. Furthermore, we assume that an initial value of the endogenous variable
 $x$
is
 $x(0)=x_{0}$
, which is initially given.
The solution to the initial value problem is:
 \begin{align} x(t)=e^{\lambda t}\biggl (x(0)-\frac {b}{\gamma -\lambda }\biggl )+\frac {b}{\gamma -\lambda }e^{\gamma t} \end{align}
If
 $\lambda \lt 0$
, we see that while
 $t$
gets larger he first term dissipates for any initial value
 $x(0)$
. We have then:
 \begin{align} \lim _{t\to \infty }x(t)=\bar {x}(t)\equiv \frac {b}{\gamma -\lambda }e^{\gamma t} \end{align}
For a proof of the existence of a long-run steady state, see also Brito (Reference Brito2023). The trajectory approaches, a steady state in the long run, and in the log case, the trajectory becomes a straight line (as in all four trajectories in Figure 2 do, depending on the growth rate
 $g_{ce}$
). Yet, the deviation from the trend variable is steadily declining at the beginning, as the trajectories in Figure 2 show. This example illustrates the two forces with control actions, impacting the second term of (A1) or (A3). Such a non-autonomous system with control, defined as a time varying control problem, tracking time-varying data, is also presented in Gruene and Pirkelmann (Reference Gruene and Pirkelmann2020).
Appendix B: The use of AMPL
The AMPL solution method is discussed in Atolia et al. (Reference Atolia, Loungani, Maurer and Semmler2023) as summarized in the present Appendix. To solve the control problem, the method starts with the discretization in nonlinear programming based on the approach “First Discretize then Control solution”. The discretization for solving the control problem on a fine grid leads to a large-scale nonlinear programming problem that can be conveniently formulated with the help of “A Mathematical Programming Language” (AMPL), developed by Fourer et al. (Reference Fourer, Gay and Kernighan1993)—see also Waechter and Biegler (Reference Waechter and Biegler2006), Goellmann and Maurer (Reference Goellmann and Maurer2014) and Atolia et al. (Reference Atolia, Loungani, Maurer and Semmler2023). The AMPL can be linked to several powerful optimization solvers. We use the Interior-Point Optimization Solver Ipopt. The Lagrange multipliers and adjoint variables can be computed a posteriori in Ipopt, to verify the necessary optimality conditions. AMPL computes the dynamics of delay effects concerning control, as well as state variables.
Appendix C: Dynamics with delayed effects
The following example of a control model with a delay is illustrated by using three dynamic state variables, and one control variable that exerts effects on the solution paths of the variables with a delayed effect. Differential delay systems were already studied in the 1930s, see also Matsumoto and Szidarovszky (Reference Matsumoto and Szidarovszky2011). However, we have included control actions. For such a methodology, there is an approach that allows a study of the necessary optimal conditions (Minimum Principle) to be applied directly for time-delayed optimal control problems. It uses the discretization methods developed by Goellmann and Maurer (Reference Goellmann and Maurer2014). The latter numerical technique is used in Sections 3.2. and 3.3.
To give a rough sketch of what is done in Section 3 when using a delay the current-value Hamiltonian functionFootnote 34 can be given for a case of one control, and three dynamic state variables, such as defined in eqs. (3)–(5). The Hamiltonian then reads:
 \begin{align} H(X,p,i,i_{d})=(X-X_{s})^{*}C(X-X_{s})+i^{2}+p^{*}f(X,i_{d}), \end{align}
where
 $i_{d}$
denotes the delayed control variable defined by
 $i_{d}(t)=i(t-d)$
and
 $p=(p_{\pi },p_{y},p_{l})\in R^{3}$
are the ad-joint (co-state) variables. Here we present a case where we do not use delays in the state variables such as
 $\pi (t),y(t),l(t)$
.
When the expression
 $(X_{*}(\cdot ),i_{*}(\cdot ))$
represents an optimal solution of the control problem then we can define adjoint (co-state) variables which give rise to the property of a piece-wise continuous and piece-wise differential ad-joint function
 $p\,:\,[0,T]\rightarrow R^{3}$
for which the adjoin equations hold:
 \begin{align} \dot {p}(t)=\rho \,p(t)-\frac {\partial H}{\partial X}(X_{*}(t),p(t),i_{*}(t),i_{*}(t-d)),\quad p(T)=e^{\,\rho \,T}\,(X(T)-X_{s}). \end{align}
Note that the adjoin variable vector
 $p(t)$
for the current-value Hamiltonian is derived from an adjoin variable
 $\tilde {p}(t)$
by
 \begin{align} p(t)=e^{\rho \,t} \end{align}
For our control problem with a delay, the minimum conditions for the control problem can be derived, see Chen et al. (Reference Chen, Semmler and Maurer2022). The adjoin equations can be expressed explicitly for
 $y(t)\not =0$
:
 \begin{align} \begin{array}{rcl} \dot {p}_{\pi }(t) & = & \rho \,p_{\pi }(t)-(\pi (t)-\pi _{s})-p_{\pi }(t)\alpha _{1}-p_{y}(t)\beta _{2}+p_{l}(t)\gamma _{l},\\ \dot {p}_{y}(t) & = & \rho \,p_{y}(t)-(y(t)-y_{s})-p_{\pi }(t)\alpha _{2}+p_{y}(t)(\beta _{1}+\delta ^{\prime}_{a}(y(t)))\\ & & -p_{l}(t)(\gamma _{2}-\gamma _{3}\delta ^{\prime}_{a}(y(t))),\\ \dot {p}_{l}(t) & = & \rho \,p_{l}(t)-(l(t)-l_{s})-p_{l}(t)\gamma _{1}. \end{array} \end{align}
If there is no control constraint activated, and omitting the asterisk for an optimal solution, the minimization conditions as follows is obtained:
 \begin{align} \begin{array}{rcl} 0 & = & \frac {\partial H}{\partial i}\,(X_{t}(t),p(t),i_{t}(t),i(t-d))\\ & & +\chi _{\,[0,T-d]\,}(t)\,\frac {\partial H}{\partial i_{d}}\,(X(t+d),p(t+d),i(t+d),i(t))\\ & = & \left \{ \begin{array}{lcl} i(t)-p_{y}(t+d)\beta _{2}-p_{l}(t+d)\gamma _{3} & \mbox {for} & 0\leq t\lt T-d,\\ i(t) & \mbox {for} & T-d\leq t\leq T. \end{array}\right . \end{array} \end{align}
If we have the case of a positive delay,
 $d\gt 0$
, equation (A9) yields the terminal control
 $i(t)=0$
for
 $T-d\leq t\leq T$
. where
 $\chi _{[0,T-d]}(t)$
denotes a characteristic function of the interval
 $[0,T-d]$
.
In Section 4, numerical results are presented using the above analytical sketch and the discretization method in Goellmann and Maurer (Reference Goellmann and Maurer2014). Hereby, we use the AMPL algorithm to find the solution paths as shown in Section 4.
Appendix D: Johansen test and Impulse-Response functions
D.1 A Johansen’s test of the co-integration rank gives the following result:
These results show that the rank of the I(0) space is two, implying there are no co-integration relations among the six I(1) variables. As our system contains eight variables and has only 81 data points, the Johansen test tends to underestimate the co-integration rank. To address this issue, we estimate a system containing only six I(1) variables. The Johansen test result is given in the following Table.
We conclude that there are two co-integration relationships among the six I(1) variables and two I(0) variables. The output of estimated
 $\hat {\beta }$
from Johansen’s procedure is shown in the first four columns of Tables C1, C2, and C3.
The first two columns of
 $\hat {\beta }$
are two independent co-integration relations. They are linear combinations of the first six I(1) variables in the system. The second two columns in
 $\hat {\beta }$
are the linear combinations of the two I(0) variables. Since they are linear combinations of I(0), there are co-integration relations by definition.
Test of co-integration rank in mixed VECM with six I(1) and two I(0) variables

Test of co-integration rank in with 6 I(1) variables VECM

Estimated and identified co-integration vectors

D.2 Impulse-response functions
We report the set of impulse-response functions that each shock triggers for other variables. Each CB’s operational instrument for climate policies and/or other macro shocks have an impact on other variables, generating macroeconomic imbalances. Each shock is triggering impulses on the CO2 emissions, and has side effects on other variables (and thus also on CBs targets and objectives). As Allen et al. (Reference Allen, Mathieu Boullot, D?es, de Gaye, Lisack, Thubin and Wegner2023) argue, macroeconomic imbalances and disruptions dynamically generated by transition efforts to a low carbon economy will require CB actions.
The below Figures C1 to C7 present the impacts of positive shocks on the price level, output, interest rate, risk premium, loans, financial stress and capacity utilization. As as shown in the Figures above, shocks to non-stationary variables have permanent, or level effects, and show mean reversion when stationary variables are affected. On the other hand, shocks to stationary variables are only mean reverting when they are not strongly correlated with non-stationary variables.
p shock and impulse-responses.

y shock and impulse-responses.

r shock and impulse-responses.

R shock and impulse-responses.

Loan shock and impulse-responses.

Fsi shock and impulse-responses.

V_c shock and impulse-responses.

Appendix E: CBs’ climate considerations and actionsFootnote 35
CB mandates are commonly associated with inflation control, employment, and financial stability. Taylor (Reference Taylor1993) summarized conventional policy prescription in a straightforward policy rule known as the Taylor Rule.Footnote 36 However, if CBs still do not properly assess the long-term climate risks of holding carbon-intensive assets,Footnote 37 financial markets might face a “climate Minsky-moment” or a “tragedy of horizon,” as defined by Carney (Reference Carney2015). Investors will incur financial losses associated with climate transition and physical risks (TCFD, 2017; Brunnermeier and Landau, Reference Brunnermeier and Landau2021).Footnote 38
Even if one is skeptical about including climate risks in CB mandates, as we have explored in Section 5, some CBs have already added sustainability initiatives to their agendas. These agendas are feasible operational tools of CBs, even based on their conventional mandates.Footnote 39 For example, CBs can include environmental criteria in macroprudential measures as a financial market regulator to ensure financial stability.Footnote 40 CBs can also include climate variables and operational tools in their macroeconomic models to ensure price stability, as climate change will lead to supply and price shocks that impact inflation targeting (Coeure, Reference Coeure2018; McKibbin et al. Reference McKibbin, Morris, Panton and Wilcoxen2017). CBs also need to be aware that climate risks can change both the growth rate of potential output, and the natural rate as an anchor for the interest rate as set by monetary authorities (Brainard, Reference Brainard2019). Even output gap targets can also be affected by climate change: in the US, harsh winters are associated with lower activity, while estimations show that extreme heat can decrease productivity and labor supply (Batten et al. Reference Batten, Sowerbutts and Tanaka2016; Coeure, Reference Coeure2018).
The NGFS and TCFD are important initiatives to operationalize the implementation of measures and tools to better manage climate risks. The NGFS has 88 CBs as members and half of them report that their countries have already experienced negative impacts due to climate change.Footnote 41 The TCFD provides climate-related financial disclosure recommendations to support risk management and capital allocation.Footnote 42 CBs’ guidelines and recommendations often refer to the TCFD standards which help the harmonization of practices and the increase of disclosure initiatives. Currently, CBs such as the ECB, the Brazilian Central Bank, the Bank of England and the Hong Kong Monetary Authority use operational tools. These operational tools include disclosure initiatives, such as: (i) GHG inventory requirement; (ii) guidelines for integrated sustainability reports; and (iii) report of portfolio climate risks.Footnote 43
However, increasing disclosure does not necessarily mean that climate risks are managed properly, nor that they are integrated into monetary and financial policy or regulation. Integrating climate objectives with the CB’s decisions demands a revision of existing policy tools and target rules. In March 2021, the Bank of England explicitly announced a climate mandate—see Bailey (Reference Bailey2021)—while the ECB did not support climate policy priorities as a mandate (Dikau and Volz, Reference Dikau and Volz2020). The experience shows though that CBs are adjusting regulations, as well as financial and monetary policy instruments to better deal with climate change, regardless of explicit mandates.
The most advanced CBs have focused their efforts on using financial policy and banking regulation as instruments to ensuring financial stability, and a smooth climate transition. For example, CBs have promoted the integration of climate scenarios and stress tests in financial market practices in several countries. In 2016, France implemented a law requiring institutional investors to report their climate-related exposure and ongoing mitigation policy. The Bank of England, in 2020, announced that climate risk assessments will be mandatory for banks and insurers (Bailey, Reference Bailey2021). At the same time, the Banque de France and the Bank of England have published, in 2021, new climate stress test methodologies.
More CBs are also implementing green monetary policy instruments. A green monetary policy should favor green credit flows instead of those associated with fossil fuels. An important operational instrument and climate tool is a negative screening to divest carbon-intensive assets, or a best-in-class approach to investing in green securities. The Bank of Korea, for example, does not hold low ESG rating securities in its portfolio, while the Banque de France divested assets with large emissions contributions. Furthermore, CBs can also use collateral frameworks and credit allocation criteria to increase green credit flows. In India and Bangladesh, banks must lend a minimum share of their loans to climate projects. In China and the EU, green bonds will be allowed as collateral for the CBs’ lending facility operations.
In addition to these initiatives and operational tools, experts have stressed the need for improving UMP by greening CB asset purchases and portfolios (De Grauwe, Reference De Grauwe2019; Breitenfellner et al. Reference Breitenfellner, Pointner and Schuberth2019; Robins et al. Reference Robins, Dikau and Volz2021). CBs are increasingly adapting their operational instruments to address climate financial risks and benefit green credit flows, but there is not enough evidence that large-scale asset purchase programs have taken into account climate concerns.