INTRODUCTION
Human activities, such as land clearing for settlement, agricultural land expansion, timber harvesting and fuelwood collection, are responsible for deforestation and forest degradation. Human activities have altered approximately one-third to one-half of the Earth's land surface (Vitousek et al. Reference Vitousek, Mooney, Lubchenco and Melillo1997). The declaration of protected areas (PAs) is a major conservation measure designed to reduce deforestation (Andam et al. Reference Andam, Ferraro, Pfaff, Sanchez-Azofeifa and Robalino2008). Evaluation of the status of PAs over time is essential to understand whether they are effective in meeting their conservation goals.
The combined use of remote sensing and geographic information systems (GIS) can provide essential information about land cover changes in and around PAs (Liu et al. Reference Liu, Linderman, Quyang, An, Yang and Zhang2001; Vasconcelos et al. Reference Vasconcelos, Biai, Araujo and Diniz2002; Curran et al. Reference Curran, Trigg, McDonald, Astiani, Hardiono, Siregar, Caniago and Kasischke2004; Giririag et al. Reference Giriraj, Babar and Reddy2008; Sarma et al. Reference Sarma, Lahkar, Ghosh, Rabha, Das, Nath, Dey and Brahma2008). Two main approaches have been applied: spatial analysis, comparing land cover changes over time within and outside the protected area; and temporal analysis, comparing the rates of land cover changes before and after PA establishment (Liu et al. Reference Liu, Linderman, Quyang, An, Yang and Zhang2001; Curran et al. Reference Curran, Trigg, McDonald, Astiani, Hardiono, Siregar, Caniago and Kasischke2004; Gaveau et al. 2007; Nagendra Reference Nagendra2008; Phua et al. Reference Phua, Tsuyuki, Furuya and Lee2008). Spatial data have often led to optimism about PA effectiveness (Nangedra et al. Reference Nagendra, Tucker and Carlson2004; Mas Reference Mas2005; Nagendra et al. Reference Nagendra, Pareeth and Ghate2006), yet the environmental conditions should be comparable between the PA and the areas outside if potential biases linked to environmental differences are to be avoided. Studies have used the buffer zones that are comparable in physical variables such as elevation and slope between the PA and areas outside. However, these evaluations of the effectiveness of PAs have mainly focused on deforestation, namely the conversion of forest to non-forest, and have ignored the quality of forest within the PA. Using deforestation as the only key indicator may overestimate or under-estimate PA effectiveness. Deforestation refers to the transition from forest to non-forest, and forest covers a broad range of forest qualities, such as canopy cover of at least 10% (Nagendra et al. Reference Nagendra, Pareeth and Ghate2006; Giriraj et al. Reference Giriraj, Babar and Reddy2008). In reality, there are also transitions within the broad definition of forest, such as from dense forest to open forest and vice versa. Forest degradation (i.e. the reduction in the quality of forest) within PAs is closely related to the decline in various attributes such as tree density, structure and species composition. Reductions in these attributes lead to the loss of habitat for wildlife, which is a common PA conservation target (Liu et al. Reference Liu, Linderman, Quyang, An, Yang and Zhang2001). Thus, forest degradation should also be examined when the effectiveness of the PA is evaluated. To our knowledge, however, there has been no study evaluating the effectiveness of a PA in relation to forest degradation by use of remote sensing data.
Myanmar has one of the highest proportions of forest cover in mainland South East Asia (49% of the total land area; FAO [Food and Agriculture Organization of the United Nations] 2005). The forests of Myanmar range from mangrove to alpine (Leimgruber et al. Reference Leimgruber, Kelly, Steininger, Brunner, Muller and Songer2005), and Myanmar has one of the greatest biodiversities in the Indo-Pacific region (Myers et al. Reference Myers, Mittermeier, Mittermeier, Fonseca and Kent2000). However, biodiversity in Myanmar has been under severe pressure due to population growth accompanied by increased resource use, as well as the ever-increasing demand for resources from neighbouring countries (Aung et al. Reference Aung, Swe, Oo, Moe, Leimgruber, Allendorf, Duncan and Wemmer2004). PAs stand to play a crucial role in conserving the biodiversity of Myanmar (Allendorf et al. Reference Allendorf, Swe, Oo, Htut, Aung, Aung, Leimgruber and Wemmer2006). Although Myanmar has increased the number of PAs, and 7.3% of the country's total land area is now within PAs (NWCD [Nature and Wildlife Conservation Division] 2007), the effectiveness of these PAs is not well known. Research into Myanmar's PAs has tended to focus primarily on fauna (Rabinowitz et al. Reference Rabinowitz, Schaller and Uga1995; McShea et al. Reference McShea, Leimgruber, Aung, Monfort and Wemmer1999; Aung et al. Reference Aung, McShea, Htung, Than, Soe, Monfort and Wemmer2001), and those studies were inventories of habitat and presence/absence or abundances of wildlife, not explicitly indicating the effectiveness of the PAs. Very few studies in Myanmar have applied remote sensing and GIS to the evaluation of PA status (Renner et al. Reference Renner, Rappole, Leimgruber, Kelly, Shwe, Aung and Aung2007).
In this study, we examine deforestation and forest degradation in the areas within and surrounding Popa Mountain Park (PMP) in central Myanmar using both spatial and temporal analysis. PMP has the greatest number of staff per unit area of any of Myanmar's 42 PAs; it has 133 workers per 100 km2 compared to only seven workers per 100 km2 on average in Myanmar (Aung Reference Aung2007). The number of guards in PMP, excluding office workers from the total staff, is 95 persons per 100 km2, being much larger than the median value (1.7 persons per 100 km2) for 93 PAs in 22 tropical countries (Bruner et al. Reference Bruner, Gullison, Rice and da Fonseca2001). Thus, PMP could provide valuable insights to other PAs, since effectiveness of PAs strongly correlates with the density of guards (Bruner et al. Reference Bruner, Gullison, Rice and da Fonseca2001; Oestreicher et al. Reference Oestreicher, Benessaiah, Ruiz-Jaen, Sloan, Turner, Pelletier, Guay, Clark, Roche, Meiners and Potvin2009). We used three Landsat images covering a period of 16 years following the establishment of PMP. The objectives of this study were to quantify the forest area within and outside PMP, and to examine and compare the spatial and temporal changes in forest cover and forest degradation within the Park and outside it.
METHODS
Study area
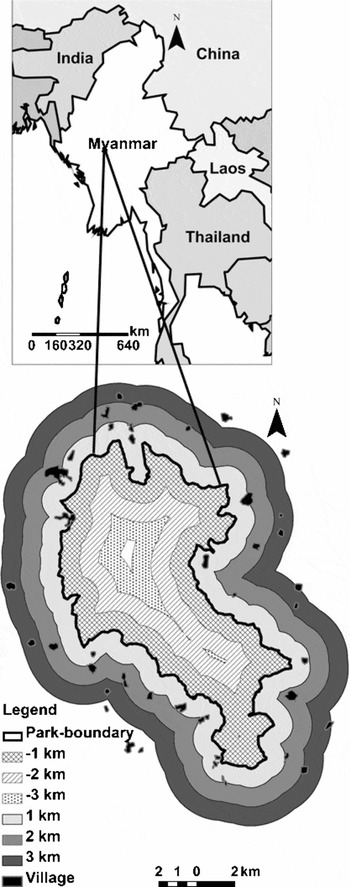
Popa Mountain Park (PMP) is centred on Mount Popa, the only prominent extinct volcano in central Myanmar (Fig. 1). The peak of Mount Popa is in the north of the Park and reaches about 1500 m above sea level. A range of small hills gradually declines in altitude for a distance of about 12 km to the south. These small hills are very broken and their peaks range from 450 to 600 m above sea level. The surrounding plains are about 300 m above sea level. Due to its comparative altitude, PMP has lower temperatures and higher rainfall than the rest of the central dry zone of Myanmar. The mean maximum and minimum monthly temperatures for the period 1994–2005 were 25.8°C and 15.6°C, and the mean annual rainfall for the same period was 1038 mm yr−1 (Popa Agricultural Office, unpublished data 2006).
Map of Popa Mountain Park and surrounding area, Central Myanmar. The areas within and outside the Park were divided into three consecutive buffer zones of 1-km width beyond the boundary in both directions. The innermost buffer zone was the –3 km area and the outermost buffer zone was the 3 km area.

The area was legally classed as a forest reserve in 1902. However, with the breakdown of law and order before and after the Second World War, villagers in the area surrounding the reserve gradually moved in and opened up large areas for cultivation. The Forest Department conducted extensive reforestation in the period 1955–1972, and removed illegal cultivators from the reserve. The vegetation gradually recovered in reclaimed areas and once-depleted natural springs were restored. Popa reserve was proposed as a PA by the Nature Conservation National Park Project (NCNPP) conducted between 1981 and 1984; PMP was subsequently declared in 1989. The Park covers an area of c. 100 km2. To provide better protection for the forest within, and to regulate the local use of vegetation outside the boundary, an area of 103.6 km2 is to be established as a buffer zone surrounding the Park in 2010.
Forty-five villages are located on the plains surrounding the Park. The total population of these villages was about 50 900 in 2005 (PMP, unpublished data 2006). Agriculture is the most common livelihood, and the major agricultural practices on the eastern side are cultivation of bananas, fruits and other seasonal crops, whereas on the west side the main activities are rain-fed paddy, palm-sugar production, small-scale fisheries and seasonal crops. Collection of fuelwood, forest products, non-timber forest products and grazing are common human activities within the Park (Rao et al. Reference Rao, Rabinowitz and Khaing2002). A volcanic plug at the western foot of Mount Popa, locally called Taung-kalat, is a prominent landmark and famous religious site visited by several thousand people each year.
Data and image classification
Subsets of three Landsat images were used in this study. The images were captured at Path 133 and Row 46 at three different times: Landsat 5 TM, 16 January 1989; Landsat 7 ETM, 4 April 2000; and Landsat 7 ETM, 13 February 2005. The images were processed with ERDAS IMAGINE software (ERDAS IMAGINE 2005). Only images acquired in the dry season were selected to be comparable with regards to vegetation phenology. Subsets of the 1989 and 2000 images were rectified and co-registered to the 2005 image, which had already been georeferenced to the coordinates of the study area (WGS 84, UTM projection, Zone 46N). We conducted a field survey during December 2006 and January 2007 to collect reference data. During the field survey, we classified land cover into three classes: dense forest (canopy cover > 40%), open forest (canopy cover 10–40%) and non-forest (canopy cover < 10%), as defined by the national classification of Myanmar forests (FAO 2005). The non-forest area consisted of individual trees, shrub land, grassland, regeneration, non-vegetated areas, agriculture, water bodies and villages. A total of 278 reference sites were recorded, and these were further divided into training and validation data.
We used the supervised maximum likelihood classification method to interpret satellite images in ERDAS IMAGINE. Training areas were selected for land cover classes from the field data. Accuracies of the thematic land cover maps were examined using field validation data. The calculated accuracies for the 1989, 2000 and 2005 maps were 86.5%, 88.3% and 84.4%, respectively, and their corresponding kappa indices were 0.81, 0.83 and 0.79.
Spatial and temporal changes of forest cover and forest degradation within and surrounding PMP
Using ArcGIS software, we developed buffer zones at 1-km intervals from the Park boundary in both directions, i.e. inside of the Park and outside the Park boundary (Fig. 1).
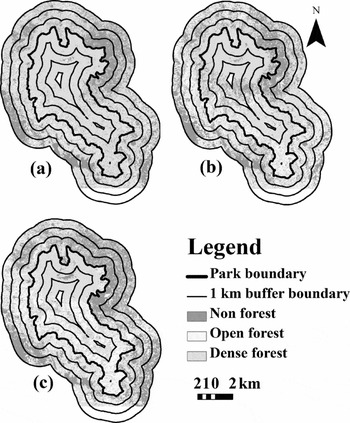
Adoption of the 3-km distance outside the Park was somewhat arbitrary, as there is no consensus on what constitutes the ‘surrounding area’ of PAs and this will vary (Phua et al. Reference Phua, Tsuyuki, Furuya and Lee2008). Mas (Reference Mas2005) claimed that comparing landscapes in and outside the PAs would generate potential biases in assessing the effectiveness of PAs because of the spatial heterogeneity between PAs and areas outside. Restricting the surrounding area to 3 km in our study reduced the topographic differences in landscapes between the PA and areas outside. In our study area, the landscape patterns, such as vegetation, terrain and altitude, were similar in areas close to the Park boundary. The application of three consecutive 1-km buffer zones therefore allowed for more consistent physical variables between the first kilometre of buffer zones in and outside the Park. The classified maps did not cover a small portion of the two outermost buffer rings to the south of the Park (Fig. 2). The omitted areas represented about 1% of the 2-km buffer and about 8% of the 3-km buffer. Based on field survey and unclassified Landsat images, we observed that the omitted areas did not differ from other areas included in the study. Therefore, we assumed that those omitted areas did not distort the overall results.
Land cover maps of Popa Mountain Park and the surrounding area in (a) 1989, (b) 2000 and (c) 2005. There was no data recorded for the blank area in the south of the area.

The post-classification method (Singh Reference Singh1989) was used to detect land cover change within and outside the Park over two periods, 1989–2000 and 2000–2005. We calculated the mean deforestation rate (per cent of the area per annum) in each 1-km buffer zone within and outside PMP for the two periods. We defined the term ‘deforestation’ as the net area that changed from forest area in one image to non-forest in the next image in the series. We similarly calculated mean annual forest degradation in each 1-km buffer zone, where we defined degradation as the net area that transited from dense forest to open forest between the two periods.
RESULTS
Land cover change
The land cover maps clearly indicate that dense forest decreased and open forest increased markedly in areas within and surrounding PMP between 1989 and 2005 (Fig. 2). Inside the Park, changes from dense forest to open forest mostly occurred in the southern part of PMP. Non-forest mostly increased in the north-east area outside the Park.
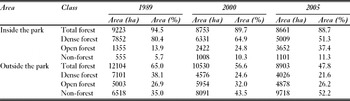
Approximately 80% of the total Park area was covered by dense forest in 1989, the year PMP was established (Table 1). Open forest accounted for 13.9%, while non-forest covered about 5.7% of the Park area. In 2000, dense forest had declined markedly to about 65%, whereas open forest and non-forest had both almost doubled, to 24.8% and 10.3%, respectively. In 2005, dense forest cover underwent a similar level of decline as in the first period, reaching approximately 51%. Open forest and non-forest areas had also increased further, markedly for open forest to about 37%, but only slightly for non-forest to about 11%.
Area and per cent of land cover classes within Popa Mountain Park and an area extending 3 km outside the Park boundary during 1989–2005.

In the area surrounding PMP, dense forest accounted for about 38% in 1989, decreased to about 25% in 2000, and decreased further to 22% in 2005 (Table 1). Open forest occupied approximately 27% of the landscape surrounding PMP in 1989, increased to c. 32% in 2000, then declined to 26% by 2005. The area of non-forest in the area surrounding PMP increased dramatically over the whole period, from about 35% in 1989 to about 43% in 2000, and 52% in 2005.
Deforestation
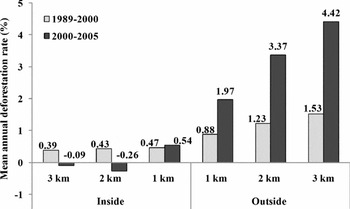
Inside PMP, the deforestation rate was greatest within the first 1-km of the Park boundary during 1989–2000, and was lower towards the inside of the Park (Fig. 3). In 2000–2005, the deforestation rate increased slightly within the first 1-km of the Park boundary, whereas the forest area actually increased in the two more interior zones.
Mean annual deforestation rates within and outside Popa Mountain Park in 1989–2000 and 2000–2005. The areas inside and outside the Park boundary line were divided into three consecutive buffer zones of 1-km width beyond the boundary in both directions.

In the area surrounding PMP, the mean annual rate of deforestation consistently increased with time and distance from the Park boundary (Fig. 3). The deforestation rate increased markedly between 1989–2000 and 2000–2005. The deforestation rates outside the Park were much higher than those inside.
Forest degradation
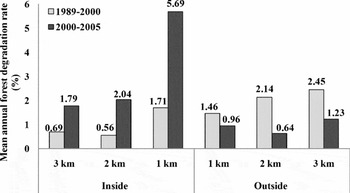
Inside the Park, the mean annual forest degradation rate was highest in the first 1-km buffer zone from the boundary in both 1989–2000 and 2000–2005 (Fig. 4). The forest degradation rate increased dramatically inside the Park in all spatial zones in 2000–2005. In the area surrounding PMP, forest degradation rates increased with distance from the Park boundary during 1989–2000 (Fig. 4). During 2000–2005, the mean annual forest degradation rates were considerably lower outside the PMP compared with 1989–2000. Comparing the areas outside and inside the Park, outside experienced the greater forest degradation in the first period, whereas the area within the Park experienced more degradation than the area outside in 200–2005.
Mean annual forest degradation rates within and outside Popa Mountain Park in 1989–2000 and 2000–2005. The areas inside and outside the Park boundary line were divided into three consecutive buffer zones of 1-km width beyond the boundary in both directions.

DISCUSSION
The supervised image classification using multi-temporal Landsat data together with GIS revealed changes in forest cover in and surrounding PMP, mostly involving loss of cover or degradation in the density of cover. The area of dense forest decreased whereas non-forested area increased in both 1989–2000 and 2000–2005. The rates of forest loss outside the Park were unsurprisingly much higher than those inside the Park. The Park is surrounded by 45 villages, and the impacts on the forest resulting from their presence are much greater outside the Park than within, where no villages exist. This result is consistent with the findings of other studies (Nangedra et al. Reference Nagendra, Tucker and Carlson2004; Mas Reference Mas2005; Nagendra Reference Nagendra2008; Phua et al. Reference Phua, Tsuyuki, Furuya and Lee2008). Clearly, the PA status promotes better forest conservation than is achieved outside the PA. However, calculated annual rates of deforestation in the first 1-km buffer zone inside the PMP (0.47% per year during 1989–2000 and 0.54% per year 2000–2005) considerably exceeded the rates reported in similar studies (for example 0.3% per year during 1993–2000 in Mexican PAs, Mas Reference Mas2005; 0.1% per year during 1991–1996 in Kinabalu Park, Malaysia, Phua et al. Reference Phua, Tsuyuki, Furuya and Lee2008).
Importantly, the area of dense forest had decreased through conversion to open forest. Measuring forest loss alone would have therefore produced an overestimate of the conservation effectiveness of PMP. Forest degradation had been progressing inside PMP, and exceeded the degradation rate in the area immediately surrounding the Park. This declining cover density is associated with a decline in species composition and structure and thus habitat value. Reduced forest complexity degraded habitat and caused a decrease in the panda population in Wolong Nature Reserve, China (Liu et al. Reference Liu, Linderman, Quyang, An, Yang and Zhang2001). Similarly, other studies have reported decreasing wildlife population density due to habitat degradation (Morrogh-Bernard et al. Reference Morrogh-Bernard, Husson, Page and Rieley2003; Kideghesho et al. Reference Kideghesho, Nyahongo, Hassan, Tarimo and Mbije2006; Western et al. Reference Western, Russell and Cuthil2009).
The effectiveness of PMP could be better evaluated by comparing forest cover changes in the first 1-km buffer zones within and outside the Park boundary, because these two buffer areas have similar physical characteristics. The Park conveyed some conservation benefits, as deforestation only slightly increased, and forest degradation was largely confined to the 1-km buffer zone inside the Park boundary. However, deforestation more than doubled in the first 1-km buffer zone outside the Park boundary. The area outside the Park is beyond the law enforcement power of PMP, and thus forest clearance had been more severe immediately outside the Park. As this forest area had been converted to non-forest land, the availability of forest resources decreased immediately outside the Park, increasing local dependence on the forest resources of PMP. Thus, forest degradation largely arose in the first 1-km inside the Park.
Decreasing forest cover in the tropics is attributable to many factors. Curran et al. (Reference Curran, Trigg, McDonald, Astiani, Hardiono, Siregar, Caniago and Kasischke2004) reported that commercial logging was the main cause of deforestation in Borneo's PAs, whereas, in other places, infrastructure developments have been observed to be major causes of deforestation (Geist & Lambin Reference Geist and Lambin2002). In our study area, there is no commercial logging and infrastructure development is rare; forest resource use and expansion of agricultural land are the main causes of forest cover change (Rao et al. Reference Rao, Rabinowitz and Khaing2002). The total population surrounding PMP increased from 36 761 in 1990 to 50 919 in 2005 (PMP, unpublished data 2006). This increased population caused an increase in timber extraction, grazing, fuelwood collection and use of other forest products, and the combined effect of these activities impacted on the forest in and surrounding PMP.
Leimgruber et al. (Reference Leimgruber, Kelly, Steininger, Brunner, Muller and Songer2005) reported that expansion of agriculture and increased fuelwood consumption are the major factors driving forest cover change in Myanmar. Agricultural encroachment has also been cited as a major driver of deforestation in other places around the world (Vasconcelos et al. Reference Vasconcelos, Biai, Araujo and Diniz2002; Gaveau et al. 2007). Our observations suggest that this is also the case in the area surrounding PMP. Indeed, forested area was rarely directly converted to cultivated land in the study area; disturbance of a forest area would commence through harvesting of wood for fuel and other products. This deteriorated forest would become subsequently become a degraded area and bush/shrub land before finally being converted into cultivated land.
Fuelwood use is a major driver of forest depletion in many tropical forests around the world (Lugo Reference Lugo, Brown, Lugo and Liegel1980; Wadsworth Reference Wadsworth and Golley1983). However, fuelwood is still the only cheap and accessible energy source for people living in rural areas of Myanmar. The people living around PMP also consume wood as their major energy source and few alternatives (such as agricultural by-products) exist. The Park authorities are aware that local people use the Park's resources, and thus encourage locals to plant trees on their homestead or farm boundary to fulfil their resource needs. However, lack of sufficient materials and technical support means such encouragement to plant trees has generally failed.
Patrols are the main method used by the PMP to enforce conservation, but insufficient finance means these are limited. Bruner et al. (Reference Bruner, Gullison, Rice and da Fonseca2001) claimed that park effectiveness was strongly correlated with guard density, but although the PMP has a large number of field staff, the forest still became degraded. This may be because the budget for conservation activities, such as patrolling or monitoring, is relatively low. In the 2007–2008 fiscal year, the government allocated c. US$ 115 000 to PMP. Staff salaries consumed 83% of this budget, and the majority of the remainder was used for administration and maintenance rather than conservation activities. Poor infrastructures (such as a lack of camp facilities, vehicles, motorbikes or bicycles) may also cause difficulties for conservation activities. Adequate funding is important for PA biodiversity conservation (James et al. Reference James, Gaston and Balmford2001; Oestreicher et al. Reference Oestreicher, Benessaiah, Ruiz-Jaen, Sloan, Turner, Pelletier, Guay, Clark, Roche, Meiners and Potvin2009)
CONCLUSIONS AND RECOMMENDATIONS
This study showed that although PMP performed better than its surrounding landscape in reducing deforestation, forest degradation has been accelerating within the Park and is continuing at rates even greater than in surrounding areas. This finding suggests that the effectiveness of PAs may be overestimated when only deforestation is employed as the indicator of conservation effectiveness; it is essential to also examine the habitat quality of forest areas. Unless PA management authorities are conscious of and intervene to prevent such subtle changes in habitat quality, the original conservation objective of PA establishment will eventually be subverted.
Reforestation through enrichment planting and natural regeneration should be conducted in degraded areas of forest before they are completely converted to agricultural land use. Demarcation of a buffer zone around the PA is vital to exert proper control of activities in order to avoid further deforestation of the remaining fragmented forests outside the PA. If the forest outside the Park is totally cleared, the pressure on local communities to access PMP forest will increase. Providing alternative energy sources, such as establishing village-owned fuelwood plantations, and providing fuelwood substitutes and fuelwood efficient stoves to the surrounding population can reduce pressure on the remaining forest; conservation measures within the Park must be enhanced by more patrols, while such remedial measures for deforestation and forest degradation are conducted outside the Park. External donations from conservation organizations are urgently required, as the state has relatively low funding available for conservation activities.
PAs are an important tool for conservation, especially as the international community considers reducing emissions from deforestation and forest degradation to be vital in combating climate change (Oestreicher et al. Reference Oestreicher, Benessaiah, Ruiz-Jaen, Sloan, Turner, Pelletier, Guay, Clark, Roche, Meiners and Potvin2009). Properly evaluating PA effectiveness is crucial to measuring and implementing successful conservation methods. We evaluated PA effectiveness for conservation using a single PA. A larger-scale study including a number PAs at regional or country level and considering further drivers of deforestation and forest degradation is now necessary in order to provide more information to support sustainable PA management.
ACKNOWLEDGEMENTS
We thank the Forest Department of Myanmar for providing satellite images and assistance with logistical matters. We also thank the staff of Popa Mountain Park for assistance during the field visit and two anonymous reviewers for useful comments that improved this paper.