INTRODUCTION
Peatlands are a significant component of the global carbon cycle and provide important archives of terrestrial environmental change. They currently store around one-third of the soil carbon pool under anoxic conditions that inhibit the decomposition of plant biomass (Gorham, Reference Gorham1991; Yu et al., Reference Yu, Loisel, Brosseau, Beilman and Hunt2010; Nichols and Peteet, Reference Nichols and Peteet2019). Thus, the development of boreal peatlands following the retreat of the Fennoscandian and Laurentide Ice Sheets had a net cooling effect over the Holocene owing to slow but persistent carbon drawdown (Frolking and Roulet, Reference Frolking and Roulet2007). However, whether peatlands will remain an active sink towards the end of the century is debated (Gallego-Sala et al., Reference Gallego-Sala, Charman, Brewer, Page, Prentice, Friedlingstein and Moreton2018; Loisel et al., Reference Loisel, Gallego-Sala, Amesbury, Magnan, Anshari, Beilman and Benavides2021). Climate is a fundamental control on long-term peat carbon accumulation rates (CARs). Warmer temperatures can cause increased CARs owing to enhanced net primary productivity, provided that the water table remains sufficiently high to slow decomposition (Ise et al., Reference Ise, Dunn, Wofsy and Moorcroft2008). Increased precipitation can promote higher CARs in peatlands by supporting high water table positions. But when moisture availability is not the limiting factor of peat growth, changes in CARs due to moisture changes are likely secondary in importance to the effects of temperature (Charman et al., Reference Charman, Beilman, Blaauw, Booth, Brewer, Chambers and Christen2013; Gallego-Sala et al., Reference Gallego-Sala, Charman, Brewer, Page, Prentice, Friedlingstein and Moreton2018; Morris et al., Reference Morris, Swindles, Valdes, Ivanovic, Gregoire, Smith, Tarasov, Haywood and Bacon2018). While climate remains a fundamental control when considered in syntheses of many sites over large spatial scales (Gallego-Sala et al., Reference Gallego-Sala, Charman, Brewer, Page, Prentice, Friedlingstein and Moreton2018; Morris et al., Reference Morris, Swindles, Valdes, Ivanovic, Gregoire, Smith, Tarasov, Haywood and Bacon2018; Nichols and Peteet, Reference Nichols and Peteet2019), landscape position, hydrology, and vegetation dynamics at the local scale significantly influence below-ground carbon densities and CARs (Packalen et al., Reference Packalen, Finkelstein and McLaughlin2016). Preserving the capacity of peatlands to take up carbon is an emerging management concern, and understanding the roles of hydrological and ecological factors in promoting the most effective carbon burial is critical for land use planning, especially under the warmer and often drier climates that northern peatland regions are experiencing due to anthropogenic climate change (McLaughlin et al., Reference McLaughlin, Packalen and Shrestha2018).
Paleoecological records document long-term changes in the composition of vegetation communities forming peat deposits. These changes include rich to poor fen and fen to bog transitions, both of which can occur owing to autogenic plant succession, as peat accumulates and the surface becomes isolated from the water table, or to external drivers impacting effective moisture or nutrient availability at the peatland surface (Loisel and Bunsen, Reference Loisel and Bunsen2020). Fen to bog transitions are associated with an increase in Sphagnum vegetation and/or other bog indicators and a decrease in pH and nutrient status, which together influence organic matter quality, peat type, and carbon dynamics, including methane emissions (Loisel et al., Reference Loisel, Yu, Beilman, Camill, Alm, Amesbury and Anderson2014). Here, we investigate the timing and potential drivers of rich to poor fen and fen to bog transitions and their impacts on apparent CARs at a boreal bog site in the southern Hudson Bay Lowlands (HBL) of northern Ontario, Canada.
The HBL region of Canada is one of the world's largest continuous peatlands (Riley, Reference Riley2011), with a current peat carbon pool of ~30 Pg C (Packalen et al., Reference Packalen, Finkelstein and McLaughlin2014). Rapid rates of glacial isostatic adjustment since the retreat of the Laurentide Ice Sheet during the early to mid Holocene resulted in an uplift chronosequence of new surfaces available for peatland initiation (Andrews and Peltier, Reference Andrews, Peltier and Fulton1989). Therefore, the initiation and subsequent hydrology of all HBL peatlands are highly influenced by isostacy (Glaser et al., Reference Glaser, Hansen, Siegel, Reeve and Morin2004), with fens dominating the coast on more recently emerged substrates and Sphagnum bogs more abundant inland on older surfaces (Holmquist and MacDonald, Reference Holmquist and MacDonald2014). Furthermore, Morris et al. (Reference Morris, Swindles, Valdes, Ivanovic, Gregoire, Smith, Tarasov, Haywood and Bacon2018) used modelled data to estimate the mid Holocene paleoclimate in the HBL and inferred a key role for the temperature driving peat initiation. There is thus a complex feedback system specific to this region, whereby the initiation of peatlands in the HBL and the subsequent trajectories of peat and carbon accumulation are tied to hydrological changes caused by both climate and regional uplift (Packalen and Finkelstein, Reference Packalen and Finkelstein2014; Packalen et al., Reference Packalen, Finkelstein and McLaughlin2016; Morris et al., Reference Morris, Swindles, Valdes, Ivanovic, Gregoire, Smith, Tarasov, Haywood and Bacon2018).
Paleoecological records from HBL peat cores confirm that autogenic succession, climate, hydrology, and regional uplift have all played a role in vegetation dynamics and peat carbon accumulation throughout the Holocene (Bunbury et al., Reference Bunbury, Finkelstein and Bollmann2012; O'Reilly et al., Reference O'Reilly, Finkelstein and Bunbury2014; Bysouth and Finkelstein, Reference Bysouth and Finkelstein2020). Because of the proximity of the decaying Laurentide Ice Sheet, orbitally controlled temperature maxima were delayed in the HBL region into the mid Holocene (7—5 ka; Glaser et al., Reference Glaser, Hansen, Siegel, Reeve and Morin2004; Viau and Gajewski, Reference Viau and Gajewski2009) compared with other boreal regions (~11–9 ka; Renssen et al., Reference Renssen, Seppä, Heiri, Roche, Goosse and Fichefet2009; Yu et al., Reference Yu, Loisel, Brosseau, Beilman and Hunt2010). Warmer temperatures during the regional Holocene thermal maximum (HTM) are associated with higher apparent peat CARs at some sites in the HBL and adjacent regions (van Bellen et al., Reference van Bellen, Dallaire, Garneau and Bergeron2011a; Bunbury et al., Reference Bunbury, Finkelstein and Bollmann2012; Holmquist and MacDonald, Reference Holmquist and MacDonald2014; O'Reilly et al., Reference O'Reilly, Finkelstein and Bunbury2014; Packalen and Finkelstein, Reference Packalen and Finkelstein2014; Packalen et al., Reference Packalen, Finkelstein and McLaughlin2014, 2016; Bysouth and Finkelstein, Reference Bysouth and Finkelstein2020). However, these high CARs are often associated with early successional stages of peat (typically fens), and there is not always a clear increase in CARs with warmer temperatures, suggesting that peatland vegetation dynamics and local hydrology also play a role in long-term carbon dynamics in these areas (van Bellen et al., Reference van Bellen, Dallaire, Garneau and Bergeron2011a; Bunbury et al., Reference Bunbury, Finkelstein and Bollmann2012; Packalen and Finkelstein, Reference Packalen and Finkelstein2014; Bysouth and Finkelstein, Reference Bysouth and Finkelstein2020).
Neoglacial cooling over the last four millennia (Viau and Gajewski, Reference Viau and Gajewski2009; Hargan et al., Reference Hargan, Finkelstein, Rühland, Packalen, Dalton, Paterson, Keller and Smol2020) is generally associated with lower rates of peatland initiation and lower apparent CARs in some HBL peat records (Kettles et al., Reference Kettles, Garneau and Jetté2000; Bunbury et al., Reference Bunbury, Finkelstein and Bollmann2012; O'Reilly et al., Reference O'Reilly, Finkelstein and Bunbury2014; Packalen and Finkelstein, Reference Packalen and Finkelstein2014; Bysouth and Finkelstein, Reference Bysouth and Finkelstein2020). In several records, the slowdown in peat CARs is associated with a shift from fen to bog conditions after 2500 cal yr BP. However, there is significant variability in the timing of this transition (Bunbury et al., Reference Bunbury, Finkelstein and Bollmann2012; Holmquist and MacDonald, Reference Holmquist and MacDonald2014; Bysouth and Finkelstein, Reference Bysouth and Finkelstein2020). Thus, ecohydrological processes must be considered in addition to regional climate to determine the drivers of this change (Loisel and Garneau, Reference Loisel and Garneau2010; Bunbury et al., Reference Bunbury, Finkelstein and Bollmann2012). This is particularly relevant in the HBL because of the dynamic landscape resulting from ongoing isostatic uplift (Glaser et al., Reference Glaser, Hansen, Siegel, Reeve and Morin2004). Further, the HBL is characterised by a mosaic of peatland types in close proximity that have considerable variability in carbon densities (Packalen et al., Reference Packalen, Finkelstein and McLaughlin2016), suggesting that factors other than climate are needed to complete our understanding of carbon dynamics in this region. However, the density of available peat core data on paleovegetation and CARs remains low relative to the size of the HBL.
Ecohydrological conditions in peatlands can be reconstructed using a variety of proxies, including pollen and non-pollen palynomorphs, plant macrofossils, lipid biomarkers, and testate amoebae. A multiproxy approach is effective, as it allows for the comparison of independent environmental records that each have limitations (Blundell and Barber, Reference Blundell and Barber2005). Here, we integrated testate amoebae, plant macrofossils, and pollen to identify transitions in peatland type and relate these transitions to changing rates of peat vertical accretion and carbon accumulation. Further, we use bacterial branched glycerol dialkyl glycerol tetraethers (brGDGTs) and peat-specific calibrations to reconstruct local pH and temperature (Naafs et al., Reference Naafs, Inglisab, Zheng, Amesbury, Biestere, Bindler and Blewett2017, 2019) and archaeal isoprenoidal glycerol dialkyl glycerol tetraethers (isoGDGTs) to explore changes in the archaeal community in relation to trends in CARs (Yang et al., Reference Yang, Xiao, Słowakiewicz, Ding, Ayari, Dang and Pei2019; Blewett et al., Reference Blewett, Naafs, Gallego-Sala and Pancost2020). Although br- and isoGDGTs have been used for more than a decade on mineral soils (Weijers et al., Reference Weijers, Schouten, van den Donker, Hopmans and Damste2007), their application to peat is relatively limited to date (e.g., Weijers et al., Reference Weijers, Steinmann, Hopmans, Schouten and Sinninghe Damsté2011; Zheng et al., Reference Zheng, Fang, Fan, Liu, Wang, Li, Pancost and Naafs2020). Therefore, our approach provides an independent verification of the reconstructions derived from membrane lipids in peat to better understand their interpretation in northern peatland regions.
Overall, this study uses these multiple proxies to (1) compare Holocene CARs before and after the transitions from rich to poor fen and from poor fen to bog in a record that is characterised by lower than average peat depths for the region; (2) determine how those shifts relate to water table depth (WTD; testate amoebae), pH (brGDGTs), vegetation (pollen and plant macrofossil), and regional climatic changes; and (3) evaluate the utility of brGDGT temperature reconstructions under changing environmental conditions.
METHODS
Study site and sampling
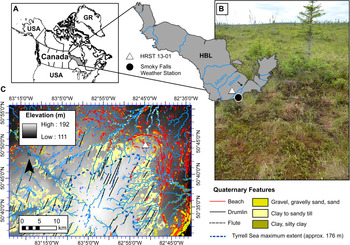
The study site (HRST 13-01; 50.7656°N; 82.7794°W; elevation ~168 m asl; Fig. 1) is located on the southern margin of the HBL ecozone of Canada (Ecological Stratification Working Group, 1995). The surrounding region is underlain by Paleozoic carbonates and Mesozoic sandstones and shales; immediately underlying the peat are near-shore marine sands, drumlins, and till deposits, which make up the interfluve terrain (Fig. 1; Norris, Reference Norris and Martini1986; Barnett et al., Reference Barnett, Yeung and McCallum2012; Bajc and Yeung, Reference Bajc and Yeung2017). The study site is located on a slight upland of the interfluve between the Albany and Moose River basins and is situated near the limit of an early Holocene marine incursion (i.e., the Tyrrell Sea; Fig. 1; Barnett et al., Reference Barnett, Yeung and McCallum2012; Bajc and Yeung, Reference Bajc and Yeung2017).
(color online) Map of study location in the Hudson Bay Lowlands (HBL), northern Ontario, Canada (A, C), and image of HRST 13-01 (B). The HBL outline is after the Canadian Hudson Plains ecozone from Ecological Stratification Working Group (1995); the Quaternary features are from Barnett et al. (Reference Barnett, Yeung and McCallum2012) and Bajc and Yeung (Reference Bajc and Yeung2017); the digital elevation model is from Government of Ontario (2020).

The HBL region has a humid microthermal Arctic climate (Martini, Reference Martini, Martini, Martínez Cortizas and Chesworth2006). The total annual precipitation at the closest weather station to the study site (Smoky Falls; Fig. 1) is 850 mm. The mean annual temperature is 0.7°C, with the highest daily average in July (17.6°C) and the lowest in January (-18.7°C). Average daily temperatures are below freezing for six months of the year (Government of Canada, 2020). The landscape across the HBL is mainly covered by coastal wetlands and interior peatlands, and organic-rich soils therefore predominate (>90% wetland coverage; Sims et al., Reference Sims, Riley and Jeglum1979; Riley, Reference Riley2003, Reference Riley2011). Boreal and subarctic forests and tundra are also found in the region (Riley, Reference Riley2003). Permafrost is mainly found along the coastal margin, with decreasing coverage southward and towards the interior (Riley, Reference Riley2003). The study site is presently a bog, with local vegetation predominantly consisting of Sphagnum spp., with Kalmia polifolia, Rhododendron groenlandicum, Vaccinium spp., Picea mariana, and occasional Larix and Cyperaceae. There is no permafrost in the vicinity.
Two complete peat core sequences, taken 30 cm apart, were collected in July 2013 using a 50-cm Russian peat corer (hereafter referred to as “Core 1” and “Core 2”). These were combined into a composite record with sufficient material for a multiproxy analysis. One 10 × 10 × 16 cm (length × width × depth) surface monolith was taken using a square shovel directly adjacent to the coring site to further supplement the uppermost portion of the record. The two sequences were 130 and 139 cm in length and had organic-inorganic contacts at the same depth (126 cm). The peat depth at the site was representative of the local site but is lower compared with a series of other bog sites in the HBL region (234 ± 56 cm; Packalen et al., Reference Packalen, Finkelstein and McLaughlin2016). The WTD was within 5 cm of the surface at the time of sampling; porewater conductivity and pH were measured at two points (58 and 64.3 μS; 3.6 and 3.8, respectively). Cores were stored at 4°C at the University of Toronto until analysis.
Chronology and peat properties
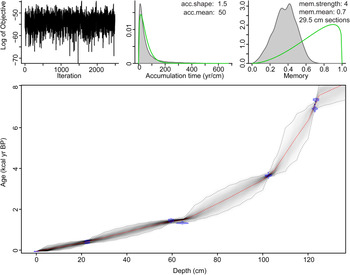
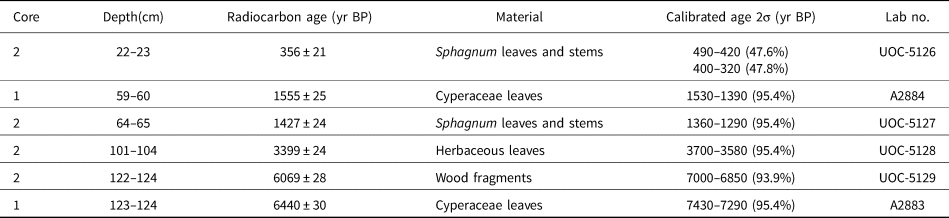
An age-depth model (Fig. 2) was developed with radiocarbon ages from both cores (Table 1) and the surface age (-63 cal yr BP) using rbacon for R (Bayesian age-depth modelling (Blaauw and Christen, Reference Blaauw and Christen2011). Calibration of conventional 14C ages to calendar (cal) years was performed using the IntCal13 calibration curve (Reimer et al., Reference Reimer, Bard, Bayliss, Beck, Blackwell, Bronk Ramsey and Buck2013). Individual age calibrations for each radiocarbon date in Table 1 were performed using OxCal version 4.3 (Bronk Ramsey, Reference Bronk Ramsey2009). Two radiocarbon ages were measured at the Illinois State Geological Survey (Champaign, Illinois, USA; Core 1), and four were measured at the Lalonde AMS Laboratory (Ottawa, Ontario, Canada; Core 2). Radiocarbon dates taken from similar depths in each of the cores were approximately coeval, thus dates were combined to create a composite chronology. For loss-on-ignition (LOI) analysis, peat samples of 5–15 cm3 (n = 31; continuous 4-cm sampling; Core 1) were dried at 95°C, ignited at 550°C for 4 h and at 950°C for 2 h to estimate organic matter and carbonate content (Heiri et al., Reference Heiri, Lotter and Lemcke2001). Ash-free bulk density (AFBD) was calculated as dry mass (g) divided by wet volume (cm3) and multiplied by the organic matter content (%). The apparent CAR was calculated using an estimated carbon content (50%) multiplied by AFBD (g cm-3) and the modelled accretion rate (cm/yr), after Chambers et al. (Reference Chambers, Beilman and Yu2010).
Output from rbacon of the Bayesian age-depth model for HRST 13-01, the HBL, northern Ontario, Canada (Blaauw and Christen, Reference Blaauw and Christen2011). The red dotted line is the weighted mean age for a given depth, and the gray region surrounding the curve represents the 95% confidence interval; acc. = accumulation; mem. = memory. (For interpretation of the references to color in this figure legend, the reader is referred to the web version of this article.)

AMS radiocarbon ages from HRST 13-01, the Hudson Bay Lowlands, northern Ontario, Canada.

Plant macrofossils were analysed from a selection of the >300-μm fractions of the testate amoebae and pollen samples (N = 26; Core 2) to determine peat composition. Samples were poured into gridded petri dishes and examined at 40× magnification on a stereomicroscope. Macrofossils were assigned to one of four major groups (Ericaceous roots and leaves, herbaceous plant fragments, Sphagnum stems and leaves, unidentifiable organic material (UOM)) in 12 randomly selected 1.5 × 1.5 cm quadrats; percent cover was estimated for each type (quadrat method; Mauquoy et al., Reference Mauquoy, Hughes and Van Geel2010). Rare macrofossils encountered in each sample (i.e., Carex seeds and Sphagnum capsule opercules) were recorded as present but not included in the percent cover estimates. Because of the variability and large number of pieces of UOM that could occur in samples, only pieces that occupied the majority (>50%) of a 0.15 × 0.15 cm square within the ocular grid were counted. Distinguishing major peat macrofossil groups was performed referencing Lévesque et al. (Reference Lévesque, Dinel and Larouche1988).
Testate amoeba and pollen analysis
Peat subsamples of 1–2 cm3 were taken every 2–5 cm (n = 50; Core 2 and monolith) for enumeration of testate amoebae and pollen. The sampling resolution was varied along the core with the aim to reach a temporal resolution of <250 years between samples. Further, additional samples were added in the upper portion to increase resolution where testate amoebae were well preserved (<100 years between samples). Samples were boiled for 10 min, sieved to retain the 15- to 300-μm fraction, and mounted in glycerol (Booth et al., Reference Booth, Lamentowicz and Charman2010). For samples with a low pollen concentration on the microscope slides (N = 27) and a significant mineral content (N = 3), additional treatments (10% HCl, 10% KOH, acetolysis, and HF if visible silicates) were performed to obtain sufficient pollen and spore counts. Lycopodium tablets (1 tablet/cm3; batch no. 3862, N = 9666) were added to each sample to estimate concentrations for determining counting thresholds.
For testate amoebae, a minimum of 150 tests was counted for samples with a concentration >5000 tests/cm3. If the concentration was <5000 tests/cm3, one slide was investigated, and any tests encountered were counted. For pollen, a minimum of 300 non-Sphagnum grains/spores was counted for samples with a concentration of >10,000 pollen/spores per cm3. If <10,000 pollen/spores per cm3, a minimum of 100 pollen/spores was counted, including at least 50 non-Sphagnum grains. Taxonomic identification of testate amoebae was performed by referencing Ogden and Hedley (Reference Ogden and Hedley1980), Booth (Reference Booth2008), and Charman et al. (Reference Charman, Hendon and Woodland2000). Taxonomic identification of pollen and spores was performed by referencing McAndrews et al. (Reference McAndrews, Berti and Norris1973). Select non-pollen palynomorphs (fungal and algal groups) were counted referencing van Geel (Reference van Geel1978), van Geel et al. (Reference van Geel, Bohncke and Dee1980), and Pals et al. (Reference Pals, Vangeel and Delfos1980). Counts were performed at 400× using a Zeiss Axio Imager A1 microscope. Zonation of the core was based on the pollen data and was performed using optimal splitting by information content and significance tested using the broken stick model (Bennett, Reference Bennett1996), using only taxa >1% of the assemblage. Zones for the testate amoebae and lipid biomarker datasets were also tested using the same method, and two subzones were added to the stratigraphy where there were significant shifts in these assemblages that were not identified in the pollen assemblages. We tested for stratigraphic congruence of the pollen and testate amoeba assemblages using Procrustes analysis on ordination sample scores (see Supplementary Materials and Supplementary Fig. S1).
The WTD was reconstructed using testate amoeba assemblages and a transfer function containing modern samples from the study region (see Supplementary Materials; Amesbury et al., Reference Amesbury, Booth, Roland, Bunbury, Clifford, Charman and Elliot2018). Taxonomic harmonisations included combining Trignopyxis arcula and T. minuta types and removing Lesquereusia modesta type (found at <1% and in only one sample) from the fossil data. Although Pyxidicula sp. A was important in the fossil assemblages (up to 30%), Pyxidicula species are inconspicuous and thus can be overlooked in testate amoeba counts (Ogden, Reference Ogden1987). Because they are not well represented in the modern dataset (Amesbury et al., Reference Amesbury, Booth, Roland, Bunbury, Clifford, Charman and Elliot2018), Pyxidicula sp. A was removed from the fossil dataset for the reconstruction. Reconstructed WTDs are plotted as z-scores, with higher values corresponding to drier relative conditions (see Supplementary Materials; Swindles et al., Reference Swindles, Holden, Raby, Turner, Blundell, Charman, Menberu and Kløve2015).
Lipid analysis
A total of 17 samples were taken every 5–12 cm for isoGDGT and brGDGT lipid analysis (Core 1). Each sampling interval spanned 2–5 cm and was dependent on peat availability. Samples were freeze-dried, and lipids were extracted as outlined in Naafs et al. (Reference Naafs, Inglisab, Zheng, Amesbury, Biestere, Bindler and Blewett2017). Approximately 1.0 g of bulk peat was microwave extracted in a 9:1 (v:v) mixture of dichloromethane (DCM) and methanol (MeOH). Samples were heated to 70°C over 10 min (1000 W) and held at this temperature for 10 min (1000 W) before a gradual 20-min cooling. They were then centrifuged for 3–5 min at 1700 rpm; the supernatant was collected, and an additional 10 ml of DCM:MeOH (9:1 v:v) was added to the remaining peat. This peat-solvent mixture was subsequently centrifuged as above, with this process repeated up to six times to maximise the yield of extractable lipids. The combined supernatants yielded a total lipid extract (TLE), which was concentrated using rota-evaporation. To remove particulates, a 25% aliquot of the TLE was passed through a 2-cm silica column using DCM:MeOH 9:1 (v:v). This aliquot was dried under a gentle flow of N2 and redissolved in hexane:iso-propanol (99:1 v:v) and filtered through a 0.45-μm PTFE filter.
Lipids were dissolved in 100 μl of hexane:iso-propanol (99:1 v:v) and analysed via high-performance liquid chromatography–atmospheric pressure chemical ionization–mass spectrometry (HPLC-APCI-MS) on a ThermoFisher Scientific Accela Quantum Access triplequadrupole mass spectrometer at the University of Bristol, United Kingdom. Following the established method of Hopmans et al. (Reference Hopmans, Schouten and Sinninghe Damsté2016), normal phase separation was achieved using two Acquity UPLC BEH HILIC columns (150 mm × 2.1 mm, 1.7 μm, Waters, Eschborn, Germany). The injection volume was 15 μl. In order to increase sensitivity and reproducibility, the mass spectrometer was operated in selective ion monitoring mode, scanning for the following ions: m/z 1302, 1300, 1298, 1296, 1294, 1292, 1050, 1048, 1046, 1036, 1034, 1032, 1022, 1020, 1018, 744, and 653. The resultant chromatograms were integrated manually using the Xcalibur software. Daily analyses of inhouse standards indicate that the instrumental error is <0.1 for the GDGT-based indices.
The distribution of brGDGTs was used to calculate three peat-specific indices for paleoenvironmental reconstruction: CBTpeat, IR6me, and MBT’5ME (Naafs et al., Reference Naafs, Inglisab, Zheng, Amesbury, Biestere, Bindler and Blewett2017). CBTpeat refers to the proportion of brGDGTs with cyclopentane moieties (i.e., b:1 and c:2 cyclopentane moieties) over those that contain none (a:0 cyclopentane moieties):

The peat-specific calibration (Naafs et al., Reference Naafs, Inglisab, Zheng, Amesbury, Biestere, Bindler and Blewett2017) was then used to quantify paleo-pH:

The IR6me ratio, which reflects the ratio between the 5- and 6-methyl brGDGTs (denoted with a ‘ symbol) was also used as a pH indicator in this study (De Jonge et al., Reference De Jonge, Hopmans, Zell, Kim, Schouten and Sinninghe Damsté2014):

The MBT’5ME index reflects the proportion of tetramethylated (I) to 5-methyl penta-(II) and hexamethylated (III) brGDGTs (De Jonge et al., Reference De Jonge, Hopmans, Zell, Kim, Schouten and Sinninghe Damsté2014):

The peat-specific calibration (Naafs et al., Reference Naafs, Inglisab, Zheng, Amesbury, Biestere, Bindler and Blewett2017) was used to reconstruct the mean annual air temperature (MAAT):

However, MAATpeat reconstructed using this index can be biased to summer temperatures in high-latitude peatlands (Naafs et al., Reference Naafs, Inglisab, Zheng, Amesbury, Biestere, Bindler and Blewett2017), and the magnitude of Holocene-scale temperature changes is generally within the 4.7°C error of the calibration (Naafs et al., Reference Naafs, Inglisab, Zheng, Amesbury, Biestere, Bindler and Blewett2017). Thus, we present this index in the context of a multiproxy study to explore its applicability in Holocene peat sequences from this region.
RESULTS
Chronology, peat properties, and carbon accumulation
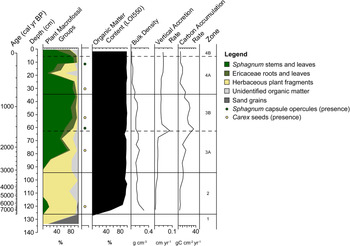
The basal sediments below the peat boundary consist of poorly sorted sands to clays. Larger pebbles are also found within the matrix. Grains are generally subangular to subrounded. Basal radiocarbon dating of the peat section indicates the onset of peat accumulation at ~7600 cal yr BP. The age-depth model returns a mean rate of vertical peat accretion of 0.02 cm/yr (Figs. 2 and 3), with very low rates (<0.007 cm/yr) between initiation and 3900 cal yr BP (105 cm). Vertical accretion increases between 3900 and 1500 cal yr BP (~0.01–0.02 cm/yr; 105–65 cm) and transitions to the highest rates (>0.03 cm/yr) in the upper samples dating from ~1500 cal yr BP to the present (Fig. 3).
(color online) Peat properties and plant macrofossils at HRST 13-01, the HBL, Ontario, Canada. Depth is the primary y-axis.

Bulk density (BD) is similar from peat initiation through to 40 cm (600 cal yr BP). BD then decreases after 40 cm because of the minimally decomposed Sphagnum in the uppermost portion of the record. Percent organic matter remained high after 121 cm (>90%; 6500 cal yr BP; Fig 3), and carbonates as estimated from LOI were <1% through the entire record. Upon peat initiation, the core is characterised by herbaceous peat until 95 cm (3100 cal yr BP), followed by a mixed Sphagnum-herbaceous peat until 63 cm (1500 cal yr BP). After 63 cm, the core is characterised by Sphagnum peat for the rest of the record (Fig. 3). Notable exceptions are the increased presence of Sphagnum stems and leaves within the herbaceous peat (125–115 cm) and the increase in herbaceous plant fragments within the Sphagnum peat interval (30–10 cm).
The mean apparent CAR for 31 peat samples in the HRST 13-01 record was 12 ± 9 g C/m2/yr (mean ± SD). From peat initiation to ~1500 cal yr BP (63 cm), CAR remains generally <15 g C/m2/yr. An increase in CAR to maximum values (up to 34 g C/m/2/yr) then occurs between 65 and 35 cm (1500–760 cal yr BP), driven by an increase in the rate of peat vertical accretion after 1500 cal yr BP. After 35 cm (760 cal yr BP), CAR decreases to the top of the core (<10 g C/m2/yr) with a decrease in peat bulk density.
Microfossil and geochemical proxies
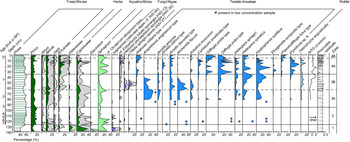
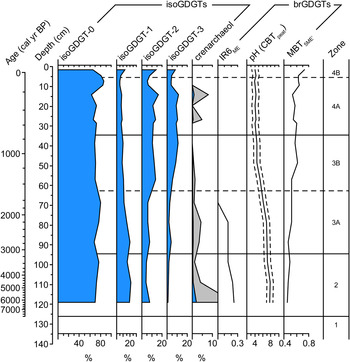
At HRST 13-01, 40 testate amoeba taxa, one rotifer taxon, and 35 pollen and spore taxa were identified (Fig. 4, Supplementary Figs. S2 and S3, Supplementary Table S1). Pollen and spores were well preserved and abundant throughout, while testate amoebae were absent for most of the lower portion of the record, apart from between 125 and 115 cm (7600–5600 cal yr BP), where they were found in conjunction with a small peak in Sphagnum macrofossils in a section otherwise dominated by herbaceous peat (Figs. 3 and 4). A consistent presence of testate amoebae occurs above 85 cm (2600 cal yr BP), corresponding to an increasing abundance of Sphagnum stems and leaves within the mixed Sphagnum-herbaceous peat interval (95–63 cm; 3100–1500 cal yr BP). The isoGDGT record is dominated by isoGDGT-0, which is common in peatland settings (Fig. 5; Sinninghe Damsté et al., Reference Sinninghe Damsté, Schouten, Hopmans, van Duin and Geenevasen2002; Naafs et al., Reference Naafs, Inglis, Blewett, McClymont, Laurentano, Xie, Evershed and Pancost2019; Blewett et al., Reference Blewett, Naafs, Gallego-Sala and Pancost2020). The pollen and testate amoeba records in Zones 3 and 4 are significantly congruent (Procrustes analysis; m122 = 0.8287; p = 0.018; see Supplementary Materials), signifying that the shifts in the pollen record are related to local environmental changes. The residuals of the sample scores from the Procrustes analysis ranged from 0.02 to 0.28, with the lowest values (<0.1; below the first quartile) occurring between 40 and 20 cm (Fig. 4 and Supplementary Fig. S1).
(color online) Pollen and spore, non-pollen palynomorph (NPP; fungi and algae), and testate amoeba assemblages from HRST 13-01, the HBL, northern Ontario, Canada. Taxa present in this diagram are >10% of their given assemblage. Depth is the primary y-axis. Gray exaggeration is 5×. WTD = water table depth. The pollen sum used to calculate the percentages includes all pollen and spore taxa minus Sphagnum spores. Sphagnum spore and NPP sums are the pollen sum plus the respective taxa included in each category. The testate amoeba (TA) sum includes all taxa minus the rotifer taxon. The rotifer sum was calculated like the Sphagnum and NPP sums, using the TA sum as the base. The gray dashed and solid lines in the Procrustes residuals indicate the first, median, and third quartile values from left to right. The samples that fell below the first quantile are highly congruent, suggesting that the pollen and testate amoeba records are responding to a similar local environmental driver (ombrotrophy). The Picea curve indicates sample depths, and the dashed lines represent the samples that had low pollen concentrations and therefore lower counts (see “Methods” for details). The numbers listed after the NPPs are the type numbers, after Miola (Reference Miola2012).

(color online) The relative abundance of isoprenoidal glycerol dialkyl glycerol tetraethers (isoGDGTs) and proxy ratios of branched (brGDGTs) (see “Methods” for details) at HRST 13-01, the HBL, northern Ontario, Canada. Depth is the primary y-axis. Gray exaggeration is 10×.

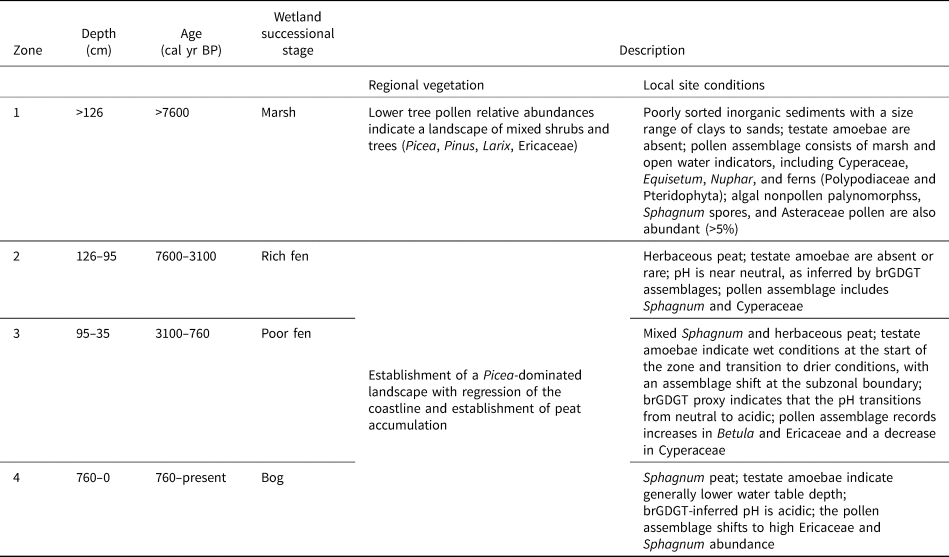
Four biostratigraphic zones were delineated based on the microfossil and geochemical analyses (Figs. 4 and 5, Table 2). Zone 1 (marsh) is contained below the peat boundary in inorganic sediments, with a high bulk density and low organic matter (>126 cm; Fig. 3). Testate amoebae are absent (Fig. 4). Pollen and spore assemblages are characterized by marsh taxa, including Cyperaceae, Chenopodiaceae, and Equisetum, and a mixed tree pollen assemblage of Picea, Pinus, and Larix (Fig. 4 and Supplementary Fig. S2). Asteraceae pollen is also abundant (>5%; Fig. 4) and could further indicate marsh conditions, as species such as Senecio congestus can dominate marshes in the modern coastal setting of the HBL, where marshes develop into fens between beach ridges (Riley Reference Riley2003, Reference Riley2011). The Sphagnum spore abundance is also relatively high (20%). Reticulate algae (cf. Closterium idiosporum zygospores [HdV-60]), ferns (Polypodiaceae and Pteridophyta), and Nuphar are also present in this interval (Fig. 4 and Supplementary Fig. S2).
Zonation summary for HRST-1301, the Hudson Bay Lowlands region, Ontario, Canada.

The onset of Zone 2 (126–95 cm; 7600–3100 cal yr BP; rich fen) corresponds to the establishment of a peat-forming wetland, with organic matter content >50% and the shift to herbaceous peat (Fig. 3). Pollen assemblages show an increase in regional tree pollen (Picea and Pinus) as marsh taxa decline. Sphagnum continues to have a relatively high abundance at the start of the zone but decreases after 115 cm (5600 cal yr BP). Ericaceae pollen also continues to be present in this zone (Fig. 4). Testate amoebae are absent other than in a short interval corresponding to increased Sphagnum in the macrofossil record (~125–115 cm), where they were found at low concentrations (<5000 tests cm-3; Fig. 4 and Supplementary Fig. S2). The brGDGT ratios (CBTpeat and IR6me) indicate a near neutral pH. Crenarchaeol is also present in low amounts (Fig. 5).
Zone 3 (95–35 cm, 3100–760 cal yr BP; poor fen) is characterized by an increasing relative abundance of Sphagnum remains within the mixed Sphagnum-herbaceous peat of the interval (Fig. 3), increasing rates of peat vertical accretion, and the appearance of testate amoebae in higher concentrations (Fig. 4). The pollen assemblage is characterised by an increase in Betula at the base of the zone. Ericaceae and Cyperaceae pollen increase and decrease, respectively, at the subzonal boundary (63 cm; 1500 cal yr BP; Fig. 4). Further, the subzonal boundary marks an increase in Ambrosia type and a more consistent presence of Artemisia and Chenopodiaceae (Supplementary Fig. S2), which could indicate regional disturbance (e.g., Klinger and Short, Reference Klinger and Short1996; Glaser et al., Reference Glaser, Hansen, Siegel, Reeve and Morin2004; O'Reilly et al., Reference O'Reilly, Finkelstein and Bunbury2014). Fungal remains also become more consistently present in this zone, while reticulate algae become absent (Fig. 4 and Supplementary Fig. S2). At the subzonal boundary (63 cm; 1500 cal yr BP), the testate amoeba assemblage shifts from the predominance of Amphitrema wrightianum type to Archerella flavum, with decreases in both taxa, and increases in Difflugia pulex type and Hyalosphenia subflava and Heleopera sylvatica in the upper portion of the zone. The testate amoeba assemblage shifts are associated with a transition from lower to higher depths to the water table and therefore drier conditions (Fig. 4 and Supplementary Fig. S2). Further, the isoGDGT assemblage shifts at the subzonal boundary, with a decrease in isoGDGT-1 and crenarchaeol and an increase in isoGDGT-2 and isoGDGT-3 (Fig. 5). The subzonal boundary is also characterised by an increase in the MBT’5ME ratio. The IR6me ratio and pH reconstruction also decrease towards the subzonal boundary, with IR6me reaching 0 at 70 cm (1700 cal yr BP; Fig. 5); taken together, these changes suggest a shift from a rich fen to a poor fen.
Zone 4 (35–0 cm; 760 cal yr BP to present; bog phase) is defined by a shift in testate amoeba composition to Alabasta militaris, Difflugia pulex, Arcella catinus, and Cyclopyxis arcelloides types and to Hyalosphenia subflava, with sustained drier conditions and the establishment of bog conditions at the site. Pyxidicula sp. A is also a significant portion of the assemblage. Species from the Nebela and Euglypha genera also appear in this zone (Supplementary Fig. S2). The pollen record has a shift to the highest percentage of Ericaceae as well as a shift to an increased Sphagnum abundance. The Procrustes analysis shows that the testate amoeba and pollen assemblages have the lowest sum of squares residuals over the lower boundary of Zone 4, indicating a high concordance in the assemblage changes for these records (Fig. 4). Increases in crenarchaeol correspond to increases in herbaceous material and Cyperaceae pollen between 30 and 10 cm. The subzonal boundary is associated with a shift to an increased percentage of Ericaceae roots and leaves in the peat composition, an increase in Alabasta militaris and Difflugia pristis type, and a decrease in Hyalosphenia subflava, Difflugia pulex type, and Pyxidicula sp. A.
DISCUSSION
Peat initiation and wetland succession
Marsh and rich fen stages (Zones 1 and 2; 7600–3100 cal yr BP)
Land emergence in the region occurred between 8500 and 8000 cal yr BP, as dated by field-based and modelled uplift chronologies (Dyke et al., Reference Dyke, Moore and Robertson2003; Peltier et al., Reference Peltier, Argus and Drummond2015), and climate was suitable for peat development from the time of land emergence (growing season temperature >0°C after 8.5 ka; Morris et al., Reference Morris, Swindles, Valdes, Ivanovic, Gregoire, Smith, Tarasov, Haywood and Bacon2018). Peat initiation at the HRST 13-01 site, however, did not occur until at least ~400 yr later (Fig. 3). Basal sediments from the site indicate the establishment of a non-peat-forming marsh following land emergence. Sphagnum macrofossils (Fig. 3) and spores (Fig. 4) are also present within the inorganic sediments, indicating that the site was transitioning to a fen ecosystem. Peat accumulation was occurring by 7600 cal yr BP, with pollen, plant macrofossils, and brGDGT indices holistically indicating the establishment of a rich fen ecosystem with Cyperaceae and Ericaceae and neutral to alkaline pH (Fig. 5).
Higher relative abundances of Ericaceae, Larix, and Betula pollen in the early portion of the record (Fig.4; Zone 1) are similar to other available records from the HBL, which suggest a regional succession from herbs and grasses to shrubs, followed by the establishment of a Picea-dominated landscape with decreased marine influence and wetland succession (i.e., coastal marshes to interior fens and bogs; McAndrews et al., Reference McAndrews, Riley and Davis1982; Klinger and Short, Reference Klinger and Short1996; Kettles et al., Reference Kettles, Garneau and Jetté2000; Hargan et al., Reference Hargan, Finkelstein, Rühland, Packalen, Dalton, Paterson, Keller and Smol2020). Rare grains of more southern tree pollen taxa at this site (i.e., Acer, Juglans, Quercus, and Tsuga; Supplementary Fig. S2) reflect its proximity to the margin of the HBL ecoregion (~85 km from the site; Fig. 1). The record also has Ambrosia-type pollen throughout (Supplementary Fig. S2). Ambrosia is not found in the HBL (Riley, Reference Riley2003, Reference Riley2011). Therefore, its pollen changes are interpreted here as indicators of long-distance transport from regions where disturbance has occurred, as in previous studies (Klinger and Short, Reference Klinger and Short1996; O'Reilly et al., Reference O'Reilly, Finkelstein and Bunbury2014; Kettles et al., Reference Kettles, Garneau and Jetté2000; Glaser et al., Reference Glaser, Hansen, Siegel, Reeve and Morin2004).
Upon the establishment of a peat-forming rich fen at 7600 cal yr BP, the record is characterised by exceptionally slow rates of peat vertical accretion (<0.007 cm/yr) until 3900 cal yr BP (Fig. 3). These slow rates are likely related to underlying topographic controls on local hydrology and vegetation type. The site is located on a slight upland between the Moose and Albany River watersheds and is underlain by sand to gravel beach deposits and glacial tills (Fig. 1) that could have promoted drainage and made the site prone to drying (Elmes and Price, Reference Elmes and Price2019). Evidence for drier conditions from the paleoecological record includes the presence of Ericaceae pollen (Fig. 4) and wood fragments (Table 1), suggesting the local presence of woody plants. There is also a higher relative abundance of crenarchaeol in the deepest part of the peat core. Crenarchaeol is a biomarker produced by ammonium oxidising Thaumarchaeota; they require oxygen and are more abundant in dry soils (Sinninghe Damsté et al., Reference Sinninghe Damsté, Schouten, Hopmans, van Duin and Geenevasen2002; Zheng et al., Reference Zheng, Li, Wang, Naafs, Yu and Pancost2015; Naafs et al., Reference Naafs, Inglis, Blewett, McClymont, Laurentano, Xie, Evershed and Pancost2019). However, the presence of algal microfossils (cf. HdV-60) suggests that very wet and/or submerged conditions may have also occurred at the site during portions of the rich fen zone (van Geel et al., Reference van Geel, Bohncke and Dee1980). The brGDGT pH proxy suggests near alkaline conditions (Fig. 5), which supports sustained groundwater discharge to the site. Therefore, the site may have experienced changes in hydrological conditions that were dependent on seasonal and/or annual changes in groundwater flow (Elmes and Price, Reference Elmes and Price2019). The coarse-grained substrate during times of lower groundwater discharge would have increased the potential exposure of any accumulated peat to oxygenation and subsequent decomposition. Further, herbaceous peat characterises the interval and is also less recalcitrant than other peat types. Therefore, peat type could have further contributed to the low rates of vertical peat growth (Laiho, Reference Laiho2006). Finally, along with varying groundwater conditions, spatial heterogeneity in terms of surface microforms and vegetation at the site could also have contributed to the variability of the ecological indicators in this interval (e.g., Belyea and Baird, Reference Belyea and Baird2006).
Testate amoebae are also found infrequently within the herbaceous-dominated peat, only occurring in two samples with a higher Sphagnum macrofossil abundance (125–115 cm; Fig. 4). The varying Sphagnum macrofossil abundance in this interval is likely related to changing hydrological conditions at the site and/or spatial heterogeneity of vegetation, as mentioned above. The general coincidence with Sphagnum peat for the testate amoebae record may be related to both the initial environment and the taphonomy. Although more diverse in general owing to the higher mineral and nutrient content, minerotrophic fen systems tend to be dominated by herbaceous material and brown mosses, which are more prone to drying, resulting in a less stable habitat for testate amoebae and therefore smaller populations (Lamentowicz et al., Reference Lamentowicz, Galka, Rusińska, Sobczyński, Owsianny and Lamentowicz2011). Sphagnum, however, can retain moisture within specialised water cells, providing more consistent moisture availability, and thus testate amoebae are more often found in Sphagnum-dominated portions of paleoecological records (Lamentowicz et al., Reference Lamentowicz, Galka, Rusińska, Sobczyński, Owsianny and Lamentowicz2011). Organic-rich or more alkaline systems, such as the study site, can promote the dissolution of silica in peatlands (Bennett et al., Reference Bennett, Siegel, Hill and Glaser1991), thus negatively impacting the preservation of testate amoebae with siliceous tests. Siliceous testate amoebae, such as Difflugia and Centropyxis, tend to be most diverse in fen systems owing to a higher silica availability; therefore, communities in fen ecosystems may be more prone to dissolution and preservation biases (Lamentowicz et al., Reference Lamentowicz, Galka, Rusińska, Sobczyński, Owsianny and Lamentowicz2011). At HRST 13-01, there is a notable absence of Centropyxis taxa (Supplementary Fig. S2) in the lower portion of the core, despite being common in rich fen stages in peatland records (Bunbury et al., Reference Bunbury, Finkelstein and Bollmann2012; Lamentowicz et al., Reference Lamentowicz, Galka, Milecka, Tobolski, Lamentowicz, Fialkiewicz-Koziel and Blaauw2013; Bysouth and Finkelstein, Reference Bysouth and Finkelstein2020). Therefore, the poor preservation of testate amoebae supports the interpretation of drier and alkaline conditions in the lower portion of the core.
Sustained rich fen conditions at the site until 3200 cal yr BP take place in the context of warmer temperatures associated with the regional timing of the Holocene thermal maximum in the mid Holocene (8000–5000 cal yr BP), followed by cooling in the late Holocene and transition to the Neoglacial (4000–2500 cal yr BP; Viau and Gajewski, Reference Viau and Gajewski2009; Hargan et al., Reference Hargan, Finkelstein, Rühland, Packalen, Dalton, Paterson, Keller and Smol2020). The mid Holocene differed from the late Holocene because the incursion of dry Pacific and Arctic air masses was less frequent, leading to increased summer precipitation, as inferred from eastern North American δ18O, charcoal, and pollen records (Edwards et al., Reference Edwards, Wolfe and MacDonald1996; Carcaillet and Richard, Reference Carcaillet and Richard2000; Moos and Cumming, Reference Moos and Cumming2011). However, there was reduced overall moisture availability during the mid Holocene in northern Ontario and Quebec because of warmer temperatures driven by insolation, resulting in a higher evaporative demand, as shown by lower regional lake levels and pollen records (Payette and Filion, Reference Payette and Filion1993; Moos and Cumming, Reference Moos and Cumming2011; Karmakar et al., Reference Karmakar, Laird and Cumming2015). Thus, we expect that the HRST 13-01 site would show increased rates of peat vertical accretion during the warmer conditions and longer growing season of the mid Holocene (Charman et al., Reference Charman, Beilman, Blaauw, Booth, Brewer, Chambers and Christen2013; Packalen and Finkelstein, Reference Packalen and Finkelstein2014; Gallego-Sala et al., Reference Gallego-Sala, Charman, Brewer, Page, Prentice, Friedlingstein and Moreton2018) (higher rates have been recorded at this time for some fen sites in the HBL and northern Quebec regions; see Glaser et al., Reference Glaser, Hansen, Siegel, Reeve and Morin2004; van Bellen et al., Reference van Bellen, Dallaire, Garneau and Bergeron2011a; O'Reilly et al., Reference O'Reilly, Finkelstein and Bunbury2014; Packalen and Finkelstein, Reference Packalen and Finkelstein2014; Bysouth and Finkelstein, Reference Bysouth and Finkelstein2020). However, since there are low rates of accumulation at HRST 13-01 at this time, the local topography, underlying surficial deposits, and hydrological conditions at the site appear to be critical in suppressing the rates of peat vertical accretion, despite favourable climatic conditions for peat growth. Further, if drainage and groundwater discharge were especially sensitive to climatic changes in the region surrounding the site, the relatively drier conditions of the mid Holocene may have further promoted decomposition in this interval (Bragazza et al., Reference Bragazza, Buttler, Robroek, Albrecht, Zaccone, Jassey and Signarbieux2016; Elmes and Price, Reference Elmes and Price2019). An increase in peat vertical accretion takes place after 3900 cal yr BP within the rich fen zone (Fig. 3). This major change occurs within the same biostratigraphic zone, suggesting a limited impact of differences in vegetation type, organic matter quality, or peat recalcitrance on the rate of peat accretion in this record. Instead, this may further indicate that the transition to the cooler and relatively wetter conditions of the late Holocene in eastern Canada promoted vertical peat growth at the site by sustaining higher water tables.
Poor fen stage (Zone 3, 3100–760 cal yr BP)
A shift to higher shrub cover with an increased relative abundance of Betula pollen, the appearance of testate amoebae, increases in Sphagnum macrofossils, a transition to a mixed Sphagnum-herbaceous peat, and a transition from neutral to acidic pH as reconstructed by brGDGTs mark a shift from a rich to a poor fen and the transition to Zone 3. Betula is interpreted to be a more local successional signal, as lake records from the region indicate that the landscape transitioned to a Picea-dominated forest with shoreline regression and wetland succession between 6500 and 6000 cal yr BP (McAndrews et al., Reference McAndrews, Riley and Davis1982; Friel et al., Reference Friel, Finkelstein and Davis2014; Hargan et al., Reference Hargan, Finkelstein, Rühland, Packalen, Dalton, Paterson, Keller and Smol2020). Further, the shift to a Picea-dominated landscape surrounding the site in the HRST 13-01 record does not coincide with this shift in Betula; instead, it is seen earlier, at the boundary between Zones 1 and 2 (7600 cal yr BP). The testate amoeba assemblages for most of Zone 3 are dominated by A. wrightianum type, an indicator of wet conditions (Charman et al., Reference Charman, Hendon and Woodland2000; Lamarre et al., Reference Lamarre, Magnan, Garneau and Boucher2013) that has been found in modern poor fen sites in the HBL (Amesbury et al., Reference Amesbury, Booth, Roland, Bunbury, Clifford, Charman and Elliot2018) and moderately rich fen sites in northern Quebec (Loisel and Garneau, Reference Loisel and Garneau2010; van Bellen et al., Reference van Bellen, Garneau and Booth2011b). At the subzonal boundary (63 cm; 1500 cal yr BP), fungal groups are also more consistently abundant, signifying oxygenated conditions in the surface peat (Yeloff et al., Reference Yeloff, Charman, van Geel and Mauquoy2007), and Ericaceae pollen increases in relative abundance (Fig. 4). The fungal groups are also often associated with Ericaceae and Sphagnum species (HdV-13 and HdV-27, respectively; Fig. 4), further supporting the local presence of these vegetation types. Increases in the relative abundance of isoGDGTs-2 and -3 and the gradual disappearance of crenarchaeol also occur after the subzonal boundary. These biomarkers could reflect archaeal membrane adaptation in response to increasingly acidic conditions, which has been demonstrated to occur in peats (Blewett et al., Reference Blewett, Naafs, Gallego-Sala and Pancost2020), and/or increases in the bog-dwelling acidophilic, nonmethanogenic taxa such as Thermoplasmatales (Yang et al., Reference Yang, Xiao, Słowakiewicz, Ding, Ayari, Dang and Pei2019). Furthermore, 6-methyl brGDGTs, which are associated with a neutral pH (Naafs et al., Reference Naafs, Inglisab, Zheng, Amesbury, Biestere, Bindler and Blewett2017), disappear from the record (IR6me = 0) before the subzonal boundary. Thus, the isoGDGT records also support the inferred trophic changes through Zones 3–4.
At other sites in the HBL and adjacent regions, cool Neoglacial conditions under sufficient moisture have been linked to slower rates of peat accretion due to lower net primary productivity (Kettles et al., Reference Kettles, Garneau and Jetté2000; Loisel and Garneau, Reference Loisel and Garneau2010; Bunbury et al., Reference Bunbury, Finkelstein and Bollmann2012; Packalen and Finkelstein, Reference Packalen and Finkelstein2014; Bysouth and Finkelstein, Reference Bysouth and Finkelstein2020). At HRST 13-01, however, the establishment of Sphagnum, which is more resistant to decay than herbaceous vegetation, promoted an increase in peat accretion. The shift from rich to poor fen-like conditions after 3100 cal yr BP is likely the result of both hydrologic and autogenic changes. Slower rates of isostatic uplift (Andrews and Peltier, Reference Andrews, Peltier and Fulton1989) would have promoted more stable hydrologic regimes in the HBL landscape, allowing the potential establishment of a local divide and water table mounds to sustain peat accretion (Glaser et al., Reference Glaser, Hansen, Siegel, Reeve and Morin2004). The shift from a rich to a poor fen takes place in the context of cooler conditions and increased moisture availability, with reduced evaporative demand at the regional scale (Moos and Cumming, Reference Moos and Cumming2011; Hargan et al., Reference Hargan, Finkelstein, Rühland, Packalen, Dalton, Paterson, Keller and Smol2020). More moisture availability at the site would have also promoted peat accretion by limiting decomposition, thus promoting autogenic processes, whereby continued accumulation would lead to reduced groundwater flow and subsequent isolation from groundwater influence (Glaser et al., Reference Glaser, Hansen, Siegel, Reeve and Morin2004).
Bog stage (Zone 4, 760 cal yr BP–present)
The fen to bog transition at 35 cm (760 cal yr BP) is marked by a decrease in Cyperaceae, an increase in Ericaceae pollen, a shift to bog-indicator testate amoeba taxa, and an acidic pH (minima ~4) as reconstructed by brGDGTs (Figs. 4 and 5). The boundary is also where the Procrustes analysis shows the highest congruence between pollen and testate amoeba records (Fig. 4 and Supplementary Fig. S1), suggesting coincident shifts in vegetation at the surrounding site and testate amoeba communities at the coring location. Further, there is a shift from generally wet indicators to taxa that have a wider tolerance to drier and more variable hydrological conditions across the boundary (i.e., Difflugia pulex type and Hyalosphenia subflava (Booth, Reference Booth2008; Loisel and Garneau, Reference Loisel and Garneau2010; Sullivan and Booth, Reference Sullivan and Booth2011), suggesting a shift to a precipitation-controlled and therefore ombrotrophic setting (Fig. 4). Variable hydrological conditions are also supported by the shifting abundances of herbaceous materials, Cyperaceae pollen, and crenarchaeol in this interval (Zone 4; Figs. 3–5). The fen to bog transition at HRST 13-01 occurs towards the end of the Medieval Climate Anomaly (MCA; 1000–600 cal yr BP; Mann et al., Reference Mann, Zhang, Rutherford, Bradley, Hughes, Shindell, Ammann, Faluvegi and Ni2009), which could suggest that climate played a role in promoting the shift to ombrotrophy, as has been recorded in other regions (Loisel and Bunsen, Reference Loisel and Bunsen2020). However, the abundance of Sphagnum since the poor fen stage and a higher vertical peat accretion also would have helped to acidify and isolate the site from the groundwater table (Rydin and Jeglum, Reference Rydin and Jeglum2013). Therefore, the shift to ombrotrophy could also be caused by autogenic processes.
Validation of peat-specific brGDGT-based proxies for temperature and pH in peats
The MBT’5ME ratio, which has been used to infer MAAT in modern and ancient peats (Naafs et al., Reference Naafs, Inglisab, Zheng, Amesbury, Biestere, Bindler and Blewett2017, Reference Naafs, Rohrssen, Inglis, Lähteenoja, Feakins, Collinson and Kennedy2018; Zheng et al., Reference Zheng, Pancost, Liu, Wang, Naafs, Xie, Liu, Yu and Yang2017) generally increases up-core at HRST 13-01. This trend is likely partly due to a bias towards summer temperatures in the acrotelm, as found in other high-latitude peats (Naafs et al., Reference Naafs, Inglisab, Zheng, Amesbury, Biestere, Bindler and Blewett2017). For example, the MBT’5ME ratio for the uppermost sample results in a reconstructed MAAT of 15 ± 4.7°C, much higher than the actual MAAT of 1°C. However, the reconstruction is consistent with the mean summer temperature of 18°C at the closest weather station (Smoky Falls; Fig. 1; Government of Canada, 2020). The MBT’5ME values might also be influenced by changes in peat type, with higher MBT’5ME values for Sphagnum-dominated peat (Fig. 3). This is consistent with findings from Weijers et al. (Reference Weijers, Steinmann, Hopmans, Schouten and Sinninghe Damsté2011), which demonstrated that reconstructed temperature shifts in an ombrotrophic bog in the Jura Mountains were impacted by the changing trophic status of the site.
At HRST 13-01, the CBTpeat ratio used to reconstruct the pH also follows vegetation shifts, and the reconstructed pH values are well within the ranges expected for the paleowetland types inferred from the macro- and microfossil proxies, corroborating other studies that have used brGDGTs as a pH proxy in peat (Weijers et al., Reference Weijers, Steinmann, Hopmans, Schouten and Sinninghe Damsté2011; Nichols et al., Reference Nichols, Peteet, Moy, Castaneda, McGeachy and Perez2014; Zheng et al., Reference Zheng, Pancost, Naafs, Li, Liu and Yang2018). Thus, we further highlight the utility of brGDGT peat-based pH proxies for identifying shifts in rich to poor fen and fen to bog transitions, which are important for confirming successional pathways and impacts on peat accretion and carbon accumulation.
Controls on apparent rates of carbon accumulation
The average CAR for HRST 13-01 is 12 ± 9 g C/m2/yr, which is low compared with other bogs in northern Ontario and Quebec (range 15–25 g C/m2/yr; van Bellen et al., Reference van Bellen, Dallaire, Garneau and Bergeron2011a; Bunbury et al., Reference Bunbury, Finkelstein and Bollmann2012; Holmquist and MacDonald, Reference Holmquist and MacDonald2014; Packalen and Finkelstein, Reference Packalen and Finkelstein2014) and with bogs in a synthesis of circumboreal northern peatlands (23 ± 2 g C/m2/yr; mean ± SE; Loisel et al., Reference Loisel, Yu, Beilman, Camill, Alm, Amesbury and Anderson2014). Paleoecological studies of other HBL fens and bogs have suggested that fen cores can have a greater carbon content than bog cores dominated by Sphagnum peat (Bunbury et al., Reference Bunbury, Finkelstein and Bollmann2012; O'Reilly et al., Reference O'Reilly, Finkelstein and Bunbury2014; Bysouth and Finkelstein, Reference Bysouth and Finkelstein2020), although multisite comparisons of Sphagnum and non-Sphagnum peat within HBL peat cores are lacking. Multisite comparisons of peat types within peat cores for southern Patagonia have shown instead that Sphagnum peat is often associated with a higher CAR than fen peat (Loisel and Bunsen, Reference Loisel and Bunsen2020). In the HRST 13-01 record, the highest CARs take place in the upper part of the poor fen zone and the lower part of the bog zone where Sphagnum is abundant. Thus, CAR is not neatly constrained by peatland type; rather, it reaches maximum values when rates of peat vertical accretion are elevated, bulk densities are >0.1 g cm-3, and vegetation type is resistant to decay.
In terms of climatic controls on CARs, a series of paleoecological records from the HBL region and adjacent boreal shield show an increased CAR between 6.5 and 4 ka, coincident with the regional HTM (van Bellen et al., Reference van Bellen, Dallaire, Garneau and Bergeron2011a; Bunbury et al., Reference Bunbury, Finkelstein and Bollmann2012; Holmquist and MacDonald, Reference Holmquist and MacDonald2014; O'Reilly et al., Reference O'Reilly, Finkelstein and Bunbury2014; Packalen and Finkelstein, Reference Packalen and Finkelstein2014; Bysouth and Finkelstein, Reference Bysouth and Finkelstein2020). A sustained low CAR in the early part of the HRST 13-01 record, despite regional warming and potentially enhanced primary production, suggests that the local hydrological regime and underlying glacial deposits limited any climatic enhancement of carbon accumulation and instead resulted in the observed very low rates of peat accretion. Further, the warmer temperatures of the mid Holocene may have had a larger effect at HRST 13-01 than at other localities by having a stronger control on the local hydrological conditions because of better drainage, which promoted drier conditions and enhanced decomposition. CARs at HRST 13-01 in the late Holocene are strongly tied to a shift to lower bulk densities towards the top of the core, suggesting that vegetation composition and its decomposability are more important factors locally than centennial-scale shifts in climate, such as the MCA, which have been associated with higher CARs at other HBL sites (Bunbury et al., Reference Bunbury, Finkelstein and Bollmann2012).
CONCLUSIONS
This multiproxy paleoecological record demonstrates the importance of local ecohydrological changes in apparent Holocene CARs in HBL peatlands. Site HRST 13-01 is unusual compared with other regional paleoecological records with similar initiation ages (Glaser et al., Reference Glaser, Hansen, Siegel, Reeve and Morin2004; Bunbury et al., Reference Bunbury, Finkelstein and Bollmann2012; O'Reilly et al., Reference O'Reilly, Finkelstein and Bunbury2014; Bysouth and Finkelstein, Reference Bysouth and Finkelstein2020) because less peat accumulated; as a result, the average apparent CAR is lower than regional and circumboreal means (Packalen and Finkelstein Reference Packalen and Finkelstein2014; Loisel et al., Reference Loisel, Yu, Beilman, Camill, Alm, Amesbury and Anderson2014). These lower rates likely reflect the site's physiographic setting on a modest upland and overlying coarse-grained glacial deposits that likely promoted better drainage. As carbon density is variable across the HBL (Packalen et al., Reference Packalen, Finkelstein and McLaughlin2016), the analyses from HRST 13-01 provide insight into peatland development in areas where peat depths are lower but initiation ages are relatively old for the HBL. The multiple proxies allowed for a division of the record into successional stages, from a marsh to a rich and then a poor fen and finally to a bog. Comparisons between these transitions show that the rates of peat vertical accretion and carbon accumulation were not closely tied to peatland type but related to broad vegetation classes and their decomposability. Low rates of vertical accretion despite the warmer climate of the HTM suggest that hydrological conditions were of greater importance locally. Vertical accretion rates increased after 3900 cal yr BP but are not directly associated with a shift in peatland type, suggesting that Neoglacial cooling may have promoted a lower evaporative demand and therefore wetter conditions needed to sustain higher rates of peat accretion. Finally, we show a summer bias in the brGDGT indices used to reconstruct paleotemperature, as reported at other high-latitude peatlands. Finally, we demonstrate that the brGDGT proxy for pH is a useful tool for indicating rich to poor fen transitions, as the proxy was consistent with plant macrofossil, pollen, and testate amoeba records.
Data Availability
All data associated with this article (pollen; non-pollen palynomorph, plant macrofossil, and testate amoeba assemblages; radiocarbon dates; LOI; and brGDGT biomarker abundances) are available in the Neotoma Paleoecology Database (http://www.neotomadb.org/; Williams et al., Reference Williams, Grimm, Blois, Charles, Davis, Goring and Graham2018), archived with the site name “HRST1301” (site 27270).
Supplementary Material
The supplementary material for this article can be found at https://doi.org/10.1017/qua.2021.22
Acknowledgments
We thank P. Barnett for invaluable guidance in the field, many discussions on the geological and geomorphic setting, and help with drafting Figure 1; A. Dalton and M. Nguyen for field assistance; J. Palozzi for laboratory assistance; and R.K. Booth, E. Grimm, J. Williams, and N. Cullen for assistance with uploading the datasets to the Neotoma database. We also thank J. Loisel and two anonymous reviewers for their feedback that helped improve this manuscript.
Financial Support
Funding for this project was provided by grants from the Natural Sciences and Engineering Research Council of Canada (NSERC) and support from the Ontario Ministry of Northern Development and Mines and the Ontario Ministry of Natural Resources and Forestry to S. Finkelstein, and a NSERC postgraduate scholarship (NSERC PGS-D) and Canadian Quaternary Association (CANQUA) Alexis Dreimanis Award to M. Davies. J. Blewett is supported by a NERC GW4+ doctoral training partnership studentship from the Natural Environment Research Council (NE/L002434/1) and is thankful for the support and additional funding from CASE partner Elementar UK Ltd. B.D.A. Naafs acknowledges funding through the Royal Society Tata University Research Fellowship. NERC (Reference: CC010) and NEIF (www.isotopesuk.org) are thanked for funding and maintenance of the LC-MS instrument used for this work.