1. Introduction
The vulnerability of global navigation satellite systems (GNSS) has been widely demonstrated by recent successful implementations of spoofing trials (Kerns et al., Reference Kerns, Shepard, Bhatti and Humphreys2014; Bhatti and Humphreys, Reference Bhatti and Humphreys2017), which further fuels concerns about the security of GNSS civil users, especially in safety-critical applications. Hence, it is increasingly important to develop reliable countermeasures to safeguard the GNSS-infrastructure against any spoofing threats.
Current spoofing detection and mitigation techniques operate at three levels: antenna or RF front-end level, acquisition/tracking level and measurements level. Approaches of the first category are either based on receiver antenna array processing (Konovaltsev et al., Reference Konovaltsev, Cuntz, Haettich and Meurer2013; Domínguez et al., Reference Domínguez, López-Almansa, Seco-Granados, Salcedo, Egea, Aguado, Lowe, Naberezhnykh, Dovis and Boyero2015; Magiera and Katulski, Reference Magiera and Katulski2015; Hu et al., Reference Hu, Bian, Li and Zhou2018) or on a single moving antenna (Nielsen et al., Reference Nielsen, Broumandan and Lachapelle2011; Psiaki et al., Reference Psiaki, Powell and O'Hanlon2013b). They achieve a good anti-spoofing capability but depend heavily on additional antennas or the assumption of the receiver motion. Approaches at the acquisition/tracking level detect the counterfeit signals by means of various signal processing techniques, such as signal quality monitoring (SQM) metrics or metric combinations (Ali et al., Reference Ali, Manfredini and Dovis2014; Manfredini et al., Reference Manfredini, Dovis and Motella2014; Yang et al., Reference Yang, Li and Lu2015; Huang et al., Reference Huang, Presti, Motella and Pini2016; Jafarnia-Jahromi et al., Reference Jafarnia-Jahromi, Broumandan, Daneshmand, Lachapelle and Ioannides2016; Sun et al., Reference Sun, Cheong, Dempster, Zhao and Feng2018a), Doppler anomaly monitoring (Pirsiavash et al., Reference Pirsiavash, Broumandan and Lachapelle2016), carrier-to-noise ratio (C/N0) monitoring (Dehghanian et al., Reference Dehghanian, Nielsen and Lachapelle2012; Jafarnia-Jahromi et al., Reference Jafarnia-Jahromi, Broumandan, Nielsen and Lachapelle2012a), subspace projection (Han et al., Reference Han, Chen, Meng and Li2017), distribution checks of correlator outputs (Jafarnia-Jahromi et al., Reference Jafarnia-Jahromi, Lin, Broumandan, Nielsen and Lachapelle2012b; Gamba et al., Reference Gamba, Truong, Motella, Falletti and Ta2017), and the adaptive filter-based method (Mosavi et al., Reference Mosavi, Nasrpooya and Moazedi2016). The authors’ newly proposed moving variance-based method, capturing the fluctuation of the raw SQM values, also belongs to this category (Sun et al., Reference Sun, Cheong, Dempster, Demicheli, Cetin, Zhao and Feng2018b, Reference Sun, Cheong, Dempster, Zhao, Demicheli and Feng2018c). Techniques in the third category are implemented after the GNSS signals have been stably demodulated. Consistency checks are performed at this stage among different measurements such as ephemeris data or clock offset change (Jovanovic et al., Reference Jovanovic, Botteron and Farine2014). In addition, a maximum likelihood estimation-based technique working across tracking loop and positioning domain can achieve spoofing estimation/cancellation (Wang et al., Reference Wang, Li and Lu2017). Cryptographic modulation of the civil GNSS signal (Wesson et al., Reference Wesson, Rothlisberger and Humphreys2012) has also been found to be effective for anti-spoofing.
There are various ways to implement a spoofing attack, however, and some more sophisticated than others. Humphreys et al. classified common spoofing attacks into three categories: simplistic attack, intermediate attack, and sophisticated attack (Humphreys et al., Reference Humphreys, Ledvina, Psiaki, O'Hanlon and Kintner2008). One kind of intermediate attack is the so-called matched-power spoofing attack in which the spoofer attempts to make sure the power of the counterfeit signal is just slightly larger than that of the authentic signal. It is the most difficult to counter as it does not trigger the discernible changes in automatic gain controller that over-powered spoofing attacks will. This paper specifically aims to mitigate this type of spoofing attack.
When the victim user equipment (UE) receiver encounters a matched-power spoofing attack under clear sky conditions, the victim UE receiver will still receive the authentic GNSS signals albeit at a lower signal strength than the spoofing signals. It is based upon this principle that the approach of dual receiver correlation of military signals (DRCMS) (O'Hanlon et al., Reference O'Hanlon, Psiaki, Humphreys and Bhatti2010; Psiaki et al., Reference Psiaki, O'Hanlon, Bhatti, Shepard and Humphreys2011, Reference Psiaki, O'Hanlon, Bhatti, Shepard and Humphreys2013a) was derived. This technique exploits the encrypted P(Y) code channel on the L1 frequency point originally intended for military use. While a civilian user does not have a priori knowledge to decode the encrypted P(Y) signals, the user can exploit the fact that the tracking loop residuals, i.e., quadrature output of the same channel of two different receivers, are highly correlated. Herein, one receiver is called the reference station (RS) – it is assumed to be at a secure location that is completely unaffected by spoofing attacks; the other receiver is the UE receiver which is the potential spoofing victim. In Psiaki et al. (Reference Psiaki, O'Hanlon, Bhatti, Shepard and Humphreys2013a), the quadrature signal components from an RS were sent to the UE receiver via a communication link. Then, the UE receiver correlated the quadrature signal components with the incoming signals to produce a spoofing detection statistic for signal authentication. However, each extracted quadrature signal component from the RS contains both noise and the original P(Y) code. Thus, a longer coherent integration period or noncoherent accumulation is required to enhance the signal to noise ratio. This directly limits its application to dynamic motion scenarios.
On the other hand, direct positioning (DP), also known as collective detection (Closas et al., Reference Closas, Fernandez-Prades and Fernandez-Rubio2007; Axelrad et al., Reference Axelrad, Donna and Mitchell2009, Reference Axelrad, Bradley, Donna, Mitchell and Mohiuddin2011; Bradley et al., Reference Bradley, Axelrad, Donna and Mohiuddin2010; Cheong, Reference Cheong2011; Li et al., Reference Li, Cheong, Wu and Dempster2014; Cheong et al., Reference Cheong, Wu and Dempster2015), is a recently proposed technique to obtain the navigation solution directly without performing separate acquisition and tracking for each satellite. It achieves direct position estimation by projecting the delay-Doppler correlograms of different visible satellites directly onto the position-clock bias domain for estimating the position of the user receiver, bypassing the pseudo-range estimation phase. By means of the DP technique, the conventional multiple single-dimensional channel spoofing detection problem can become a single multi-dimensional position domain problem. Different from the coherent version of DP (Closas et al., Reference Closas, Fernandez-Prades and Fernandez-Rubio2007; Axelrad et al., Reference Axelrad, Donna and Mitchell2009, Reference Axelrad, Bradley, Donna, Mitchell and Mohiuddin2011) combined the individual correlation powers noncoherently to construct a joint detection metric in the position domain – the position domain projected correlogram (PDPC).
This work derived a new DP-enhanced P(Y) based approach for spoofing mitigation, which is implemented in the position domain instead of the typical code delay only domain. If the GPS L1 P(Y) signals rather than coarse/acquisition code (C/A code) are used as signal replica to be correlated against in DP, it can be hypothesised that the authentic position can be identified from the PDPC. As the DP method combines the correlation energy from multiple satellites, the sensitivity improvement of DRCMS under weak signal scenarios can be expected. Therefore, the main contribution of this paper is to enhance the sensitivity of the DRCMS approach using a DP method. The proposed method has three or more potential implications for DRCMS. (a) A shorter coherent integration period can be used to cater for relatively higher dynamics. (b) The DP-enhanced DRCMS can maintain functional under relatively weaker signal conditions than the conventional DRCMS method to achieve a same detection rate. Thus it is more robust against the thermal noise in the quadrature signal components. (c) Furthermore, the method can directly recover the position and clock bias parameters of the vestigial authentic signal. The proposed method can be effective for both noncoherent spoofers and coherent spoofers in the market, such as the LOKI spoofer by IGASPIN GmbH, Austria (Blum et al., Reference Blum, Dütsch, Stoeber, Dampf and Pany2020).
The remainder of this paper is organised as follows: section 2. briefly introduces the problem statement and the motivation of this work. Then the working principle of the proposed position domain anti-spoofing method is described. Next, a thorough mathematical derivation of the statistical characteristics of the spoofing test statistic is presented. In addition, the experimental setup to validate the performance of the proposed method is described, and the results are presented and discussed.
2. Problem formulation
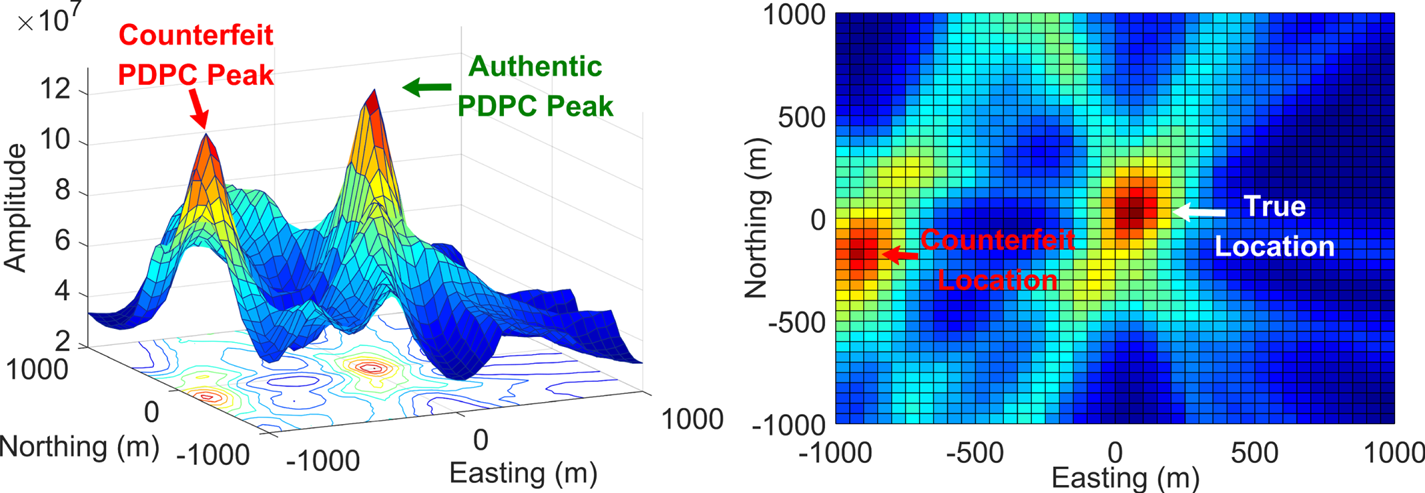
Figure 1 shows the two-dimensional PDPC and its top view using local C/A replicas as reference signals. To ease analysis, it is assumed that height and clock bias have been correctly identified here. When the UE receiver performs DP using local C/A code replicas, two position solutions will be estimated and observed in the presence of a spoofing attack. The point in the centre of the PDPC denotes the true position coordinates of the UE receiver. We can also see another PDPC peak southwest of the centre, where the spoofer attempts to move the UE receiver solution. The distance between the two position coordinates is fully controlled by the spoofer. If the UE receiver has not been spoofed, the computed position solution will be the true user coordinates, but if there are spoofing signals, the computed position solution could be counterfeit. The UE receiver is unable to differentiate between the PDPC of authentic signals from that of the counterfeit signals which, being stronger, will take over the receiver.
Direct application of PDPC (Cheong et al., Reference Cheong, Wu, Dempster and Rizos2011) using only the C/A code local replica for a matched-power spoofed receiver. The left panel shows the authentic and counterfeit PDPC peaks. The right panel is the top view of the left panel

In this paper, a DP-enhanced P(Y) based approach working in the position domain is proposed. The local reference codes (i.e., local C/A replica) in the UE receiver are replaced by the Q channel samples from the RS. Thus the true location can be identified and the counterfeit one can be mitigated.
3. Proposed spoofing mitigation method
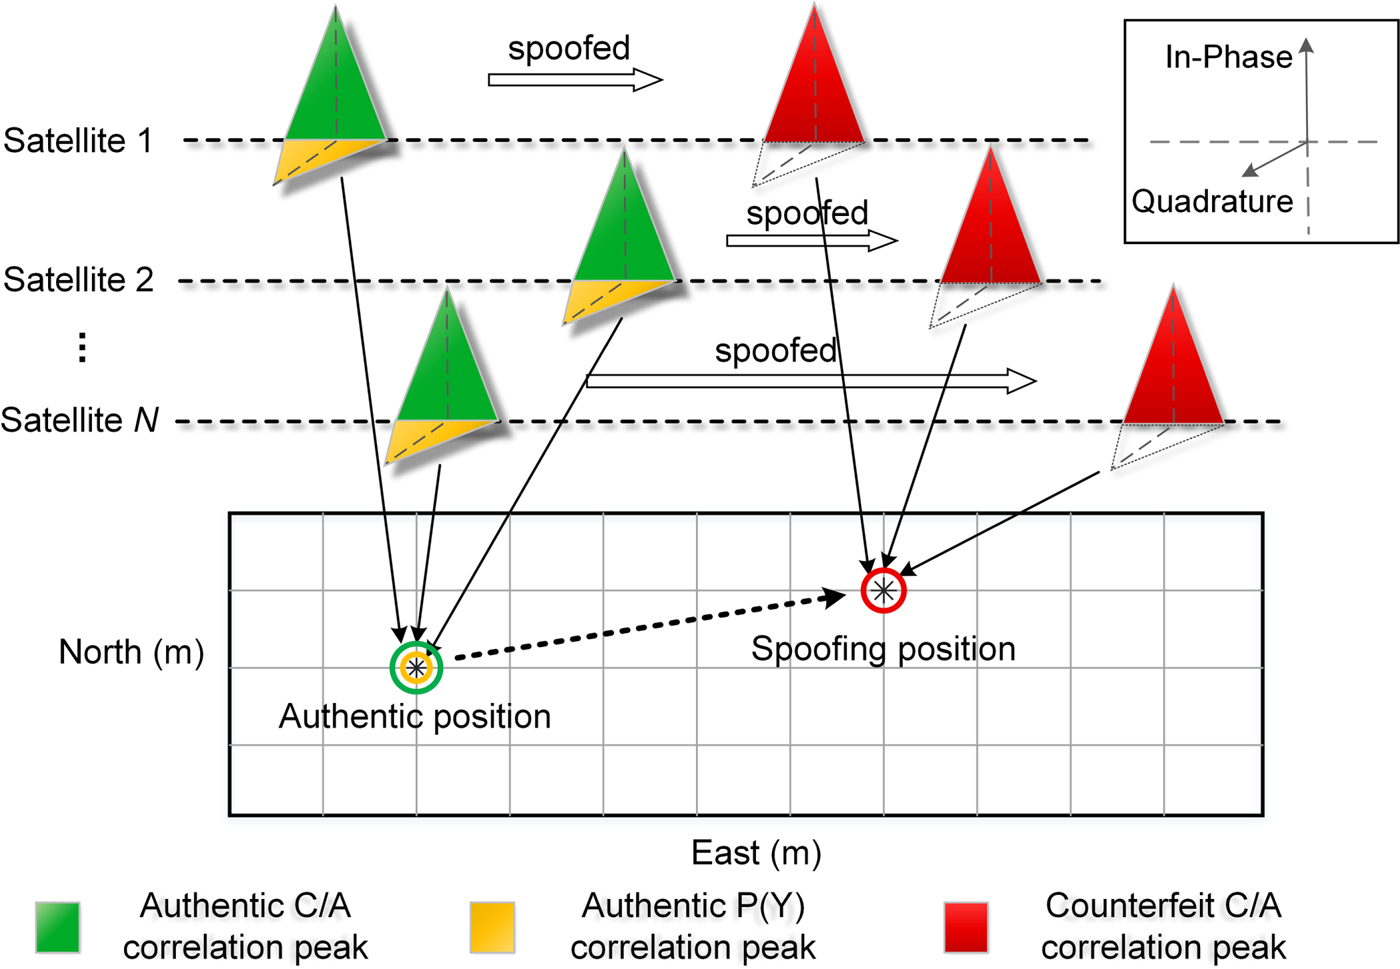
The principle of the proposed position domain anti-spoofing algorithm is illustrated in Figure 2. In the absence of spoofing attacks, the UE receiver tracking loop will track the authentic signals of each channel. At this moment, the energy of the C/A code signal of each tracking loop is concentrated on the in-phase channel (green correlation peaks in Figure 2). The code delays of four or more tracking loops will infer the true user location (green circle in Figure 2).
Algorithm principle of the proposed method. When a spoofing attack is present, the cross-correlation with C/A code can generate two position solutions (green circle and red circle), but the cross-correlation with P(Y) code only generates the authentic position solution (yellow circle)

When there is a matched-power spoofing attack, two potential position solutions are present at the same time: one corresponds to the true location (the green circle in Figure 2), whereas the other corresponds to the counterfeit location (the red circle in Figure 2). In this case, the encrypted P(Y) signals can be employed to identify the true position result to recover from the spoofing attack. This is because the code generation keys behind the P(Y) encrypted military channel of the L1 signal are not open to the public. For the same reason, it is impossible for a spoofer to generate the counterfeit encrypted signals.
It is known that the C/A code and P(Y) code signals are orthogonally modulated (see the yellow correlation functions in Figure 2). So, if an unspoofed RS correctly tracks a C/A code signal, the encrypted signal can be isolated to the tracking loop's quadrature component. When the UE receiver performs DP using its signal and the quadrature component from the RS, the PDPC peak of the encrypted code signal is then generated at the true position (the yellow circle in Figure 2) and the counterfeit one can be identified. Thus, in this way, we can implement the DP method without exact knowledge of the encrypted code, and then calculate the true location of the UE receiver. It is worth noting that the RS is presumed to be secure (Psiaki et al., Reference Psiaki, O'Hanlon, Bhatti, Shepard and Humphreys2011), because it could employ a phased-array antenna with independently steerable beams to detect and suppress signals that are highly directional.
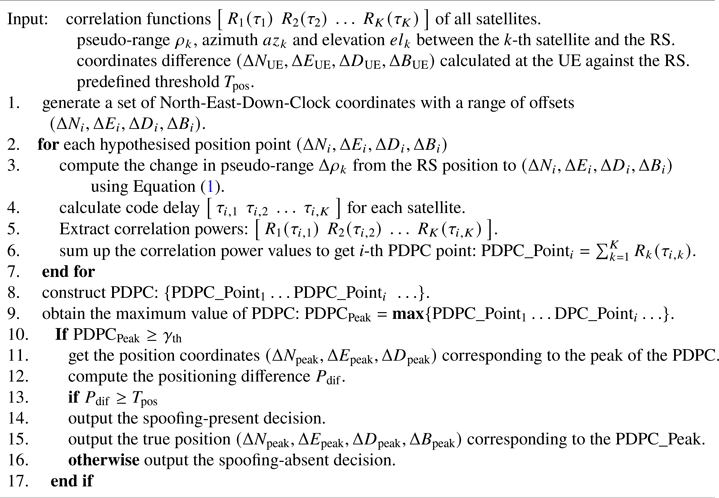
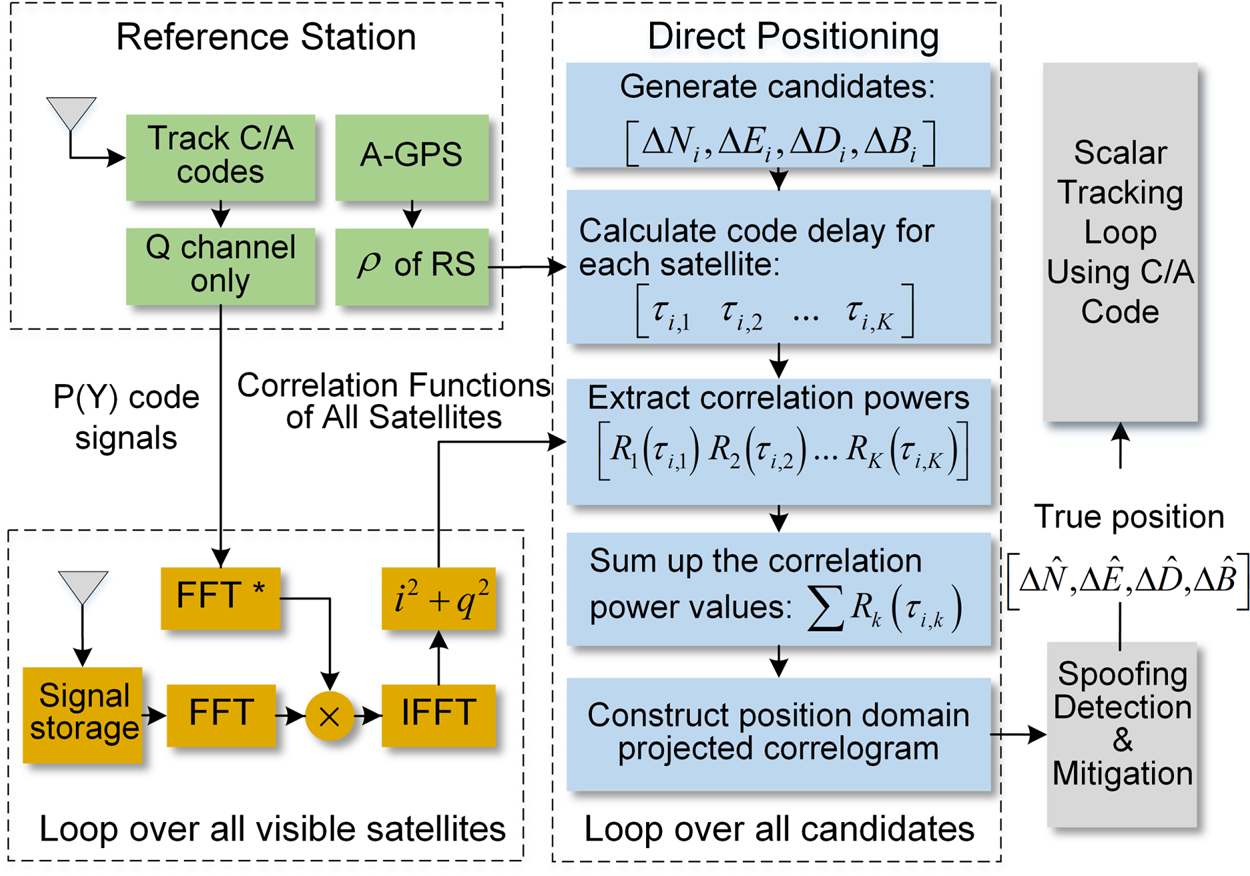
Figure 3 illustrates the algorithm of the proposed spoofing mitigation method. Once a possible spoofing attack has been detected (two PDPC peaks are found), the following steps for spoofing mitigation are carried out: (1) P(Y) signature estimation at the RS, (2) cross-correlation computation of the UE receiver, (3) DP processing and (4) spoofing detection. Steps (3) and (4) show the key point of the proposed DP-enhanced spoofing algorithm. To make the presentation of the proposed method clearer and meanwhile keep it concise, the pseudocode Algorithm 1 is added to focus on explaining steps (3) and (4). The principle of determining the preset threshold value  ${\gamma _{{\rm th}}}$ in line 10 of Algorithm 1 is given in the subsection ‘Noncoherent accumulation and DP’ in section ‘IV. Signal model and statistical analysis’.
proposed DP-enhanced spoofing detection algorithm

Algorithm scheme of the proposed method. The green modules at the top left represent the RS; the other functions are all performed inside the UE receiver

3.1 P(Y) signature estimation
The RS tracks the GPS C/A code signal in real time to isolate the encrypted P(Y) component of the received signal to its Q channel. When the UE receiver makes the request, the RS will transmit the data snapshot of the satellites in view (i.e., the processed tracking loop quadrature channel residual) to the UE receiver via a conventional communication link, such as cellular communication or internet link, along with a timestamp of the data snapshot. The pseudo-range  $\rho $ of each satellite measured at the RS will also be sent to the UE receiver.
3.2 Cross-correlation computation of the UE receiver
In the UE receiver, the correlation process is carried out over all satellites of interest to compute a set of correlation values or correlograms  $\left[ {\begin{array}{*{20}{c}} {{R_1}({{\tau_1}} )}&{{R_2}({{\tau_2}} )}& \ldots &{{R_K}({{\tau_K}} )} \end{array}} \right]$, where K is the total number of the visible satellites. The correlation process uses the Q channel signal (obtained from the RS) as the local replica to correlate against the UE-received signal. Unlike conventional scalar acquisition or tracking, these correlograms are not detected individually but combined noncoherently to construct the PDPC in the case of DP. The parallel code search method (Borio et al., Reference Borio, Camoriano and Presti2008; Cheong et al., Reference Cheong, Wu, Dempster and Rizos2011) is used here to obtain the correlograms which allow a faster computation of the search space. Besides, there should be a signal storage module behind the UE antenna, because the proposed method only works in post-processing or ‘near’ real time – the UE needs to wait for the RS to accumulate the signal and transmit the Q channel signals.
3.3 DP processing
The DP technique maps the search in code delay and Doppler domain for each satellite to the position domain. The search is set up in North-East-Down-Clock coordinates with a range of offsets  $(\Delta {N_i},\Delta {E_i},\Delta {D_i},\Delta {B_i})$ established and the subscript i is used to denote the i-th offset. The 3D position coordinates
 $(\Delta {N_i},\Delta {E_i},\Delta {D_i})$ represent the distance between the possible UE receiver position and the RS in North, East and Down directions.
 $\Delta {B_i}$ represents the relative clock bias between the UE receiver and RS.
The mapping process of code-phase and Doppler frequency based on a hypothesised position is explained as follows. Let  ${\rho _k}$ denote the pseudo-range between the k-th satellite and the RS. Let
 $\Delta {\rho _k}$ denote the change in pseudo-range from the RS position to the hypothesised UE position, which can be written as (Bradley et al., Reference Bradley, Axelrad, Donna and Mohiuddin2010; Cheong, Reference Cheong2011):
 \begin{equation}\Delta {\rho _k} ={-} \cos ({a{z_k}} )\cos ({e{l_k}} )\Delta N - \sin ({a{z_k}} )\cos ({e{l_k}} )\Delta E + \sin ({e{l_k}} )\Delta D + \Delta B\end{equation}
where  $a{z_k}$ and
 $e{l_k}$ denote the azimuth and elevation of the k-th satellite, respectively, centred at the RS position. Then we can calculate the corresponding code delay
 $\left[ {\begin{array}{*{20}{c}} {{\tau_{i,1}}}&{{\tau_{i,2}}}&{\ldots }&{{\tau_{i,K}}} \end{array}} \right]$ for each satellite and each candidate coordinate
 $(\Delta {N_i},\Delta {E_i},\Delta {D_i},\Delta {B_i})$. By extracting correlation power
 $\left[ {\begin{array}{*{20}{c}} {{R_1}({{\tau_{i,1}}} )}&{{R_2}({{\tau_{i,2}}} )}&{\ldots }&{{R_K}({{\tau_{i,K}}} )} \end{array}} \right]$ of individual satellite and summing them up, the PDPC value for each position point in the search grid can be obtained:
 \begin{equation}\textrm{PDPC}\_\textrm{Poin}{\textrm{t}_i} = \sum\limits_{k = 1}^K {{R_k}({{\tau_{i,k}}} )}\end{equation}
Then, the above operation is repeated for different i, and the whole PDPC is constructed. The position of the PDPC point that has the largest combined correlation power is denoted by  $(\Delta {N_{{\rm peak}}},\Delta {E_{{\rm peak}}},\Delta {D_{{\rm peak}}})$, which is taken as the best estimate of the authentic position.
It is worth noting that the solution targeted here is an A-GPS case whereby a nearby RS can provide assistant information to constrain the position search space to within several kilometres. This position search space is the so-called position uncertainty range. Once it is determined, the user receiver will perform the DP algorithm within this area. Generally, the spoofer has to act stably and slowly to keep the tracking loop of UE always in lock. The total spoofing process typically lasts for more than one minute. Thus, if we implement the proposed method promptly, for example, performing one-time spoofing detection every 10 s, it is almost impossible for the spoofer to mislead the UE to somewhere outside the region of uncertainty provided by the RS. Thus, we assume the spoofer misleads the UE to somewhere inside the position uncertainty area. Considering the spoofer and UE are generally on the ground or close to the ground, the height search is ignored in the paper to ease analysis. Similarly, Andrianarison et al. (Reference Andrianarison, Sahmoudi and Landry2017) also set the down uncertainty range to 0.
 $\Delta {B_i}$, also known as the common clock bias, represents the timing difference between the local clock of the receiver and the synchronised clock of the satellite. Internet connectivity will be provided to the UE receiver to help calibrate the clock of UE and limit the clock bias to a small range. Besides, it is important that we are observing the onset of a spoofing attack and not the post-spoofing attack. It means the UE and RS are both initially tracking the authentic C/A signals normally before the onset of spoofing. So the UE-RS clock bias before spoofing is known. When performing spoofing detection using Q channel signals, i.e., the proposed method, we only need to search the clock bias near that ‘known’ value. According to the above analysis, the complexity of the proposed method does not increase dramatically compared with the classical DP method. Note that the relatively high computational burden is a challenge to the classical DP method as well as all the DP-based techniques, but that is not the focus of this paper. Considering that the goal of this paper is to develop a spoofing countermeasure by combining the DP method with the DRCMS, to present the idea explicitly, we just assume clock bias has been correctly identified.
3.4 Spoofing detection and mitigation
After the true position solution  $(\Delta {N_{{\rm peak}}},\Delta {E_{{\rm peak}}},\Delta {D_{{\rm peak}}})$ is obtained, a comparison between the true position coordinates and the position solution previously generated inside the UE receiver is carried out. The offsets
 $(\Delta {N_{{\rm UE}}},\Delta {E_{{\rm UE}}},\Delta {D_{{\rm UE}}})$ represent the difference between the coordinates calculated at the UE receiver using C/A code signals and the real RS position. Thus, the positioning difference
 ${P_{{\rm dif}}}$between the two positions is defined as:
 \begin{equation}{P_{{\rm dif}}}{\kern 1pt} {\kern 1pt} \textrm{ = }{\kern 1pt} {\kern 1pt} {\kern 1pt} \textrm{sqrt}\big({{{({\Delta {N_{{\rm peak}}} - \Delta {N_{{\rm UE}}}} )}^2} + {{({\Delta {E_{{\rm peak}}} - \Delta {E_{{\rm UE}}}} )}^2} + {{({\Delta {D_{{\rm peak}}} - \Delta {E_{{\rm UE}}}} )}^2}}\big)\end{equation}
If  ${P_{{\rm dif}}}$ is larger than a predefined threshold T pos, e.g., 50 m, it indicates that the UE receiver is tracking the counterfeit signals and has been spoofed. Then, the coordinates
 $(\Delta {N_{{\rm peak}}},\Delta {E_{{\rm peak}}},\Delta {D_{{\rm peak}}})$ will be injected into the scalar tracking loop of the UE receiver to reset the parameters. Finally, the UE receiver can track back the authentic signals, and the effect of the spoofing attack is removed.
4. Signal model and statistical analysis
Once the PDPC peak is detected with the help of the RS, the authentic position solution can be obtained, and the spoofing is successfully mitigated. The spoofing mitigation performance thus depends on the detection probability of the PDPC peak. This section introduces the signal model used and gives the theoretical detection performance of the proposed method.
The calculation of the PDPC is divided into two steps: compute the correlograms of individual satellites and then noncoherently sum up the energy of correlograms for each candidate position  $(\Delta {N_i},\Delta {E_i},\Delta {D_i},\Delta {B_i})$. The first step involves coherent integration to produce the I and Q correlation outputs and noncoherent accumulations of I 2 + Q2 to obtain the correlation power. Essentially, the second step is also a kind of noncoherent accumulation similar to that in the first step. For convenience, the introduction of the mathematical derivation is broken into two parts: (1) coherent integration stage and (2) DP, where the noncoherent accumulation is discussed at the stage of DP.
4.1 Coherent integration
The statistical analysis at the stage of coherent integration has been fully discussed (O'Hanlon et al., Reference O'Hanlon, Psiaki, Humphreys and Bhatti2010; Psiaki et al., Reference Psiaki, O'Hanlon, Bhatti, Shepard and Humphreys2011, Reference Psiaki, O'Hanlon, Bhatti, Shepard and Humphreys2013a). An assumption in that literature has been: the P(Y) signal of the UE-received signal resides in the quadrature-phase component and there is no carrier phase difference between the local Q channel signal and the Q channel signal obtained from the RS. From this section onwards, we violate this assumption and impose the condition that the UE is unable to keep the tracking loops in lock. Hence the UE-received authentic C/A code signals can reside in both in-phase and quadrature-phase component. This signal model will then be applied to the statistical analysis in the position domain.
The analysis begins with mathematical models of two baseband signals. One is from the UE receiver that seeks to detect a possible spoofing attack, Receiver A; the other is from an RS, Receiver B. Here we only consider the P(Y) signal, while the C/A signal can be ignored as it is orthogonal and uncorrelated with the P(Y) signal. As we only consider the coherent integration for one satellite here, the subscript ‘k’, which represents different satellites, is omitted for brevity. Thus, irrespective of the presence of a spoofing attack, the normalised signal models can be expressed by:
 \begin{equation}\begin{array}{l} {y_A} = \sqrt {2 \cdot \textrm{CN}{\textrm{R}_A} \cdot {T_\Delta }} \cdot {P_Y}({\Delta \tau } )\cdot {e^{i \cdot {\varphi _d}}} + {n_A}\\ {y_B} = \sqrt {2 \cdot \textrm{CN}{\textrm{R}_B} \cdot {T_\Delta }} \cdot {P_Y} + {n_B} \end{array}\end{equation}
where  ${y_A}$ is the complex baseband signal from Receiver A, and
 ${y_B}$ is the quadrature component of the baseband signal from Receiver B.
 ${T_\Delta}$ is the sampling period of the RF front-end. CNRA and CNRB are the C/N0 ratios of the two signals. These quantities include the attenuation effects of the RF front-end filter. The signal
 ${P_Y}$ is the P(Y) code that is distorted because of the limited RF front-end filter, but re-normalised to have unit power. To ease analysis, we assume that the RS and UE front-ends have the same bandwidth.
 $\Delta \tau $ is the code delay of
 ${y_A}$ relative to
 ${y_B}$. If the UE receiver is not spoofed, and if the receivers A and B are co-located, then
 $\Delta \tau $ is zero; otherwise,
 $\Delta \tau $ is nonzero and controlled by the spoofer. The case for a spatially separated receiver A and B can be generalised for this.
 ${\varphi _d}$ represents the carrier phase difference between the authentic and the spoofing signals.
The terms  ${n_A}$ and
 ${n_B}$ are the baseband receiver noise terms, which are assumed to be Gaussian, zero-mean, uncorrelated from sample to sample, and uncorrelated between the two receivers. Specifically, we use
 ${n_{A,I}}$and
 ${n_{A,Q}}$ to represent the noise of the in-phase and quadrature channel, respectively. The normalisation used to derive these equations assumes a unit variance for
 ${n_{A,I}}$,
 ${n_{A,Q}}$ and
 ${n_B}$, so they all have standard deviations equal to one.
The peak value of cross-correlation between  ${y_A}$ and
 ${y_B}$ for the in-phase channel can thus be computed by
 \begin{align} {\gamma _I} & =\sum\limits_{i = 1}^M {{y_{A,I}}{y_B}} = {T_\Delta }M\sqrt {4 \cdot CN{R_A} \cdot CN{R_B}} \cos {\varphi _d}\notag\\ & \quad + \sum\limits_{i = 1}^M {\left[ {{n_{A,I}} \cdot {n_B} + \sqrt {2CN{R_A} \cdot {T_\Delta }} {P_Y}\cos {\varphi_d}{n_B} + \sqrt {2CN{R_B} \cdot {T_\Delta }} {P_Y}{n_{A,I}}} \right]} \end{align}
and for the quadrature channel, we have
 \begin{align} {\gamma _Q} & =\sum\limits_{i = 1}^M {{y_{A,Q}}{y_B}} = {T_\Delta }M\sqrt {4 \cdot CN{R_A} \cdot CN{R_B}} \sin {\varphi _d}\notag\\ & \quad + \sum\limits_{i = 1}^M {\left[ {{n_{A,Q}} \cdot {n_B} + \sqrt {2CN{R_A} \cdot {T_\Delta }} {P_Y}\sin {\varphi_d}{n_B} + \sqrt {2CN{R_B} \cdot {T_\Delta }} {P_Y}{n_{A,Q}}} \right]} \end{align}
where M is the number of samples used for cross-correlation. It determines the coherent integration period by:  ${T_{ci}} = M \cdot {T_\Delta }$. So, the mean values of
 ${\gamma _I}$ and
 ${\gamma _Q}$ can be calculated by
 \begin{equation}\begin{array}{l} {\mu _{\gamma ,I}} = E[{{\gamma_I}} ]= 2{T_\Delta }M\sqrt {\textrm{CN}{\textrm{R}_A} \cdot \textrm{CN}{\textrm{R}_B}} \cos {\varphi _d}\\ {\mu _{\gamma ,Q}} = E[{{\gamma_Q}} ]= 2{T_\Delta }M\sqrt {\textrm{CN}{\textrm{R}_A} \cdot \textrm{CN}{\textrm{R}_B}} \sin {\varphi _d} \end{array}\end{equation}
and the variances are given by
 \begin{equation}\begin{array}{l} \sigma _{_{\gamma ,I}}^2 = \textrm{Var}[{{\gamma_I}} ]= M[{1 + 2{T_\Delta }({\textrm{CN}{\textrm{R}_A} \cdot {{\cos }^2}{\varphi_d}\textrm{ + CN}{\textrm{R}_B}} )} ]\\ \sigma _{_{\gamma ,Q}}^2 = \textrm{Var}[{{\gamma_Q}} ]= M[{1 + 2{T_\Delta }({\textrm{CN}{\textrm{R}_A} \cdot {{\sin }^2}{\varphi_d} + \textrm{CN}{\textrm{R}_B}} )} ]\end{array}\end{equation}
Note that the above analysis assumes the authentic signal is present. When the signal is not present, there will be no correlation peak. In this case, CNRA in the UE receiver is zero. The means and variances are computed by setting CNRA = 0 in (7) and (8). So,  ${\mu _{\gamma ,I}} = {\mu _{\gamma ,Q}} = 0$ and the variances of the in-phase and quadrature signals are identical, which is given by
 \begin{equation}\sigma _{H0}^2 = M[{1 + 2{T_\Delta }\textrm{CN}{\textrm{R}_B}} ]\end{equation}
Then, the correlation outputs  ${\gamma _I}$ and
 ${\gamma _Q}$ are divided by
 $\sigma _{H0}^2$ for re-normalisation. These re-normalised coherent integration results are
 \begin{equation}\begin{aligned} {\gamma _I} &= \sum\limits_{i = 1}^M {{y_{A,I}}{y_B}} /\sqrt {M[{1 + 2{T_\Delta }CN{R_B}} ]} \\ {\gamma _Q} &= \sum\limits_{i = 1}^M {{y_{A,Q}}{y_B}} /\sqrt {M[{1 + 2{T_\Delta }CN{R_B}} ]} \end{aligned}\end{equation}
When the P(Y) signal is absent, the coherent integration results  ${\gamma _I}$ and
 ${\gamma _Q}$ have means of zero and variances of one; otherwise, the means and variances are given by
 \begin{equation}\begin{array}{l} {\mu _{\gamma ,I}} = E[{{\gamma_I}} ]= 2{T_\Delta }\sqrt {M \cdot CN{R_A} \cdot CN{R_B}/({1 + 2{T_\Delta }CN{R_B}} )} \cos {\varphi _d}\\ {\mu _{\gamma ,Q}} = E[{{\gamma_Q}} ]= 2{T_\Delta }\sqrt {M \cdot CN{R_A} \cdot CN{R_B}/({1 + 2{T_\Delta }CN{R_B}} )} \sin {\varphi _d} \end{array}\end{equation}
And
 \begin{equation}\begin{array}{l} \sigma _{_{\gamma ,I}}^2 = \textrm{Var}[{{\gamma_I}} ]= \dfrac{{1 + 2{T_\Delta }({CN{R_A} \cdot {{\cos }^2}{\varphi_d} + CN{R_B}} )}}{{1 + 2{T_\Delta }CN{R_B}}}\\ \sigma _{_{\gamma ,Q}}^2 = \textrm{Var}[{{\gamma_Q}} ]= \dfrac{{1 + 2{T_\Delta }({CN{R_A} \cdot {{\sin }^2}{\varphi_d} + CN{R_B}} )}}{{1 + 2{T_\Delta }CN{R_B}}} \end{array}\end{equation}
Then, we have the averaged variance  $\sigma _\gamma ^2$ for each channel is
 \begin{equation}\sigma _\gamma ^2 = \frac{1}{2}({\sigma_{\gamma ,I}^2 + \sigma_{\gamma ,Q}^2} )= \frac{{1 + 2{T_\Delta }({(1/2)\textrm{CN}{\textrm{R}_A} + \textrm{CN}{\textrm{R}_B}} )}}{{1 + 2{T_\Delta }\textrm{ CN}{\textrm{R}_B}}}\end{equation}
4.2 Noncoherent accumulation and DP
After the coherent integration, the PDPC value is calculated by adding the corresponding individual correlation power values. The statistics for K combined correlograms are χ2 distributed.
4.2.1 H 0: signal-absent situation
We assume a fixed coherent integration time  ${T_{ci}}$, N noncoherent accumulations and K satellites. The final statistic for DP is given by
 \begin{equation}{\gamma _{{\rm DP}}} = \sum\limits_{k = 1}^K {\sum\limits_{n = 1}^N {({\gamma_{I,n,k}^2 + \gamma_{Q,n,k}^2} )} }\end{equation}
where the ‘n’ and ‘k’ subscripts here are used to indicate the k-th satellite and n-th noncoherent accumulation the coherent integration result belongs to. When the signal is absent,  $\textrm{CN}{\textrm{R}_A}$ is zero. Assuming
 ${\varphi _d}$ is 45°, the noncoherent integration results for a total of N noncoherent accumulations and K satellites combined are χ2 distributed with 2NK degrees of freedom. The probability density function (PDF) is given by
 \begin{equation}p({{\gamma_{{\rm DP}}}|{\textrm{H}_0}} )= \frac{{\gamma _{{\rm DP}}^{(\nu - 2)/2}\textrm{exp}({ - {\gamma_{{\rm DP}}}/2} )}}{{{2^{\nu /2}}\Gamma (\nu /2)}}\end{equation}
where v is the degree of freedom and Γ(⋅) is the Gamma function defined by  $\Gamma (u) = (u - 1)!$ when u is a positive integer. The χ2 cumulative distribution function for a given
 $\gamma $ and ν is
 \begin{equation}F({\gamma |{\textrm{H}_0}} )= \int_0^\gamma {\frac{{\gamma _{{\rm DP}}^{(\nu - 2)/2}exp ({ - {\gamma_{{\rm DP}}}/2} )}}{{{2^{\nu /2}}\Gamma ({\nu /2} )}}} d{\gamma _{{\rm DP}}}\end{equation}
So, the probability of false alarm (Pfa) can be calculated by
 \begin{equation}{P_{\textit{fa}}} = 1 - F({{\gamma_{{\rm th}}}|{\textrm{H}_0}} )\int_0^{{\gamma _{{\rm th}}}} {\frac{{\gamma _{{\rm DP}}^{(\nu - 2)/2}exp ({ - {\gamma_{{\rm DP}}}/2} )}}{{{2^{\nu /2}}\Gamma ({\nu /2} )}}d{\gamma _{{\rm DP}}}}\end{equation}
where  ${\gamma _{th}}$ is the preset threshold value. For a pre-set probability of false alarm Pfa,preset, such as 10−3, we can obtain the corresponding threshold value
 ${\gamma _{{\rm th}}}$ as follows:
 \begin{equation}{\gamma _{{\rm th}}} = \mathop {\arg }\limits_{{\gamma _{{\rm th}}} \in {\mathbb R}} \{{1 - F({{\gamma_{{\rm th}}}|{H_0}} )= {P_{\textit{fa},\textrm{preset}}}} \}\end{equation}
4.2.2 H1: signal-present situation
For a signal-present situation, the mean of the correlator outputs is nonzero. In a conventional receiver, after noncoherent integration, the correlation outputs for an individual satellite are noncentral χ2 distributed with 2N degrees of freedom for H1 hypothesis. The non-centrality parameter is equal to the normalised signal power (without noise). For the DP method, the PDPC values are noncentral χ2 distributed with 2KN degrees of freedom. The non-centrality parameter can be calculated by
 \begin{equation}\lambda = \sum\limits_{k = 1}^K {\sum\limits_{n = 1}^N {({\mu_{\gamma ,I,n,k}^2 + \mu_{\gamma ,Q,n,k}^2} )} }\end{equation}
where the ‘n’ and ‘k’ subscripts indicate that the mean value corresponds to the n-th noncoherent accumulation segment and the k-th satellite, respectively. Thus, the PDF in the circumstance of H1 is given by
 \begin{equation}p({{\gamma_{{\rm DP}}}|{\textrm{H}_1}} )= \frac{1}{{2\sigma _\gamma ^2}}{\left( {\frac{{{\gamma_{{\rm DP}}}}}{\lambda }} \right)^{(\nu - 2)/4}}exp \left( { - \frac{{{\gamma_{{\rm DP}}} + \lambda }}{{2\sigma_\gamma^2}}} \right){I_{\frac{\nu }{2} - 1}}\left( {\frac{{\sqrt {{\gamma_{{\rm DP}}}\lambda } }}{{\sigma_\gamma^2}}} \right),{\gamma _{{\rm DP}}} \ge 0\end{equation}
where  ${I_x}(y)$ is the modified Bessel function of the first kind defined by
 \begin{equation}{I_x}(y) = {(y/2)^x}\sum\limits_{j = 0}^\infty {\frac{{{{({{y^2}/4} )}^j}}}{{j!\Gamma (x + j + 1)}}}\end{equation}
Thus, for a given threshold  ${\gamma _{th}}$, the probability of detection (Pd) can be computed by
 \begin{equation}{P_d} = \int_{{\gamma _{th}}}^\infty {p({{\gamma_{{\rm DP}}}|{H_1}} )d{\gamma _{{\rm DP}}}}\end{equation}
The obtained Pd is then used to analyse the theoretical performance in the following subsection.
4.3 Theoretical performance
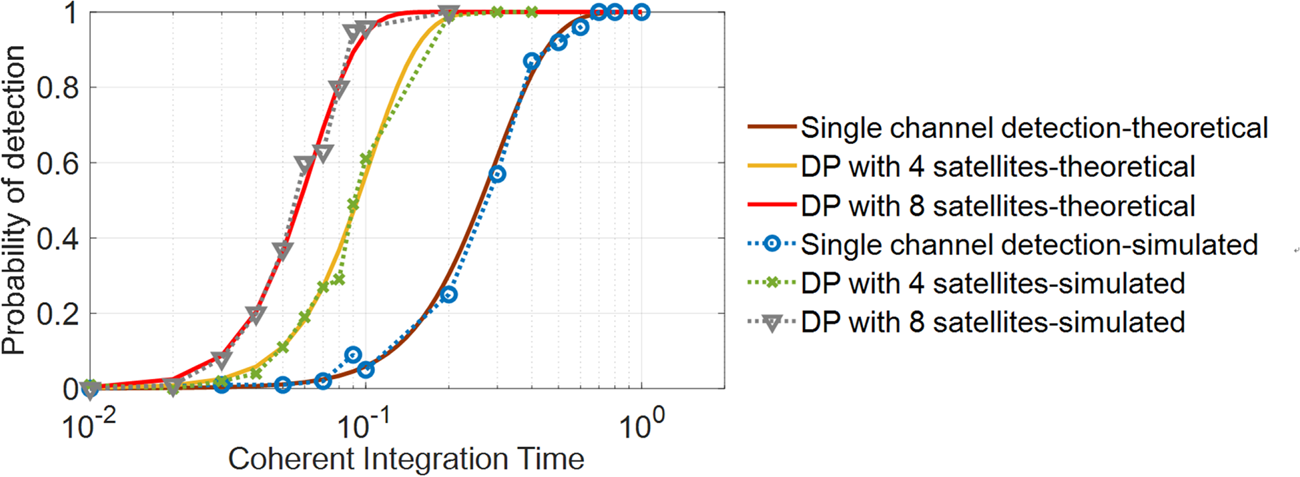
Figure 4 illustrates the theoretical detection performance of the conventional single-channel detection method (DRCMS) and the DP methods with four and eight visible satellites. The theoretical results are further verified and compared with the results of Monte Carlo simulation. The C/N0 of the received signal and the Q channel signal from the RS are both set to 40 dB-Hz. To facilitate comparison with the results in Psiaki et al. (Reference Psiaki, O'Hanlon, Bhatti, Shepard and Humphreys2013a), the sampling rate used here is about 5⋅7 MHz, which is consistent with those results. P fa is 1e−4. The number of noncoherent accumulations is one. The coherent integration time Tci varies from 10−2 to 1 s. We can see that the simulation curves are consistent with the corresponding theoretical curves.
Performance comparison between the DP method and the conventional single-channel detection with P(Y) code for spoofing detection

More importantly, the DP techniques combining four and eight satellites both outperform the DRCMS method. In general, the signal bandwidth needs to be sufficient to recover energy from the Q channel signal. For the P(Y) code, a bandwidth of 10 to 20 MHz is desirable. When a narrowband RF front-end is used (5⋅7 MHz here), the P(Y) code can be attenuated by several dB and distorted. As the proposed method jointly employs the energy from multiple visible satellites, the effect of a narrowband RF front-end can be relieved compared with the conventional DRCMS method and also the recovery capability of UE receiver from spoofing is enhanced.
DRCMS works in the tracking loop of each visible satellite. When spoofing signals are detected, it only recovers the tracking loop of each authentic signal, but not the position parameters of the UE. As a by-product, our DP-enhanced method is able to directly recover the true position solution of UE.
In addition, Figure 4 shows that Pd goes up accordingly as the number of the visible satellites gets larger. For a fixed Pd, the required Tci is reduced. For example, for Pd of 90%, the required Tci is larger than 0⋅5 s for the conventional DRCMS method, whereas for DP with eight visible satellites, only 0⋅09 s of coherent integration is required.
The value of CNRB also affects significantly the detection performance of the proposed method. However, the 40 dB-Hz used above is a very conservative value for real applications. RSs are generally equipped with high-grade antennas that can provide higher CNRB. And with the increase of CNRB, the total performance of the methods evaluated in the Figure 4 will be further boosted.
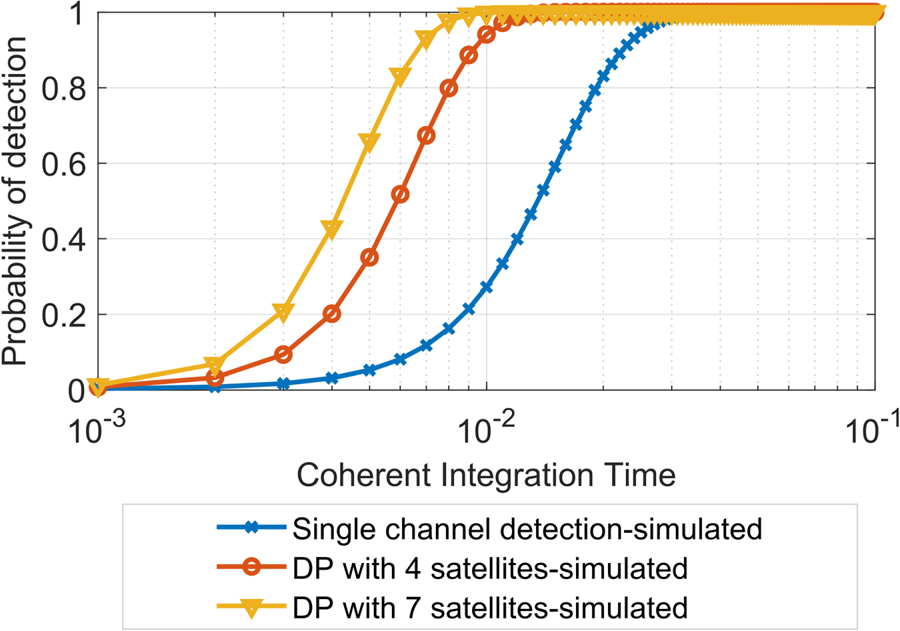
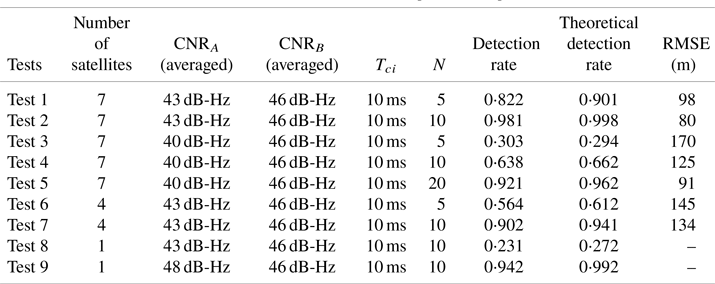
Considering the hardware experiments in the next section, a sampling rate of 16⋅3676 MHz was employed, which is determined by the signal sampler. For a convenient comparison, we replace the sampling rate of 5⋅7 MHz with 16⋅3676 MHz in the theoretical performance analysis to obtain synthetic results. Figure 5 shows the results with totals of one, four and seven visible satellites used for detection. CNRA and CNRB are set to 43 dB-Hz and 46 dB-Hz, respectively. The false alarm probability P fa is set at 10−3 with N = 10. The probabilities of detection of some important points on the curves are also presented in Table 2 for comparison against actual detection rates.
Spoofing detection performance using parameter setting identical to hardware-based validation experiments

4.4 Squaring loss of the DP method
When KN is far larger than one, the squaring loss will be non-negligible. The value of squaring loss is empirically approximated by (Borio and Akos, Reference Borio and Akos2009)
 \begin{equation}L = 10\log_{10}\sqrt {KN} - 5.5\;\textrm{dB}\end{equation}
To keep the squaring loss acceptable, for a fixed K, the number of noncoherent accumulations, N, must not be too large; accordingly, the coherent correlation period Tci should be prolonged to achieve the required performance gain.
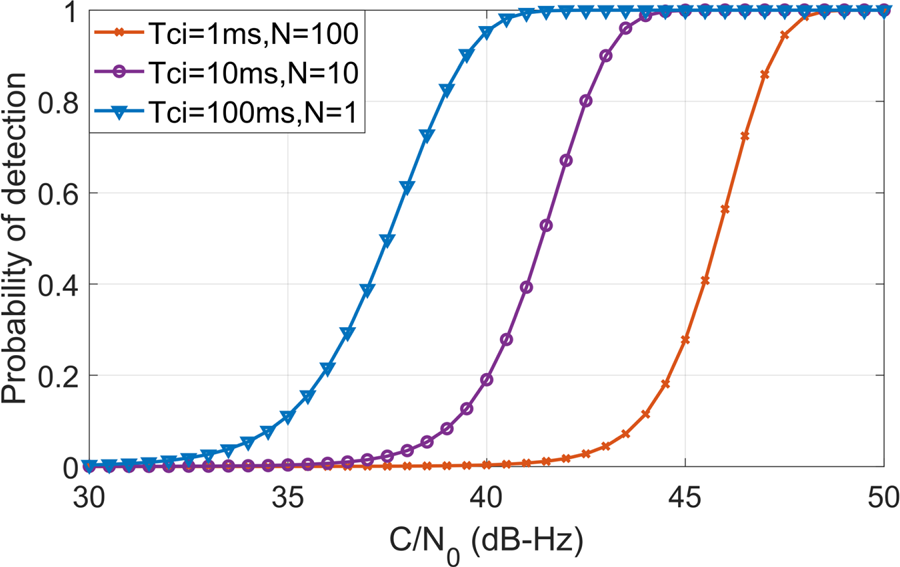
Figure 6 illustrates the effect of the squaring loss given the same signal snapshot. Three different combinations of coherent/noncoherent integration period are compared, and the total data lengths for the three cases are all fixed at 100 milliseconds. Eight satellites are employed for DP. The C/N0 of the UE receiver, CNRA, varies from 20 to 40 dB-Hz with a fixed CNRB of 40 dB-Hz. It can be seen that there is about 8 dB performance difference between the combination (Tci = 1 ms, N = 100) and (Tci = 100 ms, N = 1).
Comparison of Pd in the condition of different combinations of coherent/noncoherent integration times

In practical applications, however, the coherent correlation time Tci cannot be prolonged indefinitely. It is limited by two main factors. The first factor is high dynamics. The fast-changing Doppler frequency prevents the use of long coherent integration period. As seen in Figure 4, the proposed method substantially reduces the required coherent integration period to achieve the same performance as DRCMS, making it more suitable for higher dynamics.
The second factor is the carrier phase instability of the Q channel signal from the RS. Considering the noise of the carrier tracking loop of the RS and the asynchronisation of the reference and UE receivers, the relative carrier phase between the two signals may change constantly. If Tci is too large, extra correlation loss is produced. It is thus necessary to balance the selection of Tci and N in real applications basing on specific RS receiver, UE dynamic and the received signal strength.
5. Hardware-based validation experiments
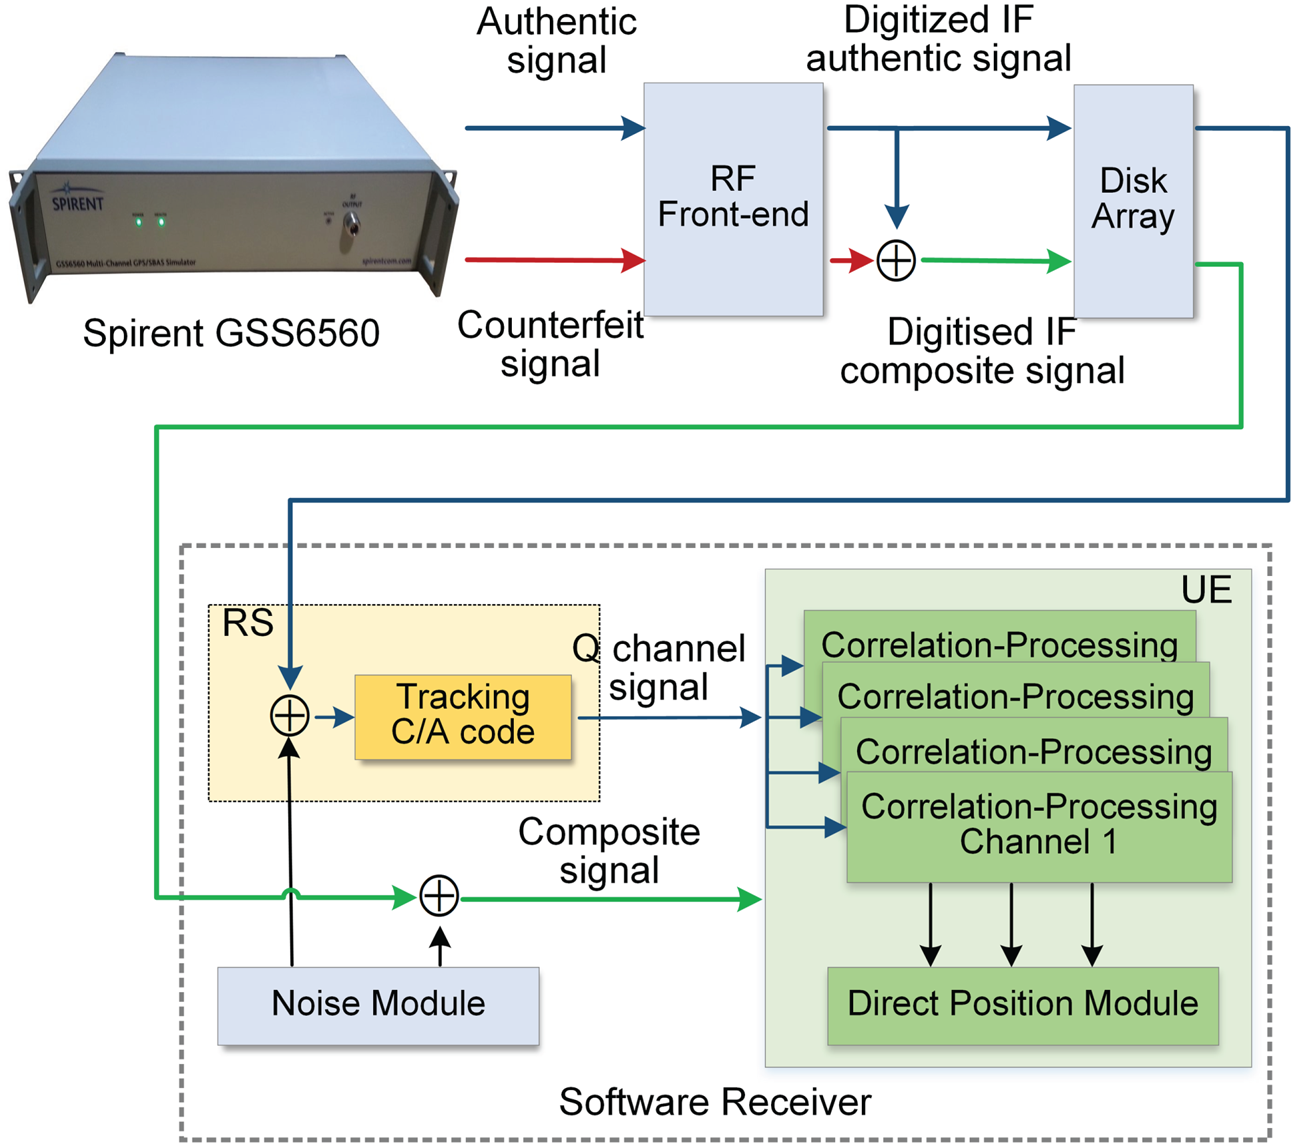
To evaluate the performance, the proposed position domain anti-spoofing algorithm was implemented and tested on a self-made dataset generated by a GNSS signal simulator. The experiment setup is shown in Figure 7. The GPS signal simulator GSS6560 was configured to deliver two sets of signals: authentic signals and counterfeit signals. They are both GPS L1 signals from seven visible satellites. The signals were collected by a high-speed data collector, down-converted to the digitised IF samples and stored in a disc array. The authentic and counterfeit signals are added together to represent the composite signals reaching the UE receiver. The anti-spoofing algorithm runs in a software-defined receiver in an off-line mode. Prior to processing, the raw samples of both the authentic and composite signals are mixed respectively with a certain level of additive white Gaussian noise generated by a noise module. Then the secure RS module tracks the raw samples of the authentic signals and outputs the quadrature components. Finally, both the RS and the UE signals are sent to the DP module to verify the proposed anti-spoofing algorithm.
Setup of the experiments. The algorithms running inside the RS and UE receiver are both implemented in a software receiver

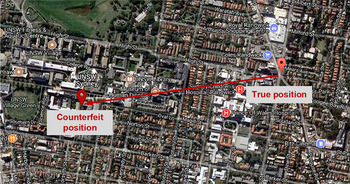
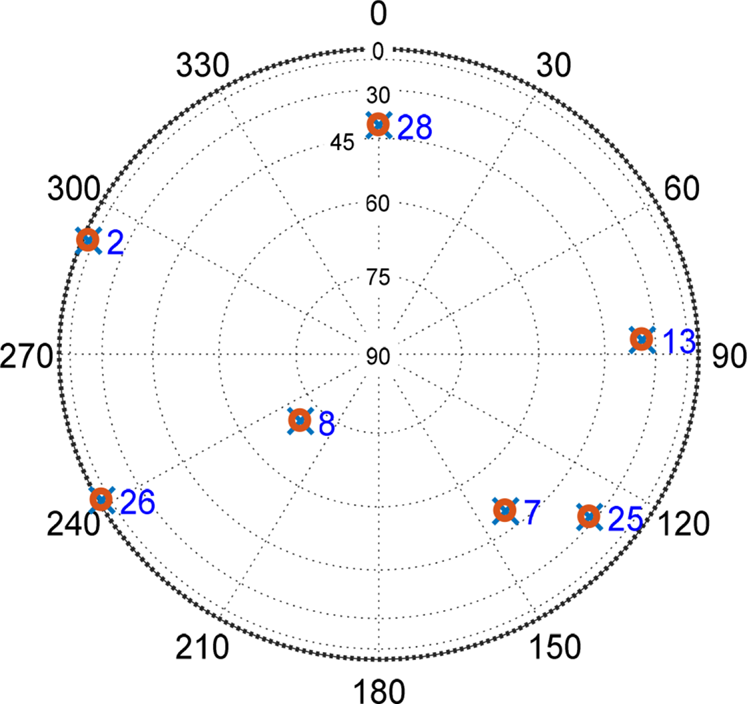
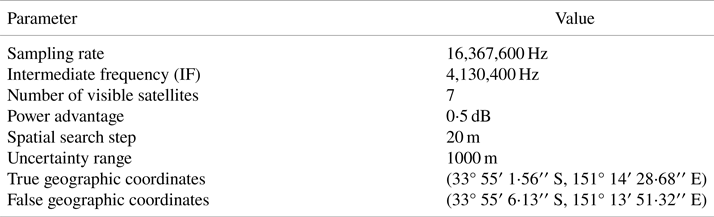
Table 1 shows the parameter settings of the tests. The power advantage of the spoofing signals over corresponding authentic signals is 0⋅5 dB, i.e., it is a matched-power spoofing attack. The spatial search step is set to 20 m and the uncertainty range is 1 km. The authentic location (33° 55′ 1⋅56′′ S, 151° 14′ 28⋅68′′ E) of the UE receiver is in the northeast of the Kensington campus of the University of New South Wales (UNSW), Sydney. When the UE receiver is spoofed, it will output a counterfeit location (33° 55′ 6⋅13′′ S, 151° 13′ 51⋅32′′ E) near the UNSW Village Green, as shown in Figure 8. Figure 9 illustrates the satellite geometry of our dataset. In total, seven satellites can be observed with a geometric dilution of precision of around 2⋅25.
The predetermined true and counterfeit location coordinates, which are near the Kensington campus of the University of New South Wales (UNSW), Sydney

‘Sky view’ from the receiver perspective. In total, seven satellites are observed

Setting of the experiment parameters

The sampling rate of the data collector is 16 f 0 MHz, which corresponds to a bandwidth of 16 f 0 MHz, where f 0 is the fundamental frequency of 1⋅023 MHz. Typically, RS has superior setup using a relatively expensive wideband front-end in practical application. For UE, the bandwidth of a mass-market receiver is typically smaller than 4 MHz. However, considering more and more mass-market receivers with wideband front-ends will become available in the future to accommodate the wider bandwidth E1 signals, it is also reasonable to assume the UE has a front-end bandwidth wider than 4 MHz. Thus, a 16 f 0 MHz bandwidth is employed for both UE and RS receivers in the hardware-based validation experiments of this paper.
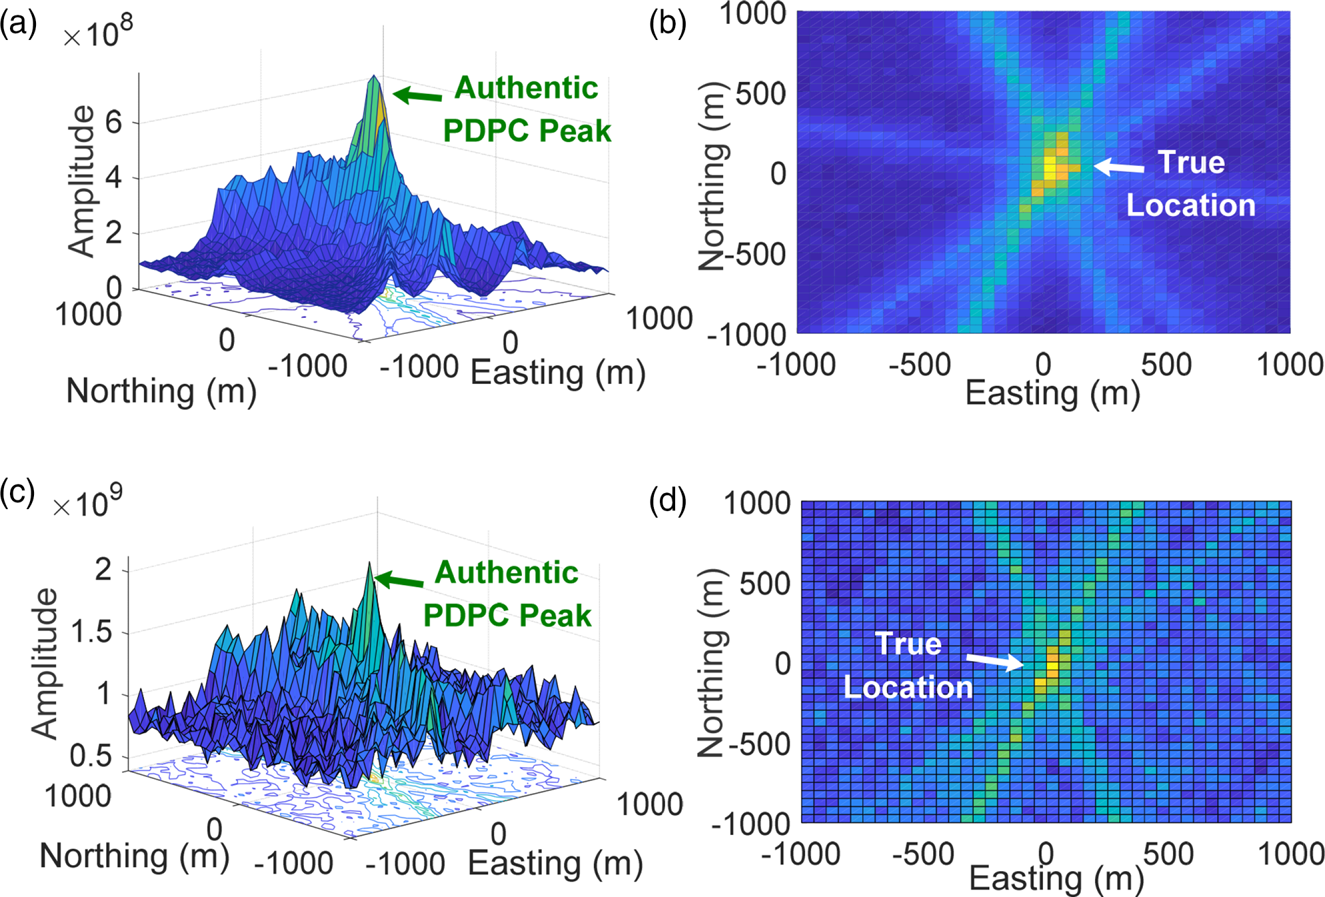
Figure 10 shows the PDPC for a spoofed UE using our proposed method. Its parameter settings remain consistent with those in Figure 1. There are seven visible satellites used, with 10 ms coherent integration period, and 10 noncoherent rounds. The C/N0 of received signals in Figure 9 is set to 40 and 45 dB-Hz, respectively.
PDPC using the proposed method in Figure 3 for a spoofed receiver: (a) a strong C/N0 situation with CNRA = 45 dB-Hz, (b) top view; (c) a nominal C/N0 situation with CNRA = 41 dB-Hz, (d) top view. The CNRB of the Q channel component from the RS is 46 dB-Hz. Compared with the ambiguous peaks of Figure 1, which uses only the C/A code, the method illustrated here used the Q channel from RS to produce the unambiguous peak shown here

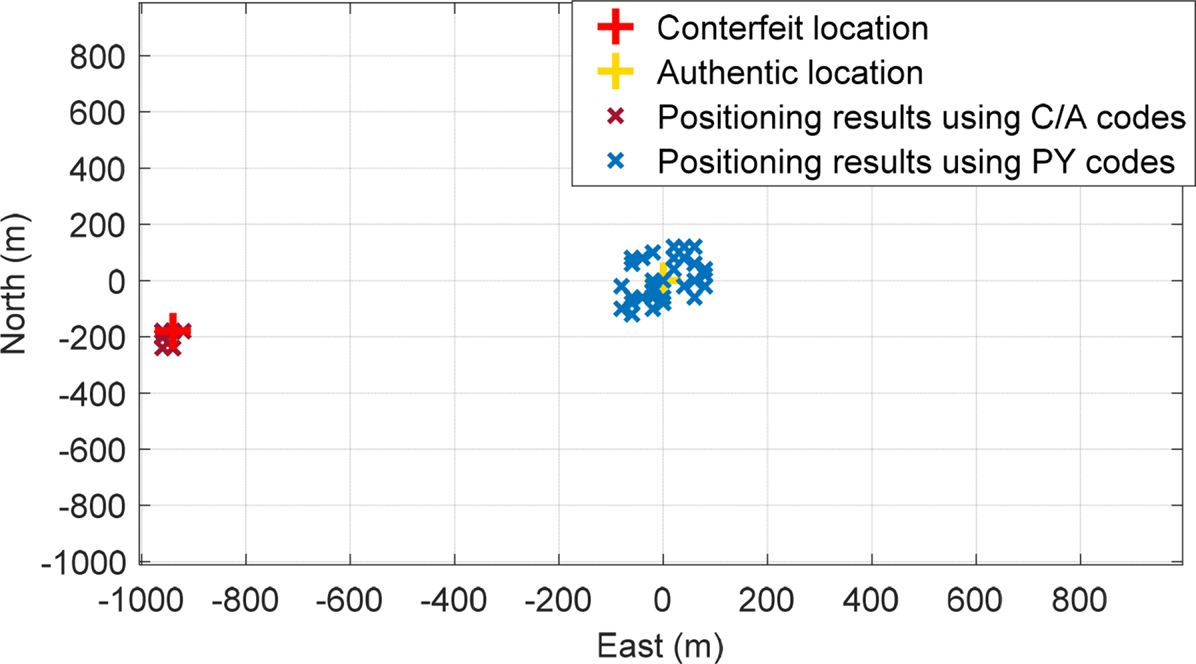
In Figure 1, the spoofer is trying to spoof the UE from its true location (0, 0) to (−940, −180). Using a conventional C/A code-based DP processing, it is almost impossible to differentiate between the true position and the counterfeit position. However, as shown in Figure 10, the counterfeit PDPC peak disappears, leaving only one PDPC peak corresponding to the true UE location. The ambiguous C/A code-based PDPC result obtained in Figure 1 is thus mitigated when our proposed anti-spoofing algorithm is used.
Just as mentioned previously, the noise level significantly affects the detection of the PDPC peak when using the Q channel of the RS for cross-correlation. When under strong signal conditions, as shown in Figure 10(a) and (b), the PDPC peak is very sharp. While under nominal signal strength environments, such as 40 dB-Hz in Figure 10(c) and (d), the peak is still sufficiently discernible to identify the true location from the PDPC peak. For much weaker signal conditions, the coherent integration period needs to be increased, or the more visible satellites need to used.
Table 2 illustrates the comparison between the theoretical detection probability computed by Equation (21) and that obtained by tests with the above dataset. Each test has been repeated for 103 trials. The false alarm probability Pfa is set at 10−3. CNRB is uniformly set to 46 dB-Hz, which is a good but reasonable signal strength for a reference station equipped with a high-grade antenna. We can see that the experimental results of different tests match the theoretical detection rates computed using the equations in the previous section. For most tests, the detection rate obtained by experiment is slightly smaller than the corresponding theoretical result. That is because there is always a processing loss when using a realistic dataset.
Detection rate under various experimental parameters

Tests 1–5 show the results with a total of seven visible satellites used for detection. CNRA is set to a higher value of 43 dB-Hz and a lower value of 40 dB-Hz, respectively. The result of Test 2 demonstrates that when CNRA = 43 dB-Hz and CNRB = 46 dB-Hz, the detection rate of our proposed method can be larger than 0⋅95 for the coherent integration period Tci of 10 ms and noncoherent accumulation number N of 10, which shows good detection sensitivity. When CNRA drops to 40 dB-Hz, the detection rate also decreases. To achieve a detection rate of larger than 0⋅9, the noncoherent accumulation number N needs to be a larger value, e.g., 20 in the Test 5.
In Tests 6 and 7, only signals from four satellites are employed for DP and other parameters are kept identical with Tests 1 and 2, respectively. The pseudo-random noise (PRN) numbers used are 2, 13, 26 and 28. It can be seen that the detection rates of Tests 6 and 7 are both smaller than the results of Tests 1 and 2. That implies that, when more visible satellites are present, the overall performance of the proposed method will be improved, which supports the conclusion in Figure 4.
For comparison, the detection rate of the conventional single-channel detection method, i.e., the DRCMS method, is also presented in Tests 8 and 9. PRN 2 alone was used for spoofing detection in the two tests. The experiment parameter of Test 8 is identical with Test 2. We can see the actual detection rate is just larger than 0⋅2, which is much smaller than the detection rate in Test 2 (0⋅981). In Test 9, the required CNRA has to rise to 48 dB-Hz to achieve the same theoretical detection rate of 0⋅99 in Test 2. Thus, it is clearly shown that the DP-enhanced DRCMS method which combines seven visible satellites helps boost the detection performance by at least 5 dB. It outperforms the conventional single-channel-based method (DRCMS method) under weak signal scenarios, making the proposed method more feasible in actual applications.
To visualise the positioning accuracy of conventional DP against the proposed method, Figure 11 shows 50 positioning results using C/A codes and the proposed method, respectively. The parameter setting is identical to Test 1 in the Table 2. It is clear that the conventional C/A code-based UE receiver will output positioning results near the counterfeit location, indicating successful spoofing; whereas the proposed method produces position solutions near the authentic UE location. The root mean square error (RMSE of positioning results for this method is around 98 m, despite being spoofed. Though the positioning accuracy is not high enough, it still provides a coarse but correct positioning result. This PDPC-recovered coarse positioning solution is used to re-initialise the UE tracking loop C/A code phases to track the authentic signals.
Positioning results using C/A codes and Q channel signals under a spoofing attack

Additionally, we further evaluate the RMSE of positioning error using RS Q channel signals for all scenarios in Table 2. The conventional DRCMS method cannot give positioning results directly, because the method operates on a channel-by-channel basis. So, the RMSE values of Tests 8 and 9 are not evaluated. We can see that when CNRA or the number of satellites is smaller, the corresponding RMSE value will increase.
It is worth noting that the proposed method aims to recover authentic GPS L1 signals under spoofing using dual receiver DP. When the raw authentic position coordinates are obtained, a more accurate positioning solution can be calculated by using conventional scalar tracking loop or a C/A code-based DP module. That means once the authentic PDPC peak is identified successfully, the effect of a spoofing attack is then mitigated. The final positioning accuracy after mitigation depends on the specific implementation of a conventional C/A-based UE receiver but that is not the focus of this paper. As the proposed method does not specify the specific receiver structure to obtain this final positioning solution, the positioning accuracy after spoofing mitigation is not given here.
6. Conclusion
This research developed an anti-spoofing technique based on position domain signal processing. The DP method is successfully combined with the dual receiver correlation technique of military signals to identify the true UE location and help the UE receiver to retrieve its positioning and navigation abilities. Unlike the existing technique, the proposed method allows spoofing identification to be carried out even when none of the tracking loops are in lock, and in addition, it is able to identify the authentic components from the counterfeit components if given sufficient vestigial signal strength, leading to successful spoofing mitigation. The performance has been evaluated theoretically and validated using a hardware-based experiment. Validation results demonstrate that when the UE CNR is 43 dB-Hz and the RS CNR is 46 dB-Hz, the signal snapshot needs to be no longer than 100 ms to achieve a detection rate of 0⋅98. Compared with the conventional DRCMS method, it can be seen that the proposed method helps boost the detection of the authentic signal by around 5 dB, improving its noise robustness.
Acknowledgements
This work was supported by the Youth Programme of National Natural Science Foundation of China (NSFC) with No.62001015, the China Postdoctoral Science Foundation with No. 2020M670095, and the Australian Research Council (ARC) Linkage Funding with LP140100252.