The unprecedented expansion of tertiary education in the past decades in China directs scholars' attention to the extent of disparity in people's access to college entrance opportunities. A recently published research note by Wang Xiaobing, Chengfang Liu, Linxiu Zhang, Yaojiang Shi and Scott Rozelle joined this strand of studies.Footnote 1 Using a census survey of all incoming freshmen at four colleges, Wang and colleagues show that poor, minority, rural and female students are under-represented in these colleges relative to their corresponding shares in government-generated census data, which drive them to the conclusion that “college is a rich, Han, urban, male club.”
The research tool used in Wang, Liu, Zhang, Shi and Rozelle's article is the relative disparity index (RDI). This index compares the share of a specific group (e.g. female students) in college entrants with the share of the same group in a reference population. As noted by Wang and colleagues, an RDI with value larger than 1 suggests over-representation of a specific group while a value less than 1 indicates a case of under-representation. Although the RDI has been widely used in disparity evaluation, there are still several caveats which deserve serious attention. These caveats, nevertheless, are not fully addressed in Wang et al., leading to some non-ignorable limitations in their empirical findings. The purpose of this commentary is to elaborate these caveats in detail, point out the limitations in the study of Wang and colleagues, and reassess the disparity in access to tertiary education using an improved analytical strategy.
Caveats in Using the Relative Disparity Index and an Improved Analytical Strategy
As noted above, the RDI is computed by the ratio of two shares (denoted as r1/r2). In Wang et al., the numerator r1 denotes the shares of poor, rural, female and minority students among all incoming freshmen at four colleges, and the denominator r2 serves as the corresponding shares in a reference population, that is, the nation's total 14- to 22-year-old population. The value of the RDI informs us whether these two shares are the same, thus shedding light on the extent of disparity in the college entrance process across socio-demographic groups. Bearing in mind these merits, there is still room for further refinement in the RDI.
With regard to r1, defining r1 as the share of a specific group in the incoming freshmen of only four colleges, as in Wang et al., seems insufficient to reveal the overall socio-demographic disparity in access to higher education in China. That is because high school graduates can choose higher education institutions across the country. For example, a high school graduate in Sichuan province does not have to attend a local college, and colleges in Sichuan do not necessarily recruit only students from Sichuan either. Such a student mobility suggests that an RDI less than 1 in one college might be compensated by an RDI larger than 1 in another college, and vice versa. Therefore, the RDI based on a limited number of colleges is not sufficient to uncover the extent of disparity in the recruitment process of college students in general. Comparatively, a more appropriate analytical strategy is to analyse the share of a specific group within all college students. This strategy, directing us to using the nationwide representative survey data, handles the challenge of high school graduate mobility.
Besides r1, the meaning of the reference population r2 deserves further refinement. In the research of college enrolment disparity, the reference population can be reasonably defined as the “exposure population” to higher education, that is, persons who are exposed to the opportunity of attending college. Individuals in the exposure population are de facto “candidates” for colleges, and whether or not they can finally get into college depends on the college selection process. In this light, change in the share of a specific group (e.g. the female) between the exposure population and college entrants can be largely attributed to the college enrolment process. Therefore, this definition of the reference population serves well in revealing the extent of disparity in access to higher education. In their article, Wang and colleagues restrict the reference population to be an age-comparable group with college freshmen, that is, the 14- to 22-year-old population. This operation is desirable because persons within this age interval are very likely to be exposed to the opportunity of attending college, relative to individuals at an earlier or later stage across the life course. However, this age-only restriction seems insufficient. Following Mare's classic educational transition theory, an exposure population for a specific stage of education should be those at the immediately previous stage.Footnote 2 Therefore, the exposure population for the study of access to higher education should be high school graduates. This makes practical sense because only high school attendees face the decision of whether or not to attend college. In contrast, not all of the individuals aged between 14 and 22 attend high school (e.g. high school dropouts). Thus, only performing age restriction in computing the RDIs may incur serious inaccuracy.
In summary, several caveats are associated with the RDI-based analytical strategy and, without further specification and refinement, the findings shown in Wang et al. should be interpreted with caution. In order to better understand the extent of disparity in access to higher education in contemporary China, the RDI should be examined based on a nationwide survey which potentially covers all college students. Besides, the reference population should be further restricted to high school graduates as they are those individuals who are directly exposed to the opportunity of attending college. Keeping these caveats in mind, I draw on the 2010 Chinese General Social Survey (CGSS) data and re-evaluate the extent of college entrance inequality.
Data, Measures and Methodology
The CGSS 2010 data adopts a four-stage clustering sampling design, which covers 2,801 county-level administrative units across 22 provinces. In order to refine the reference population as mentioned above, I restrict our cases to those who are aged between 14 and 22 (following Wang et al.) and at least have finished high school education. The final sample size used for our analysis is 398. One noticeable concern is the small sample size. In theory, whether or not a sample size is sufficient depends on the statistical power of the analytical model. According to the results of supplementary statistical power analysis, the following analysis does not suffer from the small-sample problem.Footnote 3
In order to assess the general disparity in access to higher education, I use a comprehensive measure of college education including both regular colleges (putong benke 普通本科) and junior colleges (zhuanke 专科). The socio-demographic characteristics are the same as in Wang et al., including gender (1 = female; 0 = male), ethnicity (1 = Han; 0 = minorities), the household economic status when the respondent is at age 14 (self-reported scores from 1 to 10), and household registration status (1= urban; 0 = rural).Footnote 4
The following analysis consists of two parts. The first part computes the descriptive RDIs. The second part looks further into how these socio-demographic factors affect the likelihood of attending college using a logistic regression model.
Findings
The values of the RDIs based on the CGSS 2010 can be found in Table 1. Seeing the row of the relative disparity index, I find female students are under-represented while Han, rich and urban students are over-represented in all college students in the sample.Footnote 5 Thus, the descriptive findings shown in Table 1 lend support to Wang et al.
Table 1:Relative Disparity Indexes
However, the focus of this study is to investigate the population-level disparity in access to higher education in China. Thus, the descriptive findings of the RDIs based on one CGSS sample might be subject to sampling errors. This problem might also exist in Wang and colleagues' research, where only four colleges are examined. In order to solve this problem, I conduct statistical inference using Chi square test and groupwise t-test. The results, as shown in Table 1, suggest that only household registration status is statistically significant. In other words, the RDI values for gender, ethnicity, and economic status are very likely to be different (either larger or less than 1) if a new sample is collected.
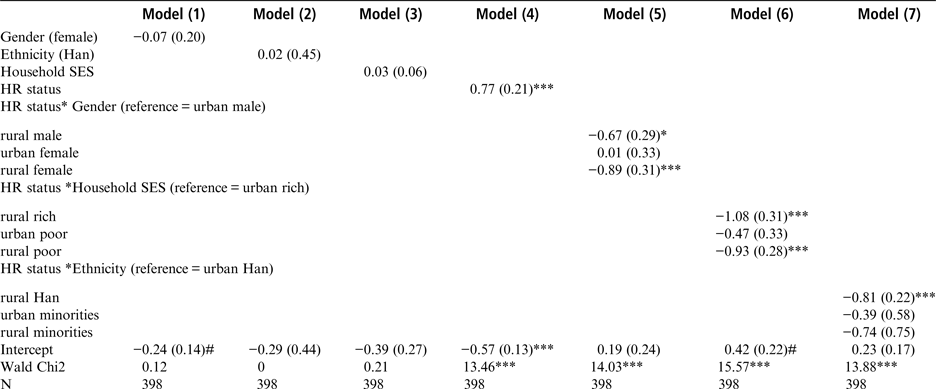
The results of the logistic regression models shown in Table 2 consolidate the above findings (model (1) through model (4)). Of these four socio-demographic factors, only household registration status is statistically significant. Besides, since an interaction effect between socio-demographic factors is detected (e.g. poor, rural, minority women are the most under-represented) in Wang et al., I study the interaction effect as well. The findings are presented in model (5) through model (7). Unlike Wang et al., no significant interaction effect between socio-demographic factors is found.
Table 2:Results of logistic regression
In summary, although the descriptive findings based on the CGSS 2010 lend support to Wang et al., results of statistical inference suggest that only urban–rural disparity in access to higher education is substantiated.
Conclusion and Discussion
Enlightened by the study conducted by Wang et al., this commentary addresses some potential caveats in using the relative disparity index to evaluate the disparity in access to higher education. Based on these discussions, I point out the limitations existing in the empirical study of Wang and colleagues, and reassess the extent of disparity in college education opportunities in contemporary China using a nationwide representative survey data. I find that only household registration status is significantly associated with the likelihood of attending college, while gender, economic status, and ethnicity are not. These findings indicate that the descriptive RDIs regarding gender, economic status, and ethnicity are subject to sampling errors. Since only four colleges are examined in Wang et al., such a sampling error might also exist in their study.
I close this commentary with reflections on a widely taken approach in examining the disparity in access to higher education. This approach can be termed the “language of disproportionality,” where a disproportionate share of a certain type of individuals among college students relative to their share in a reference population is viewed as evidence for an unequal distribution of higher education resources. The research of Wang and colleagues, by using the RDIs, largely follow this line of thought. My question, here, is whether or not disproportionality necessarily indicates the need for the reform of the higher education system. Generally speaking, a disproportionate share of a specific socio-demographic group in college students might be attributed to (1) an unfair institutional arrangement in the college recruitment process which benefits disproportionately a certain type of students; or (2) the overlapping between socio-demographic characteristics and the desirable attributes for college entrance such as a high score in the college entrance exam. The distinction between these two causes can be illustrated by an example: a disproportionately high share of urban students in college freshmen might be observed if colleges have a lower extent of selectivity for urban high school graduates, or, urban high school graduates, on average, have higher scores in the national college entrance exam relative to the rural counterparts.
Distinguishing these two causes for an observed disproportionality pattern is of great importance for relevant higher education policies. On the one hand, if it is mainly unfair institutional arrangements that give rise to a disproportionality pattern, the focus of equality-enhancing higher education policy, evidently, should be set on the reform of the college system. On the other hand, if a disproportionality pattern is mainly established through the socio-demographic differentiation in the likelihood of attending college, more policy attention should be paid to the improvement in egalitarianism of pre-tertiary, especially high school, education resources. In the latter case, the higher education enrolment system per se does not have to be changed. In sum, a disproportionality pattern does not necessarily mean that the college recruitment process per se is problematic or unfair. This point of view, however, does not get the attention it deserves. In Wang et al. and many other studies, disproportionality has always been tied to the necessity for reforming the higher education system (e.g. raising the quota for rural residents). This policy suggestion might be proposed too hastily without meticulously distinguishing the detailed causes for an observed disproportionality pattern.






 You have
Access
The unprecedented expansion of tertiary education in the past decades in China directs scholars' attention to the extent of disparity in people's access to college entrance opportunities. A recently published research note by Wang Xiaobing, Chengfang Liu, Linxiu Zhang, Yaojiang Shi and Scott Rozelle joined this strand of studies.Footnote 1 Using a census survey of all incoming freshmen at four colleges, Wang and colleagues show that poor, minority, rural and female students are under-represented in these colleges relative to their corresponding shares in government-generated census data, which drive them to the conclusion that “college is a rich, Han, urban, male club.”
The research tool used in Wang, Liu, Zhang, Shi and Rozelle's article is the relative disparity index (RDI). This index compares the share of a specific group (e.g. female students) in college entrants with the share of the same group in a reference population. As noted by Wang and colleagues, an RDI with value larger than 1 suggests over-representation of a specific group while a value less than 1 indicates a case of under-representation. Although the RDI has been widely used in disparity evaluation, there are still several caveats which deserve serious attention. These caveats, nevertheless, are not fully addressed in Wang et al., leading to some non-ignorable limitations in their empirical findings. The purpose of this commentary is to elaborate these caveats in detail, point out the limitations in the study of Wang and colleagues, and reassess the disparity in access to tertiary education using an improved analytical strategy.
Caveats in Using the Relative Disparity Index and an Improved Analytical Strategy
As noted above, the RDI is computed by the ratio of two shares (denoted as r1/r2). In Wang et al., the numerator r1 denotes the shares of poor, rural, female and minority students among all incoming freshmen at four colleges, and the denominator r2 serves as the corresponding shares in a reference population, that is, the nation's total 14- to 22-year-old population. The value of the RDI informs us whether these two shares are the same, thus shedding light on the extent of disparity in the college entrance process across socio-demographic groups. Bearing in mind these merits, there is still room for further refinement in the RDI.
With regard to r1, defining r1 as the share of a specific group in the incoming freshmen of only four colleges, as in Wang et al., seems insufficient to reveal the overall socio-demographic disparity in access to higher education in China. That is because high school graduates can choose higher education institutions across the country. For example, a high school graduate in Sichuan province does not have to attend a local college, and colleges in Sichuan do not necessarily recruit only students from Sichuan either. Such a student mobility suggests that an RDI less than 1 in one college might be compensated by an RDI larger than 1 in another college, and vice versa. Therefore, the RDI based on a limited number of colleges is not sufficient to uncover the extent of disparity in the recruitment process of college students in general. Comparatively, a more appropriate analytical strategy is to analyse the share of a specific group within all college students. This strategy, directing us to using the nationwide representative survey data, handles the challenge of high school graduate mobility.
Besides r1, the meaning of the reference population r2 deserves further refinement. In the research of college enrolment disparity, the reference population can be reasonably defined as the “exposure population” to higher education, that is, persons who are exposed to the opportunity of attending college. Individuals in the exposure population are de facto “candidates” for colleges, and whether or not they can finally get into college depends on the college selection process. In this light, change in the share of a specific group (e.g. the female) between the exposure population and college entrants can be largely attributed to the college enrolment process. Therefore, this definition of the reference population serves well in revealing the extent of disparity in access to higher education. In their article, Wang and colleagues restrict the reference population to be an age-comparable group with college freshmen, that is, the 14- to 22-year-old population. This operation is desirable because persons within this age interval are very likely to be exposed to the opportunity of attending college, relative to individuals at an earlier or later stage across the life course. However, this age-only restriction seems insufficient. Following Mare's classic educational transition theory, an exposure population for a specific stage of education should be those at the immediately previous stage.Footnote 2 Therefore, the exposure population for the study of access to higher education should be high school graduates. This makes practical sense because only high school attendees face the decision of whether or not to attend college. In contrast, not all of the individuals aged between 14 and 22 attend high school (e.g. high school dropouts). Thus, only performing age restriction in computing the RDIs may incur serious inaccuracy.
In summary, several caveats are associated with the RDI-based analytical strategy and, without further specification and refinement, the findings shown in Wang et al. should be interpreted with caution. In order to better understand the extent of disparity in access to higher education in contemporary China, the RDI should be examined based on a nationwide survey which potentially covers all college students. Besides, the reference population should be further restricted to high school graduates as they are those individuals who are directly exposed to the opportunity of attending college. Keeping these caveats in mind, I draw on the 2010 Chinese General Social Survey (CGSS) data and re-evaluate the extent of college entrance inequality.
Data, Measures and Methodology
The CGSS 2010 data adopts a four-stage clustering sampling design, which covers 2,801 county-level administrative units across 22 provinces. In order to refine the reference population as mentioned above, I restrict our cases to those who are aged between 14 and 22 (following Wang et al.) and at least have finished high school education. The final sample size used for our analysis is 398. One noticeable concern is the small sample size. In theory, whether or not a sample size is sufficient depends on the statistical power of the analytical model. According to the results of supplementary statistical power analysis, the following analysis does not suffer from the small-sample problem.Footnote 3
In order to assess the general disparity in access to higher education, I use a comprehensive measure of college education including both regular colleges (putong benke 普通本科) and junior colleges (zhuanke 专科). The socio-demographic characteristics are the same as in Wang et al., including gender (1 = female; 0 = male), ethnicity (1 = Han; 0 = minorities), the household economic status when the respondent is at age 14 (self-reported scores from 1 to 10), and household registration status (1= urban; 0 = rural).Footnote 4
The following analysis consists of two parts. The first part computes the descriptive RDIs. The second part looks further into how these socio-demographic factors affect the likelihood of attending college using a logistic regression model.
Findings
The values of the RDIs based on the CGSS 2010 can be found in Table 1. Seeing the row of the relative disparity index, I find female students are under-represented while Han, rich and urban students are over-represented in all college students in the sample.Footnote 5 Thus, the descriptive findings shown in Table 1 lend support to Wang et al.
Relative Disparity Indexes
Source:
Data drawn from the 2010 Chinese General Social Survey.
Notes:
*Computed by the ratio of the mean values
**p < 0.001 (chi-square test).
However, the focus of this study is to investigate the population-level disparity in access to higher education in China. Thus, the descriptive findings of the RDIs based on one CGSS sample might be subject to sampling errors. This problem might also exist in Wang and colleagues' research, where only four colleges are examined. In order to solve this problem, I conduct statistical inference using Chi square test and groupwise t-test. The results, as shown in Table 1, suggest that only household registration status is statistically significant. In other words, the RDI values for gender, ethnicity, and economic status are very likely to be different (either larger or less than 1) if a new sample is collected.
The results of the logistic regression models shown in Table 2 consolidate the above findings (model (1) through model (4)). Of these four socio-demographic factors, only household registration status is statistically significant. Besides, since an interaction effect between socio-demographic factors is detected (e.g. poor, rural, minority women are the most under-represented) in Wang et al., I study the interaction effect as well. The findings are presented in model (5) through model (7). Unlike Wang et al., no significant interaction effect between socio-demographic factors is found.
Results of logistic regression
Source:
Data drawn from the 2010 Chinese General Social Survey.
Notes:
Unstandardized coefficient with standard errors in parenthesis.
# p < 0.1, *p < 0.05, **p < 0.01, ***p < 0.001 (two-sided test).
In summary, although the descriptive findings based on the CGSS 2010 lend support to Wang et al., results of statistical inference suggest that only urban–rural disparity in access to higher education is substantiated.
Conclusion and Discussion
Enlightened by the study conducted by Wang et al., this commentary addresses some potential caveats in using the relative disparity index to evaluate the disparity in access to higher education. Based on these discussions, I point out the limitations existing in the empirical study of Wang and colleagues, and reassess the extent of disparity in college education opportunities in contemporary China using a nationwide representative survey data. I find that only household registration status is significantly associated with the likelihood of attending college, while gender, economic status, and ethnicity are not. These findings indicate that the descriptive RDIs regarding gender, economic status, and ethnicity are subject to sampling errors. Since only four colleges are examined in Wang et al., such a sampling error might also exist in their study.
I close this commentary with reflections on a widely taken approach in examining the disparity in access to higher education. This approach can be termed the “language of disproportionality,” where a disproportionate share of a certain type of individuals among college students relative to their share in a reference population is viewed as evidence for an unequal distribution of higher education resources. The research of Wang and colleagues, by using the RDIs, largely follow this line of thought. My question, here, is whether or not disproportionality necessarily indicates the need for the reform of the higher education system. Generally speaking, a disproportionate share of a specific socio-demographic group in college students might be attributed to (1) an unfair institutional arrangement in the college recruitment process which benefits disproportionately a certain type of students; or (2) the overlapping between socio-demographic characteristics and the desirable attributes for college entrance such as a high score in the college entrance exam. The distinction between these two causes can be illustrated by an example: a disproportionately high share of urban students in college freshmen might be observed if colleges have a lower extent of selectivity for urban high school graduates, or, urban high school graduates, on average, have higher scores in the national college entrance exam relative to the rural counterparts.
Distinguishing these two causes for an observed disproportionality pattern is of great importance for relevant higher education policies. On the one hand, if it is mainly unfair institutional arrangements that give rise to a disproportionality pattern, the focus of equality-enhancing higher education policy, evidently, should be set on the reform of the college system. On the other hand, if a disproportionality pattern is mainly established through the socio-demographic differentiation in the likelihood of attending college, more policy attention should be paid to the improvement in egalitarianism of pre-tertiary, especially high school, education resources. In the latter case, the higher education enrolment system per se does not have to be changed. In sum, a disproportionality pattern does not necessarily mean that the college recruitment process per se is problematic or unfair. This point of view, however, does not get the attention it deserves. In Wang et al. and many other studies, disproportionality has always been tied to the necessity for reforming the higher education system (e.g. raising the quota for rural residents). This policy suggestion might be proposed too hastily without meticulously distinguishing the detailed causes for an observed disproportionality pattern.