
I. INTRODUCTION
TiC as transition-metal carbidesReference Kim and Kang1 is widely utilized as coating materials because of its unique properties, including high melting point, low density, high hardness, superior thermal conductivity, chemical stability, and wear resistance.Reference Zhang, Li, Jiang, Yan and Chen2–Reference Liu, Yin and Zhu4 Besides, Ti(CxN1−x), a solid solution of TiC and TiN,Reference Kim, Kwon and Kwon5 also displays excellent properties as coatings.Reference Cardinal, Malchère, Garnier and Fantozzi6 Especially, compared with monolayer coatings, some properties such as microhardness and wear resistance of multilayer coatings can be improved obviously.Reference Kim, Baik and Kwon7,Reference Zhao, Lin, Xiao, Dong and Wen8 What is more, multilayer coatings also show better adhesion properties than monolayer coating on the steel substrate.Reference Parra, Arango and Palacio9 Meanwhile, more interfaces of multilayer coatings can decrease the pores and other defects which normally exist in the monolayer coating.Reference Liu, Leyland, Bi and Matthews10–Reference Zhang, Xue and Li12 Therefore, further study of multilayer coatings is extremely meaningful.
Nowadays, many researchers focus on TiC and Ti(CN) solid solution multilayer coatings.Reference Zhang, Xue and Li12,Reference Michelic, Loder, Reip, Barani and Bernhard13 Notably, the TiCN/TiC material system, one of the important composite coatings with high hardness, better anti-abrasive capability, and good wear resistance, is widely accepted as a coating material for high-speed cutting tools and mechanical components.Reference Lackner, Waldhauser and Ebner14–Reference Yasuoka, Wang and Murakami17 Zhang et al.Reference Zhang, Xue and Li12 used the chemical vapor deposition (CVD) method to manufacture TiC/Ti(CN)/TiN multilayer coatings on different high-strength steels, who found that the coatings prepared by CVD not only own high adhesion and hardness but also provide good resistance for chloride-ion corrosion. Besides, they also fabricated Ti(CN) multilayer coatings on 35CrMo steel and discovered that the coatings containing TiC0.2N0.8 possess favourable mechanical properties.Reference Zhang, Xue, Li and Qin18 Yasuoka et al.Reference Yasuoka, Wang and Murakami17 compared the mechanical performance of TiCxN1−x single-layer coating with that of the TiCxN1−x multilayer. They obtained that the abrasion resistance of multilayer coatings is better than single-layer coating and the TiCxN1−x with 10–30% C displays the best. Though the experiments can obtain good results and phenomena, the investigation on microscopic and mechanical properties is difficult by using experimental methods.
In fact, the properties of coatings are closely related with their electronical and interfacial structure.Reference Guo, Zhang, Jung, Li, Knapp and Zhang19–Reference Liang, You, Ma and Wei21 First-principles calculation on TiC and Ti(CN) coatings has been verified to be an effective method to study the electronical structure. Zaoui et al.Reference Zaoui, Bouhafs and Ruterana22 discussed the electronic properties of TiCxN1−x, who found that the total density of state (DOS) of TiCxN1−x is hybridized by C(N) s or p states and Ti d-states. Kim et al.Reference Kim, Kwon and Kwon5 who used first-principles calculation studied the phase stability of TiC1−xNx with different temperatures and draw a conclusion that with the increasing temperature, nitrogen-rich phases became less stable. Li et al.Reference Li, Yang, Li, Lou, Luo and Huang23 indicated that the stacking of interfacial atoms has an influence on bonding nature, charge transfer and distribution, which will affect interface mechanical properties. Meanwhile, interface fracture toughness can straightforward be evaluated by adhesion energy, a parameter affected by interfacial atom species and the total energy of the interface structure. Guo et al.Reference Guo, Zhang, Jung, Li, Knapp and Zhang19 studied the tensile and shear deformations of the interface using the first-principles calculations and pointed out that the tensile and shear deformation can be accommodated by a typical metallic bonding characteristics.
However, few literature studies investigate on the interface structure of TiCxN1−x/TiC multilayer coatings. On the one hand, local bonding, specific atomic structure, and local chemistry at the interface would affect the properties of TiCxN1−x/TiC multilayer coatings but few experimental methods can effectively study it. On the other hand, calculations on the TiCxN1−x/TiC interface are more difficult and challenging. In our previous work, we have calculated the TiC(111)/TiN(111) interface in the early stage and found that the interface covalent and ionic bond play a major role for the interface properties.Reference Fan, Chen, Zhang, Li, Liu and Xiao24 To complete description of our work, the interfacial properties of TiCxN1−x(001)/TiC(001) are investigated by first-principles calculation, which includes the interfacial atomic structure, interfacial ideal work of adhesion, and their charge distribution. Based on the calculated results, we want to understand the effect of interface doping on the interface properties and propose some useful advice for design and investigate multilayer coatings.
II. COMPUTATIONAL DETAILS
Cambridge sequential total energy package based on density functional theory was used in this paper. Generalized gradient approximation (GGA) of Perdew–Burke–Ernzerhof (PBE) was utilized to address exchange-correlation function. Subsequently, to test the accuracy of parameters utilized in this paper, the bulk properties of TiC and TiCxN1−x (0 < x < 1) were calculated. Meanwhile, the surface properties of all slabs with different layer numbers were discussed to gain the suitable layer numbers of bulk-like slabs used for the following interface structure calculation. The plane-wave cutoff energy in this work is 320 eV for all bulks, surfaces, and interfaces. Sampling of the irreducible edge of the Brillouin zone was carried out with the regular Monkhorst–Pack k-point grid. 6 × 6 × 6 k-point mesh is used for both bulks and 9 × 9 × 1 k-point mesh is utilized for the surfaces and interfaces. For the convergence tolerances, the maximum force, maximum displacement, and the energy are set as 0.03 eV/Å, 0.001 Å, and 1 × 10⁻⁵ eV/atom, respectively. A vacuum of 10 Å for surfaces and a vacuum of 25 Å for interfaces were added respectively, which can avoid unexpected interaction with the periodic cell structure.
III. BULK AND SURFACE PROPERTIES
A. Bulk properties
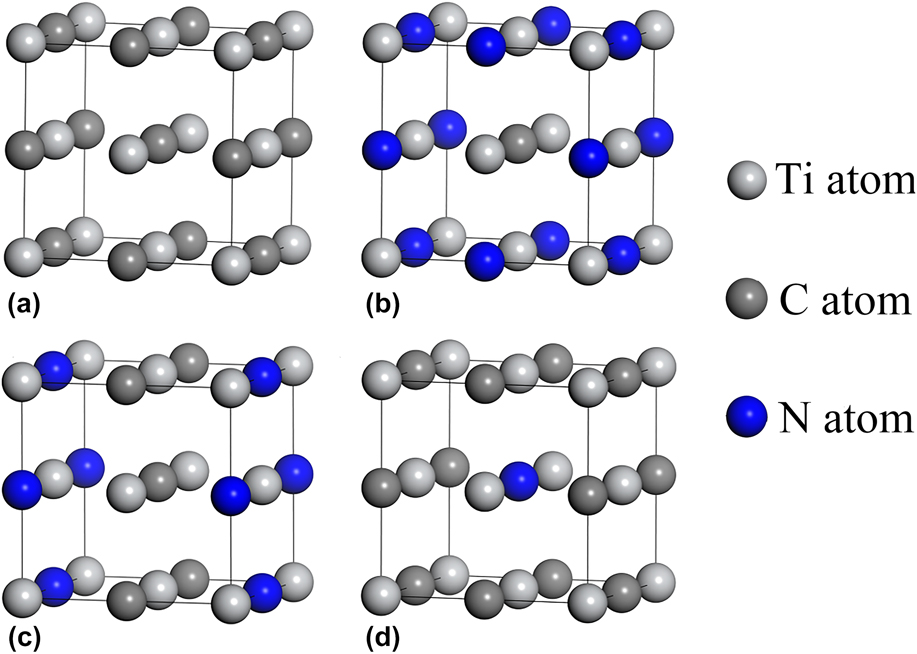
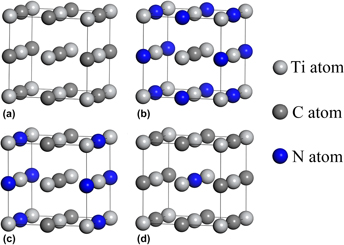
All the optimized structures of TiCxN1−x are shown in Fig. 1. Due to TiC and TiN belong to the NaCl-type structure, all the TiC1−xNx (0 < x < 1) use the same structure.Reference Chen and Yan25
Crystal structures of (a) TiC, (b) TiC0.25N0.75, (c) TiC0.5N0.5, and (d) TiC0.75N0.25.
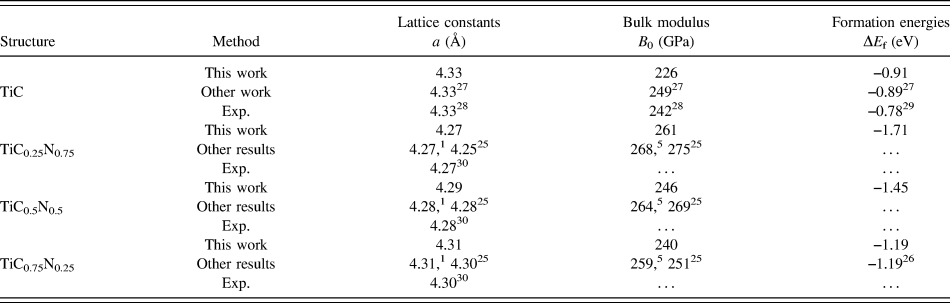
To test the rationality of parameters utilized, some parameters of all bulks including lattice constant, bulk modulus, and formation energy were calculated by using the GGA–PBE method. The calculated results in this work were compared with those of experiments and other published papers, which are listed in Table I. What is worth mentioning that formation energy can be calculated by Eq. (1)Reference Yi, Yin, Zheng, Khan and Qu26
 $$\Delta {E_{\rm{f}}}\left( {{\rm{Ti}}{{\rm{C}}_m}{N_n}} \right) = {{{E_{{\rm{Ti}}{{\rm{C}}_m}{{\rm{N}}_n}}} - {E_{{\rm{Ti}}}} - m{E_{\rm{C}}} - n{E_{\rm{N}}}} \over {1 + m + n}}\quad ,$$
where  ${E_{{\rm{Ti}}{{\rm{C}}_m}{{\rm{N}}_n}}}$ is the total energy for TiCmNn, E Ti is the total energy per atom of Ti bulk crystal, and E C and E N are the total energy of a single C and N structure.
Calculated and experimental (Exp.) values of the properties of all structures.

The calculated lattice constants ‘a’, bulk modulus ‘B 0’, and formation energies of all structures shown in Fig. 1 are listed in Table I. Notably, the relevant calculated results of TiCxN1−x in this work coincide well with other previously published results, which demonstrate that the parameters utilized in this paper are reasonable and accurate.
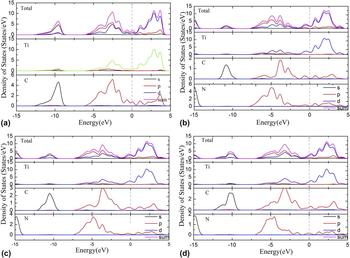
The partial density of state (PDOS) of TiC and TiCxN1−x structures is calculated, as shown in Fig. 2. Due to the similar structure, the PDOS of all bulks are similar. One obvious feature is that next to the Fermi level (E F), the DOS for all structures exist in the form of p–d hybridization formed by p states of N and C and d states of Ti, which generates a shear-resistive covalent bonding caused by nonmetal 2p and metal d electrons coupling. What is more, the DOS of all bulk materials at the Fermi level consists of peaks, which demonstrates metallic characteristics. That is, the bond of these materials is not a single one, which contains metallic bonding and covalent bonding.
Total and PDOS for all bulks (a) TiC, (b) TiC0.25N0.75, (c) TiC0.5N0.5, and (d) TiC0.75N0.25. The E F is set to zero.

B. Surface convergence analysis
First of all, surface structures are studied to investigate the microscopic properties of the TiCxN1−x/TiC interface. It is obvious that both sides of slabs must be thick enough to present bulk-like characteristic interiors. To obtain the suitable minimum numbers of the layer, there are two methods widely utilized. One method is to verify the convergence of surface energy by increasing atom layers. The other method is that the increase or decrease of the layer spacing is tested by increasing atom layers.Reference Dudiy and Lundqvist31 Surface energy (δ) is used to describe the surface stability, which is the energy required to split the crystal into two parts along a plane. The surface energy (δ) can be obtained by Eq. (2).Reference Li, Yang, Feng, Luo, Sun and Jin28
 $$\delta = {{\left[ {{E_{{\rm{slab}}}}\left( N \right) - N{E_{{\rm{bulk}}}}} \right]} / {2A}}\quad ,$$
where E slab(N) is the total energy of surface supercell slab, N is the total number of atoms in the slab, E bulk is the total energy per atom in the bulk, and A is the surface area.
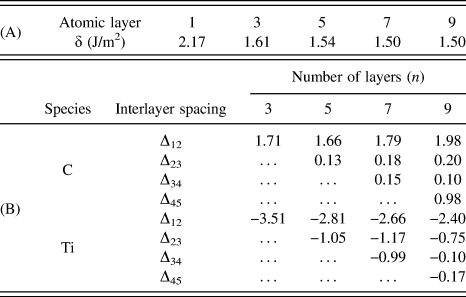
Obviously, it can be seen in the part (A) of Table II that the surface energy for the TiC(001) surface converges rapidly with increasing slab thickness to 1.50 J/m2 when the layers of slab exceed 5 layers. The results of this work are consistent with those of other ones.Reference Fang, Wang, Gong, Dai and Miao32,Reference Yang, Zhang, Zhou, Guo, Ren, Yang and Yang33 Therefore, a 7-layer slab of TiC(001) is selected for further study. Meanwhile, given the similar structure of these 4 materials, the 7-layer slab of 4 materials is chosen to investigate the electronic structure.
The test results for surface convergence with different methods. The (A) part is the results for surface energy convergence with respect to slab thickness, and part (B) is the results of the spacing changes after the TiC(001) surface relaxations (the percentage increase or decrease of the layer spacing is presented as Δij).

For further verification of the suitable minimum numbers of the layer, the convergence test is performed with the second method which is to test the layer distance changes of the TiC(001) surface by increasing atom layers, and the results of the spacing changes are listed in the part (B) of Table II, where the percentage increase or decrease of the layer spacing is presented as Δij, and n is the number of layers. From the part (B) of Table II, the changes of the layer distance decrease gradually after the structures are relaxed. From the changes of atomic spacing from surfacial atom layers to deeper atom layers in TiC, the relaxation of the TiC structure mainly occurs in the top 3 atomic layers. It can be easily obtained that the top 3 interlayer relaxations for the (001) plane is converged with the increasing number of layers. When the number of layer exceeds 5, convergence of the top 3 layers occurs. Therefore, 7-layer surface structures for all TiC and TiCxN1−x can effectively represent the bulk characteristic of the slab.
Meanwhile, Fig. 3 shows the 7-layer surface structures for TiCxN1−x, which is added a vacuum of 10 Å. One feature can be observed that the surface structure of every material can be divided into 2 terminated structures.
Plots of  ${E_{{\rm{Ti}}{{\rm{C}}_x}{N_{1 - x}}}}\left( {001} \right)$ with 7 layers of atoms (a) first termination structure of TiC, (b) second termination structure of TiC, (c) first termination structure of TiC0.25N0.75, (d) second termination structure of TiC0.25N0.75, (e) first termination structure of TiC0.5N0.5, (f) second termination structure of TiC0.5N0.5, (g) first termination structure of TiC0.75N0.25, and (h) second termination structure of TiC0.75N0.25.

IV. INTERFACE PROPERTIES OF TICxN1−x(001) AND TIC(001)
To determine the most stable interface theoretically, the ideal work, the adhesion energy W ad, which can effectively predict the mechanical properties of an interface, is calculated. The adhesion energy is expressed not only as the reversible energy needed to separate the interface into two free surfaces but also the difference in total energy between the relevant isolated slabs and interface. The adhesion energy can be gained by Eq. (3).Reference Zhao, Yuan, Liu, Zhao, Wang, Zhou and Yang34
 $${W_{{\rm{ad}}}} = {{\left( {{E_{{\rm{Ti}}{{\rm{C}}_x}{{\rm{N}}_{1 - x}}}} + {E_{{\rm{TiC}}}} - {E_{{\rm{IF}}}}} \right)} / A}\quad ,$$
where the  ${E_{{\rm{Ti}}{{\rm{C}}_x}{N_{1 - x}}}}$, E TiC, and E IF are the total energy of the isolated TiCxN1−x slab, TiC slab, and TiCxN1−x interface, respectively. A is the interface area.
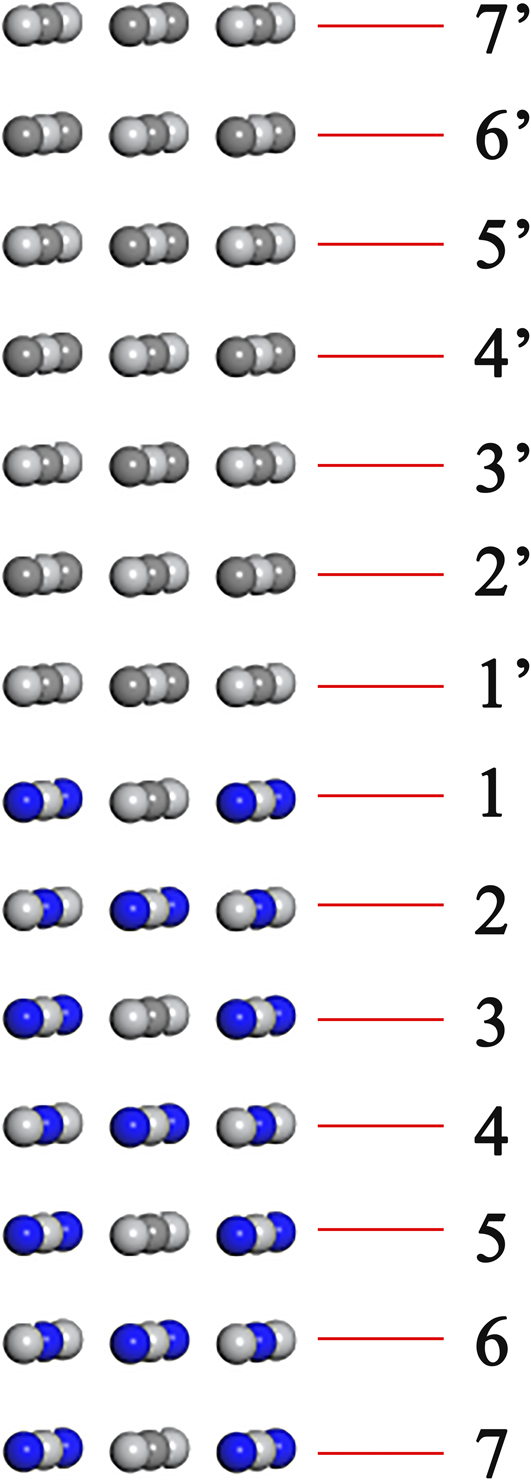
Due to every TiCxN1−x has two terminated structures mentioned in Fig. 3, a total of 12 interface structures of TiCxN1−x(001)/TiC(001) are obtained.
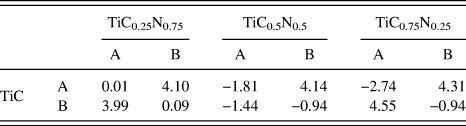
The adhesion energy results of all interface structures after relaxation are listed in Table III where A presents the first terminated structure of TiC and TiCxN1−x while B presents the second terminated structure of TiC and TiCxN1−x. It can be seen that the value of adhesion energy of TiC0.25N0.75(001)/TiC(001) interface structures is positive, which reflect that all interface structures are stable. For all interface structures, the biggest adhesion energy always occurs at the interface of the first structure of TiC and second structure of TiCxN1−x or second structure of TiC and first structure of TiCxN1−x, which can be explained that the existence of the interface would not break the continuity of each bulk internal structure. The value of adhesion energy that is negative reflects that the corresponding interface is unstable. Therefore, the interface of TiC first terminated structure combining TiC0.25N0.75 second terminated structure (shown in Fig. 4) is chosen for further study.
The adhesion energy, W ad (J/m2), of 12 interface structures after relaxation.

Plot of the first terminated structure of TiC contacting with second terminated structure of TiC0.25N0.75.

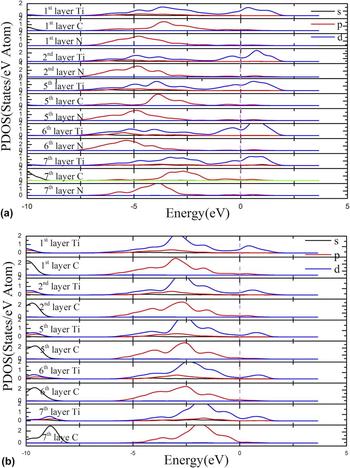
To further study the bonding mechanism of TiC0.25N0.75(001) and TiC(001) interfaces, the PDOS of which was calculated, as shown in Fig. 5. The first layer is closer to the interface and the 7th layer is the surface away from the interface.
DOS projected on the selected interface after relaxation. The first layer is closer to the interface. The top figure (a) presents the PDOS of TiC0.25N0.75 layers and the bottom one (b) shows those of TiC layers. The E F is set to zero denoted by a dash line.

From Fig. 5, it can be seen that the states at E F of all layers are mainly consist of Ti d state and consist of prominent peaks, which indicate that TiC0.25N0.75 and TiC possess metallic characteristics. In addition, the important hybridization of Ti d and C (N) p states below and at E F demonstrates the formation of covalent bonding. Moreover, the extreme similarity of the PDOS between interfacial C, N, and Ti atoms and their bulk counterparts reveals that the electronic structure transition at the interface from TiC0.25N0.75 to TiC is smooth. By contrast, the PDOS for surface C and N of TiC0.25N0.75 (7th layer) is visibly different from that for C and N away from interface (5th layer). On the one hand, the whole characteristic of the PDOS for surface C and N (7th layer) exists an obvious movement to valence band direction. On the other hand, the PDOS of surface C and Ti in TiC (7th layer) is different from that of C and Ti in TiC bulk. What is more, the 6th layer Ti and 6th layer N are similar with internal layers of Ti and N (away from the surface), which demonstrates that the surface effect affects only one or two atomic layers.
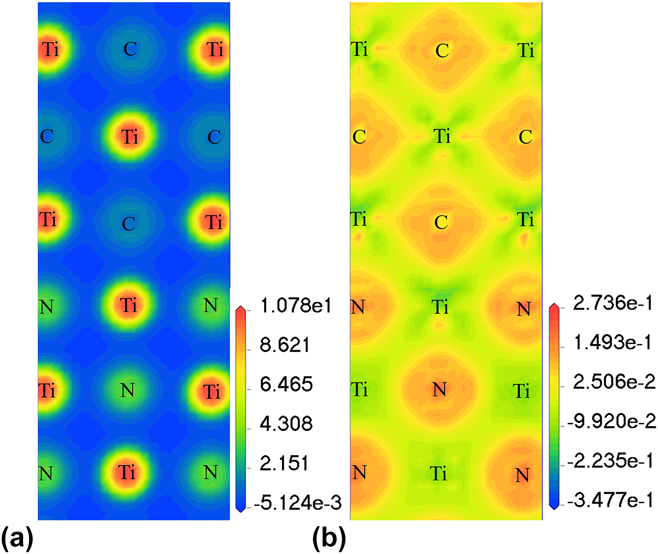
Although covalent bonding information is revealed by DOS, the related information of ionicity and electron transfer can be clearly obtained by the plots of charge density and charge density difference along the (010) plane, as shown in Fig. 6. The reason why the (010) plane for the interface is chosen is that the slice passes through C, Ti, and N atoms at the interface, which is easy to observe the bonding interaction at the interface.
Plots of (a) charge density and (b) charge density difference of the interface along the (010) plane.

It can be seen from Fig. 6 that the bonds are clearly generated among Ti, N, and C atoms. The charge density distributions of interfacial Ti–C atoms and Ti–C atoms away from the interface are extremely similar, which can be explained due to the continuity of the atomic structure. Moreover, one characteristic is the visible charge distortion between interfacial C and Ti as well as N and Ti. All of these show that the interfacial bonding is ionic and covalent. Furthermore, the charge transfer among the neighbor Ti, C, and N atoms can be observed. The charge depletion region is existed near the Ti atom while the region of charge obtaining is existed near the C or N atom, which indicates that some electrons have been transferred from Ti atom to C or N atoms when the interface establishes. Therefore, ionic bonds are formed at the interface. It can be seen that the charge increases for N is more than that for C, which means the ionic bond of TiC0.25N0.75 is stronger than that of TiC one. Even though the bonding strength of both slabs is a little different, TiC0.25N0.75 as the substrate or buffer for TiC is still a promising choice.
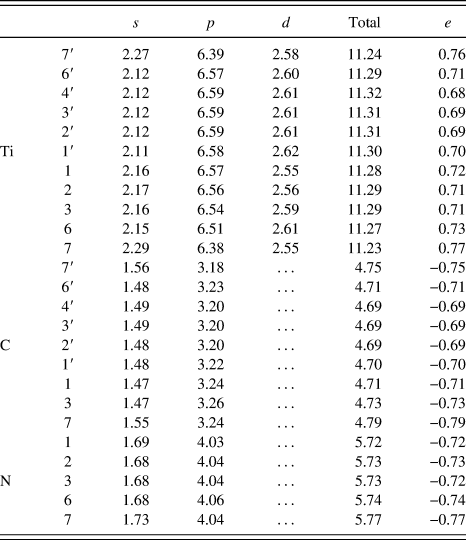
It is not enough that the plots of charge density and charge density difference provide the qualitative analysis results for charge transfer and ionicity of the TiC0.25N0.75(001)/TiC(001) interface configuration. Therefore, Mulliken population analysis was used to study the corresponding atoms in the interface configurations and supply the semiquantitative analysis results. The Mulliken charges on representative atoms of the selected interface are listed in Table IV. One feature is that the obtained electrons (e) from Ti to N are more than those to C, which indicates that the ionicity of TiC0.25N0.75 is higher than that of TiC. It is consistent with the above results. Moreover, the lost or gained electrons of the outermost atom (7′ and 7 atoms) are different from those of the bulk atoms. It can be explained that the outermost atoms have only half of the nearest neighboring electrons in comparison to the inner atoms.
Mulliken charge on representative atoms of the interface.

In summary, the interface of TiC first terminated structure combining TiC0.25N0.75 second terminated structure is chosen to study the bonding mechanism of the TiC0.25N0.75(001)/TiC(001) interface because all of its interface structures are stable. The interface covalent and ionic bonds of the TiC0.25N0.75(001)/TiC(001) interface play a major role for the connection of TiC and Ti(CN) solid solution. Compared to the electronic property of the TiC(111)/TiN(111) interface,Reference Zaoui, Bouhafs and Ruterana22 the ionicity of TiC0.25N0.75 is higher than that of TiC. It is evidence that doping can affect the interface properties by the amount of atom charge transfer at the interface. This indicates that doping is a practicable method to design and investigate multilayer coatings.
V. CONCLUSION
The interface structure of the TiCxN1−x(001)/TiC(001) interface coatings was studied by first-principles calculation. To facilitate the calculation, three solid solutions with different carbon and nitrogen contents were selected, which are TiC0.25N0.75, TiC0.5N0.5, and TiC0.75N0.25, respectively. The adhesion energy is used to address the stability of the twelve interface structures of TiCxN1−x(001)/TiC(001). Therefore, the first terminated structure of TiC combining second terminated structure of TiC0.25N0.75 is chosen to study its electronic properties including PDOS, charge density, charge density difference, and Mulliken population analysis. The bonding nature of the chosen interface presents ionic and covalent characteristics, which is also existed in bulk materials. Besides, the iconicity results from that the C and N atoms gain the charge from adjacent cation atoms while the covalency is generated by the hybridization among N or C p states and Ti d states. Moreover, the extreme similarity of the PDOS between interfacial C, N, and Ti atoms and their bulk counterparts reveals that the electronic structure transition at the interface from TiC0.25N0.75 to TiC is smooth. The charge distribution is mainly around Ti, N, and C atoms. Meanwhile, the charge increased for C in TiC is less than that for N in TiC0.25N075, which reveals that the ionic bond in TiC is weaker than that in TiC0.25N0.75. In other words, the interface doping can affect the interface properties. And doping is a useful method to design and investigate multilayer coatings. Besides, TiC0.25N0.75 coating can be an alternative choice to combine with TiC coating in the actual production process of multilayer coatings.
ACKNOWLEDGMENT
This work was supported by the Fundamental Research Funds for the Central Universities of China (2682014CX004).