1. Introduction
Scientists use specialized techniques to acquire information that is not available to the unaided senses. Many of those techniques produce raw data that require substantial interpretation. For instance, the curve a cathode-ray oscillograph produces has to be assigned a coordinate system before it can serve as a record of voltage as a function of time. The method of assigning a coordinate system, like many other methods of raw-data interpretation, has been standardized and automated over time. Before it could be standardized and automated, however, it had to be developed and validated.
How do scientists develop and validate a method of interpreting raw data from a new technique? When a technique purports to provide information that is not available to the unaided senses, it is impossible to use direct observation to discover or check a method of interpreting raw data from that technique. In such circumstances, it is natural to think that the justification for a particular method of interpretation must come from a theory about the process that produces the raw data. For instance, one might think that the justification for assigning the curve an oscillograph produces to a particular coordinate system must come from a theory about the process that leads from the voltage in the nerve to the recording of the curve on the oscillograph screen.
Call this idea—that, when a technique provides information that is not available to the unaided senses, the justification for a particular method of raw-data interpretation must come from a theory of the process that produces the raw data—the Process-Theory View. Sylvia Culp affirms such a Process-Theory View when she says that “interpretations of raw data depend on theories about the processes being used to produce the raw data” (Reference Culp1995, 450). She recognizes this theory dependence as a potential threat to the objectivity of experimental inquiry and responds by arguing that “this dependence can be eliminated by using a number of techniques, each of which is theory-dependent in a different way, to produce a robust body of data” (441).
Contrary to the Process-Theory View, scientists have many strategies for validating a method of raw-data interpretation that do not depend on a comprehensive theory of the technique. Those strategies can be divided into two categories, which I call direct causal inference and process tracing.Footnote 1 Direct causal inference and process tracing can supply arguments that depend only on a limited, often quite modest set of presuppositions about the technique. Moreover, different arguments may depend on largely independent sets of presuppositions. Thus, contrary to the impression Culp creates, robust bodies of data do not necessarily require multiple independently theory-dependent techniques; multiple independently theory-dependent arguments often suffice.
To support these claims, I draw on Joseph Erlanger, Herbert Gasser, and George Bishop's introduction of the cathode-ray oscillograph into electrophysiology. In section 2, I describe Erlanger et al.'s apparatus. In section 3, I explain their method of raw-data interpretation. In section 4, I present several arguments from direct causal inference that support this method. In section 5, I present arguments from process tracing that support it. In section 6, I explain how these arguments work together to allow Erlanger et al. to produce a robust body of data with a single technique.Footnote 2
2. Erlanger et al.'s Cathode-Ray Oscillograph Apparatus
In 1921, Erlanger, Gasser, and Bishop built the first cathode-ray oscillograph apparatus for recording action currents. (An action current is a change in voltage along the length of a nerve that occurs when that nerve conducts an impulse.)Footnote 3 At the time, the dominant recording devices in electrophysiology were the capillary electrometer and the string galvanometer. The capillary electrometer and string galvanometer's moving elements had significant mass and were subject to significant damping.Footnote 4 Consequently, the records they produced were marred by inertial distortion.Footnote 5 Erlanger et al. used an oscillograph because an oscillograph's moving element—a beam of electrons—has negligible mass and is subject to negligible damping. Thus, they expected its records to be free from inertial distortion. Erlanger and Gasser received a Nobel Prize for their work and helped establish the oscillograph as the standard recording device in electrophysiology.
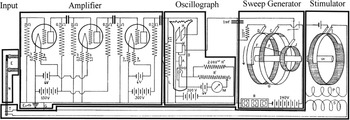
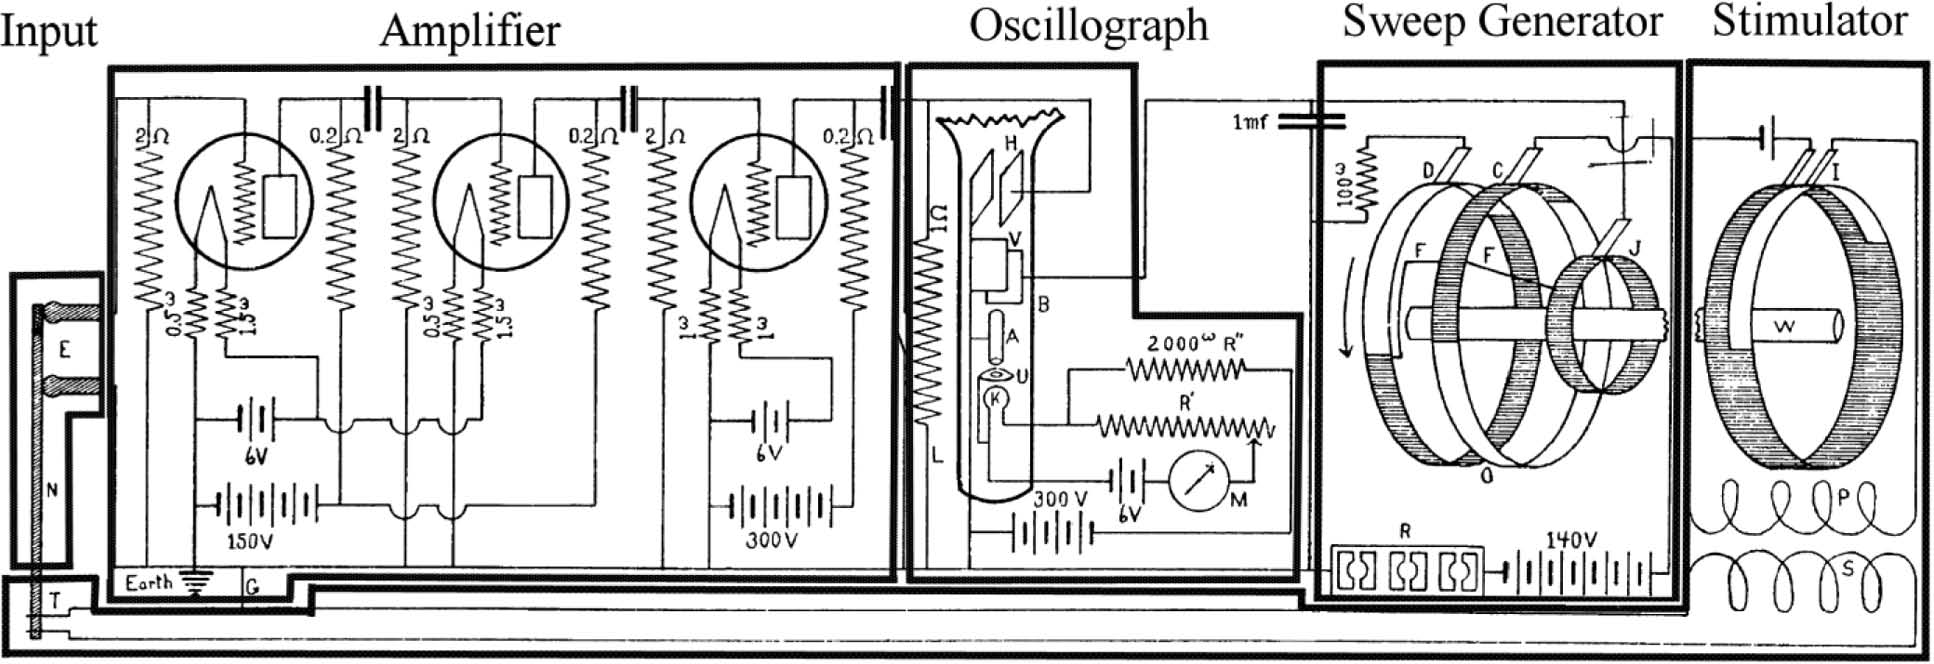
Figure 1 reproduces Erlanger et al.'s circuit diagram of their apparatus (Reference Erlanger, Gasser and Bishop1922, 502), with a box added around each of its major components. The apparatus operates as follows. The stimulator, on the far right of the figure, produces a voltage spike. That voltage spike travels the full length of the apparatus, from right to left along the bottom of the figure, to stimulate the nerve (N) via two electrodes (T). The nerve produces an action current, which the two receiving electrodes (E) pick up and feed into an amplifier. The amplifier contains a series of three vacuum tubes, each of which steps up the voltage the amplifier receives from the receiving electrodes. The stepped-up voltage then passes into the oscillograph (B). The oscillograph also receives voltages from the time-sweep generator, which is to its right in the figure. The oscillograph transforms these voltages into a visible image of the voltage in the nerve as a function of (the logarithm of) time.
Circuit diagram of Erlanger, Gasser, and Bishop's apparatus (Reference Erlanger, Gasser and Bishop1922, 502). Reprinted with permission of the American Journal of Physiology.
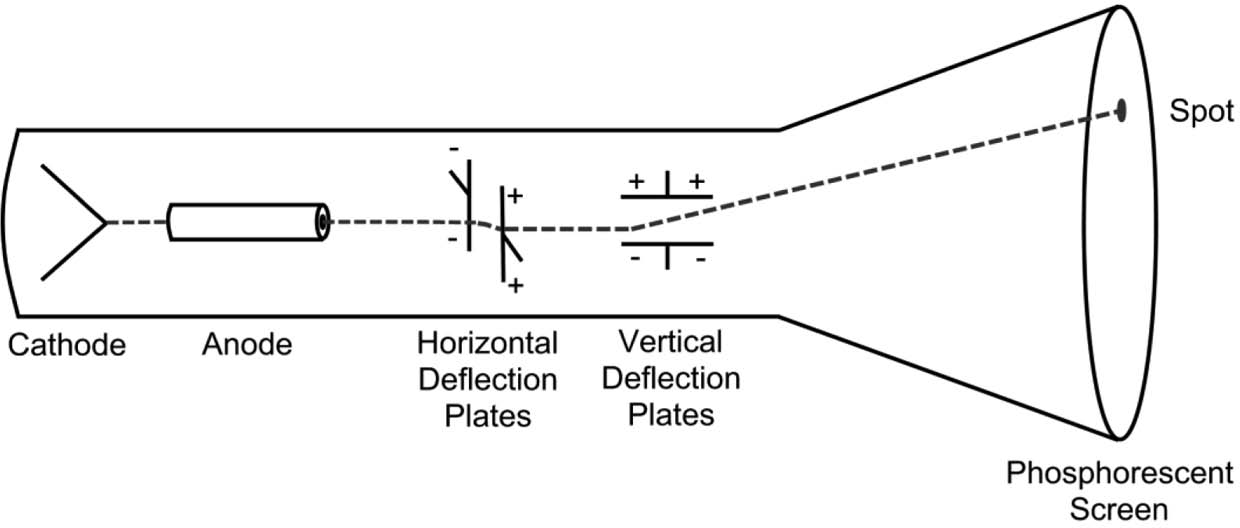
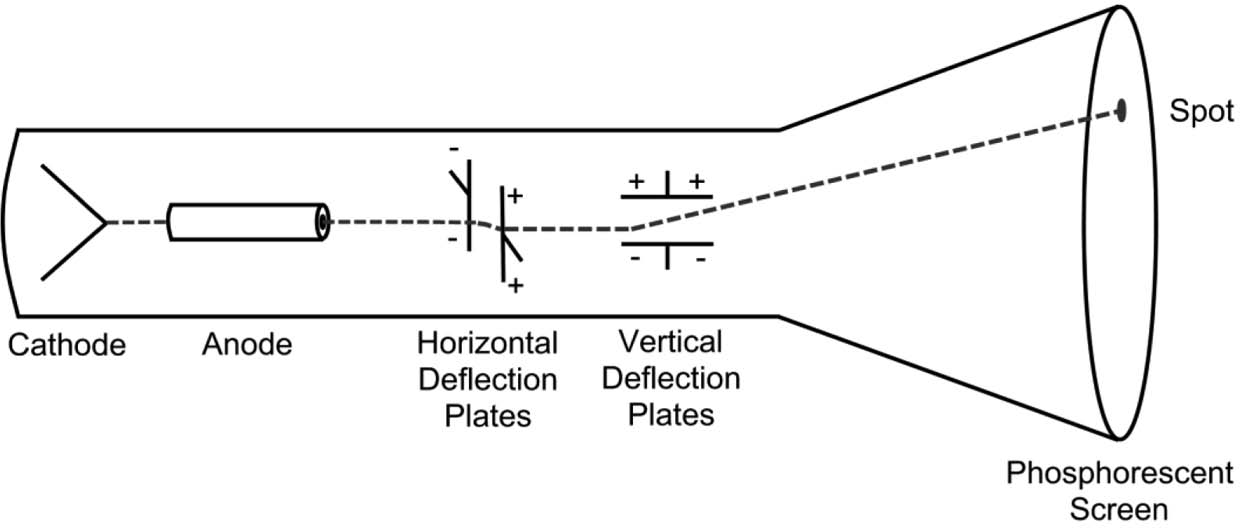
The oscillograph itself (fig. 2) is an evacuated tube with an electron-emitting cathode at one end and a phosphorescent screen at the other. Between the cathode and the screen are an anode and two pairs of parallel metal plates.Footnote 6 The cathode emits electrons. The anode focuses those electrons into a beam and directs that beam toward the screen. The screen produces a bright spot where the electron beam strikes it. Between the anode and the screen, each pair of plates exerts a force on the passing electron beam perpendicular to the plane of the plates’ orientation and proportional to their input voltage. The horizontal-deflection plates take their input voltage from the time-sweep generator, and the vertical-deflection plates take their input voltage from the receiving electrodes. The voltage from the time-sweep generator has the form of a logarithmic sawtooth wave. Thus, the electron beam produces a spot on the oscillograph screen that reflects the voltage between the receiving electrodes as a function of the logarithm of time. The stimulator and the start of the time-sweep generator cycle were coordinated so that Erlanger et al. could stimulate the nerve repeatedly and display each action current at the same position on the screen. Their primary recording method was to hold photographic film against the screen in a dark room and stimulate the nerve repeatedly until they had generated a clear image (Gasser and Erlanger Reference Gasser and Erlanger1924, 625).
Cathode-ray oscillograph.
The above description of Erlanger et al.'s apparatus amounts to a partial theory of how it produces raw data. If the Process-Theory View were correct, Erlanger et al.'s method of interpreting this raw data would be epistemically dependent on such a theory. However, such a theory involves many strong presuppositions about the physics of a rather complex apparatus and is thus a dubious basis on which to rest a raw-data interpretation. Fortunately, Erlanger et al. primarily based their raw-data interpretation not on a theory of their technique but on an empirical calibration procedure that I describe in the next section.
3. Erlanger et al.'s Method of Raw-Data Interpretation
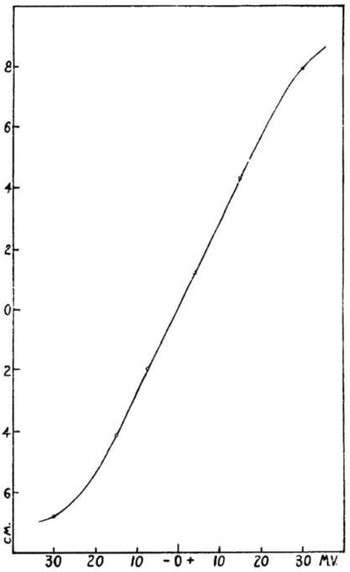
Erlanger et al. did not rely on a theory of how their technique works in order to develop and validate a method of raw-data interpretation. Instead, they used the following empirical calibration procedure. They ran a constant current through a wire to produce a known, unchanging voltage. They then applied this voltage to their oscillograph. They plotted oscillograph response against voltage for a variety of voltages to generate a plot of their device's “dynamic characteristic” (fig. 3).
Dynamic characteristic: vertical displacement of the oscillograph spot as a function of input voltage for constant, artificial currents (Erlanger, Gasser, and Bishop Reference Erlanger, Gasser and Bishop1922, 510). Reprinted with permission of the American Journal of Physiology.
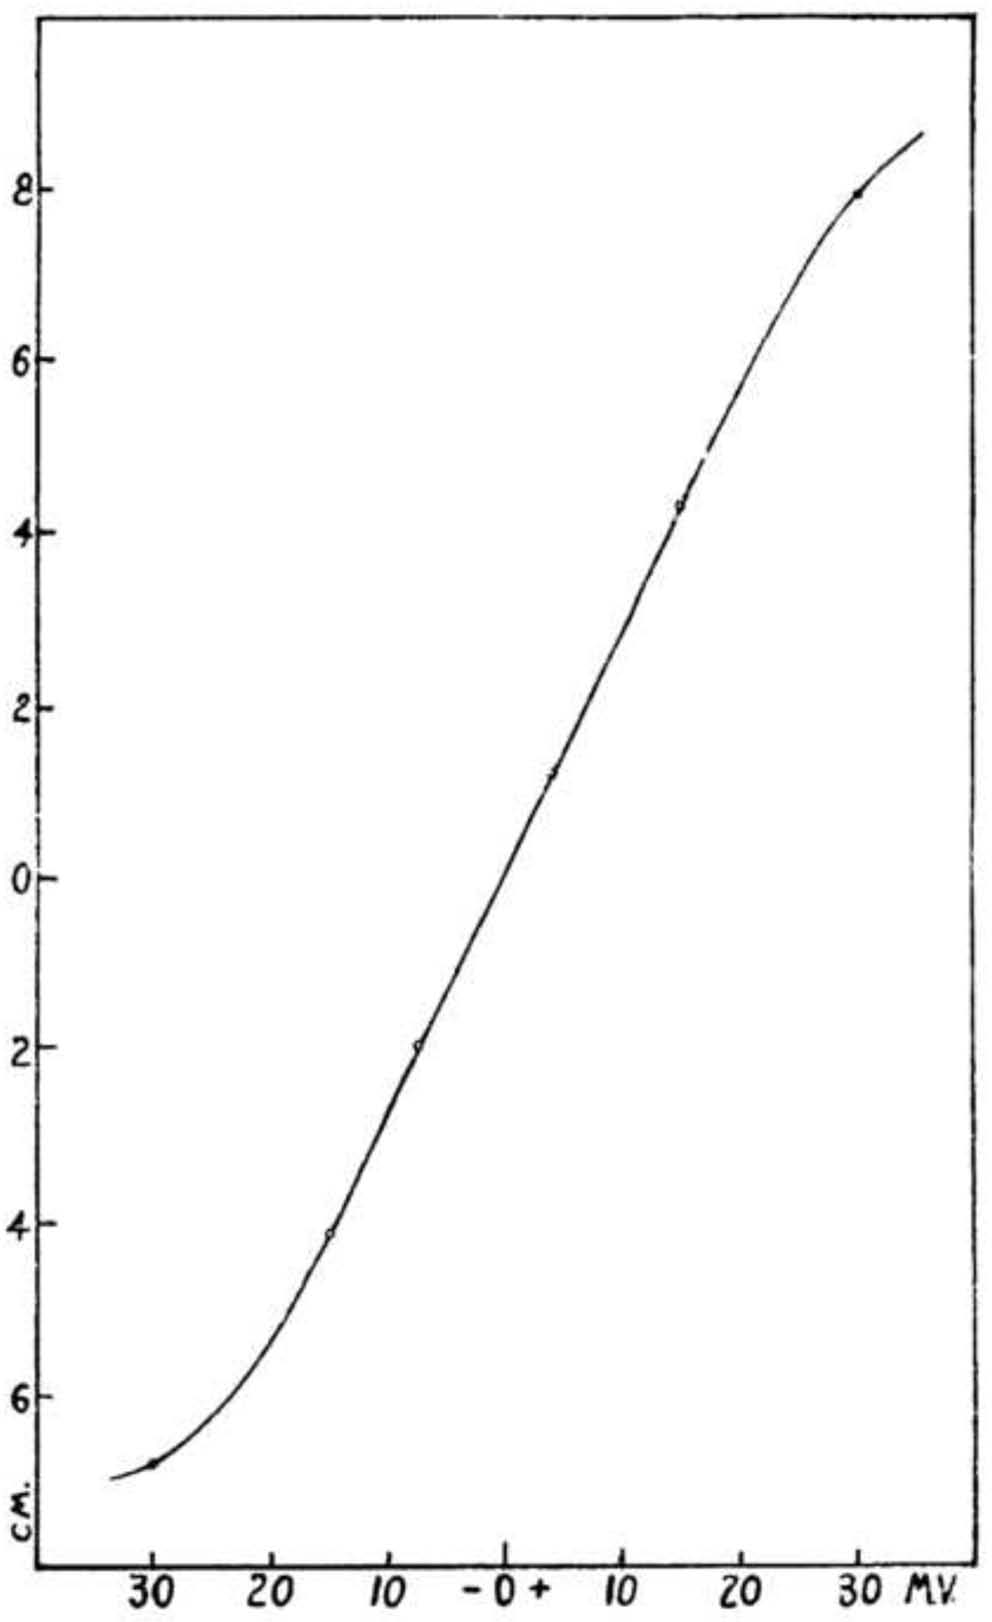
The dynamic characteristic shows that vertical displacement of the oscillograph spot varied essentially linearly with voltage for a range of input voltages between about −15 and +25 mV. The deviation from linearity outside this range was typical of vacuum tube amplifiers. This deviation was unproblematic because Erlanger et al. were able to maintain input voltages within “the best [i.e., most linear] portion of the characteristic” (between 0 and +15 mV) by “fractioning the input potential” (Reference Erlanger, Gasser and Bishop1922, 508–10). Thus, they were able to infer the voltages generated in an action current from the oscillograph record by invoking a linear relationship between the vertical displacement of the oscillograph spot and the input voltage to the apparatus. Because their amplifier gain varied, Erlanger et al. recalibrated their apparatus against a short current of known voltage before each trial (512).
This calibration procedure provided Erlanger et al. with a method of raw-data interpretation. However, it raised an extrapolation problem that needed to be addressed. The voltages Erlanger et al. generated in their wires were constant, whereas nerves generate voltages that change rapidly. To validate their technique, Erlanger et al. needed to show that their device, unlike the string galvanometer and capillary electrometer, could follow rapidly changing voltages with fidelity. Fortunately, they had available to them multiple, largely independent arguments that address precisely this point.
4. Arguments by Direct Causal Inference
There are two kinds of strategies for generating arguments that support Erlanger et al.'s method of raw-data interpretation, which I call strategies for direct causal inference and strategies for process tracing. Direct causal inference differs from process tracing in that it does not involve appealing to underlying mechanisms.Footnote 7 Direct causal inference has limitations, but it is attractive in that the inferences it draws are often relatively straightforward, involving few if any domain-specific theoretical presuppositions. The Process-Theory View neglects direct causal inference because it assumes that the only way to support a method of raw-data interpretation involves appealing to a theory of the process that produces the raw data, that is, to underlying mechanisms.
As an illustration of both the appeal and the limitations of direct causal inference, consider behaviorist psychology. Behaviorists denied the legitimacy of appeals to mental mechanisms, so they relied heavily on direct causal inference. As a result of their methodological scruples, they were able to discover facts about learning, for instance, that have the advantage of not depending on any substantive theory of mind. Over time, however, behaviorist psychology ceased to be a progressive research program, and most psychologists today think that appealing to mental processes can yield real insights. Behaviorist psychology is an unusual case; in most research programs, direct causal inference and process tracing operate in tandem, guiding and reinforcing one another.
Direct causal inference is a broad category that encompasses multiple strategies. At least three of those strategies can be used to support the claim that Erlanger et al.'s apparatus could follow rapidly changing voltages with fidelity:Footnote 8
1. Checks and calibration, in which observations made using the technique are compared against a known standard.
2. Observing artifacts known in advance to be present.
3. Manipulating the target and observing the results.
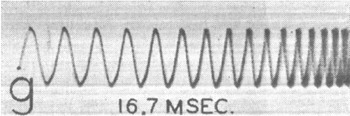
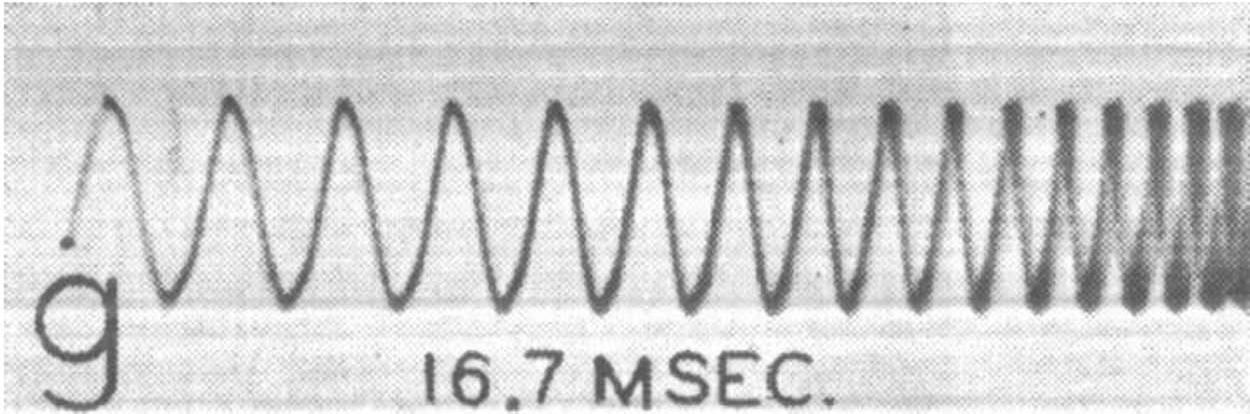
When Erlanger et al. calibrated their apparatus by finding its dynamic characteristic, they were using strategy 1. Two more instances of strategy 1 address the worry that the linear relationship found in the dynamic characteristic might not hold for rapidly varying voltages. First, Erlanger et al. often recorded the sinusoidally varying voltages associated with AC currents of known frequency to create a timescale for their recordings (fig. 4). The fact that those recordings came out as expected constituted a successful experimental check of their apparatus for rapidly changing voltages.Footnote 9
Oscillograph record of AC voltage (Erlanger and Gasser Reference Erlanger and Gasser1937, 6). Note logarithmic timescale. Reprinted with permission of the University of Pennsylvania Press.
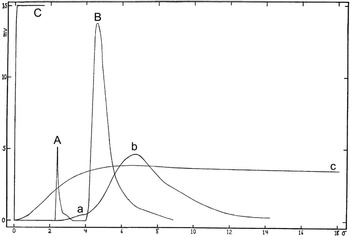
Second, Erlanger et al.'s apparatus responded extremely rapidly when a constant voltage was applied; as they put it, “a constant current produces an almost instantaneous rise of the oscillograph spot to its full height” (Reference Erlanger, Gasser and Bishop1922, 499). For instance, curve C in figure 5 was produced by applying +15 mV to the oscillograph at time  $t=0$: accordingly, the display indicates 15 mV almost immediately. Curve C compares favorably to curve c, which was produced by applying 3.75 mV to a string galvanometer at
 $t=0$; the galvanometer did not reach full response until after about 6 σ (.006 seconds). The oscillograph's nearly instantaneous response to applied voltage constituted another experimental check that verified its ability to follow rapid changes in voltage.
A, Oscillograph record of escape; B, oscillograph record of action current; C, oscillograph record of 15 mV, applied  $t=0$; a, galvanometer record of escape; b, galvanometer record of action current; c, galvanometer record of 3.75 mV, applied
 $t=0$. Adapted from Erlanger, Gasser, and Bishop (Reference Erlanger, Gasser and Bishop1922, 499). Reprinted with permission of the American Journal of Physiology.
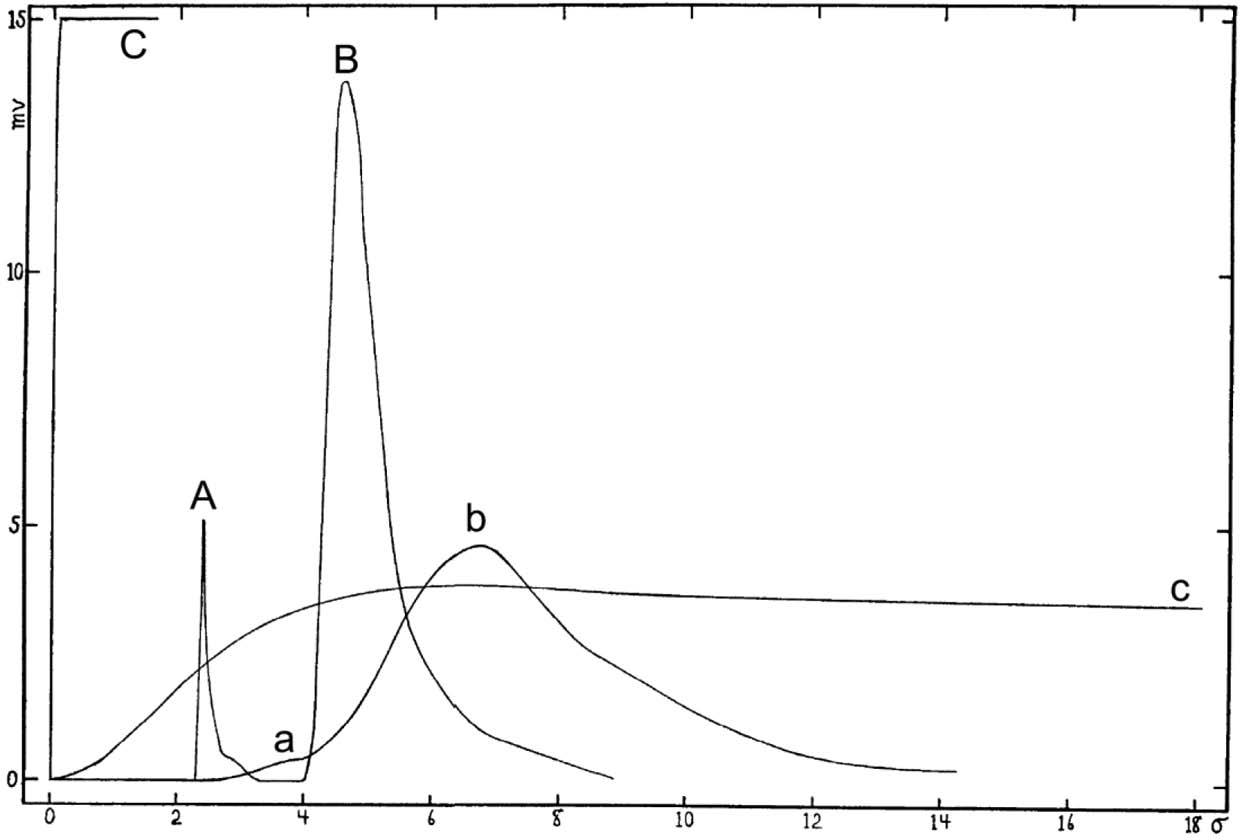
Figure 5 also contains information that Erlanger et al. used to apply strategy 2, which involves measuring an artifact known in advance to be present. Erlanger et al. stimulated a nerve to produce an action current by generating a brief voltage spike. That spike would itself travel along the length of the nerve and into the apparatus, generating an artifact they called an “escape.” Curve A is an oscillograph record of an escape. It looks as it should: a sudden spike in voltage, followed by a return to baseline before the action current begins (curve B). By contrast, the galvanometer record of an escape (curve a) is barely visible, and it blends into the record of the subsequent action current (curve b). As Erlanger et al. summarize these points, “In the oscillograph record the shock (or ‘escape’), A, is a distinct curve and the spot returns to the base line before the action current starts. In the string galvanometer reproduction the ‘escape,’ a, is still at its crest when the action current starts, and is very much reduced in amplitude” (Reference Erlanger, Gasser and Bishop1922, 498). The difference between the oscillograph record of an escape and the galvanometer record of an escape is a dramatic illustration of the difference in their abilities to record rapidly changing voltage without distortion.
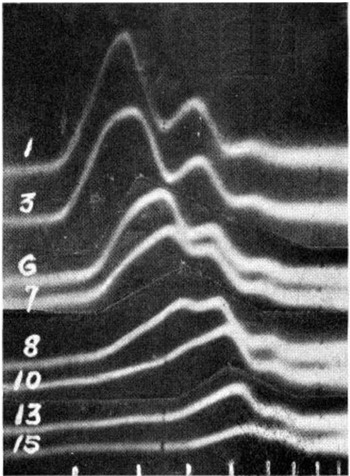
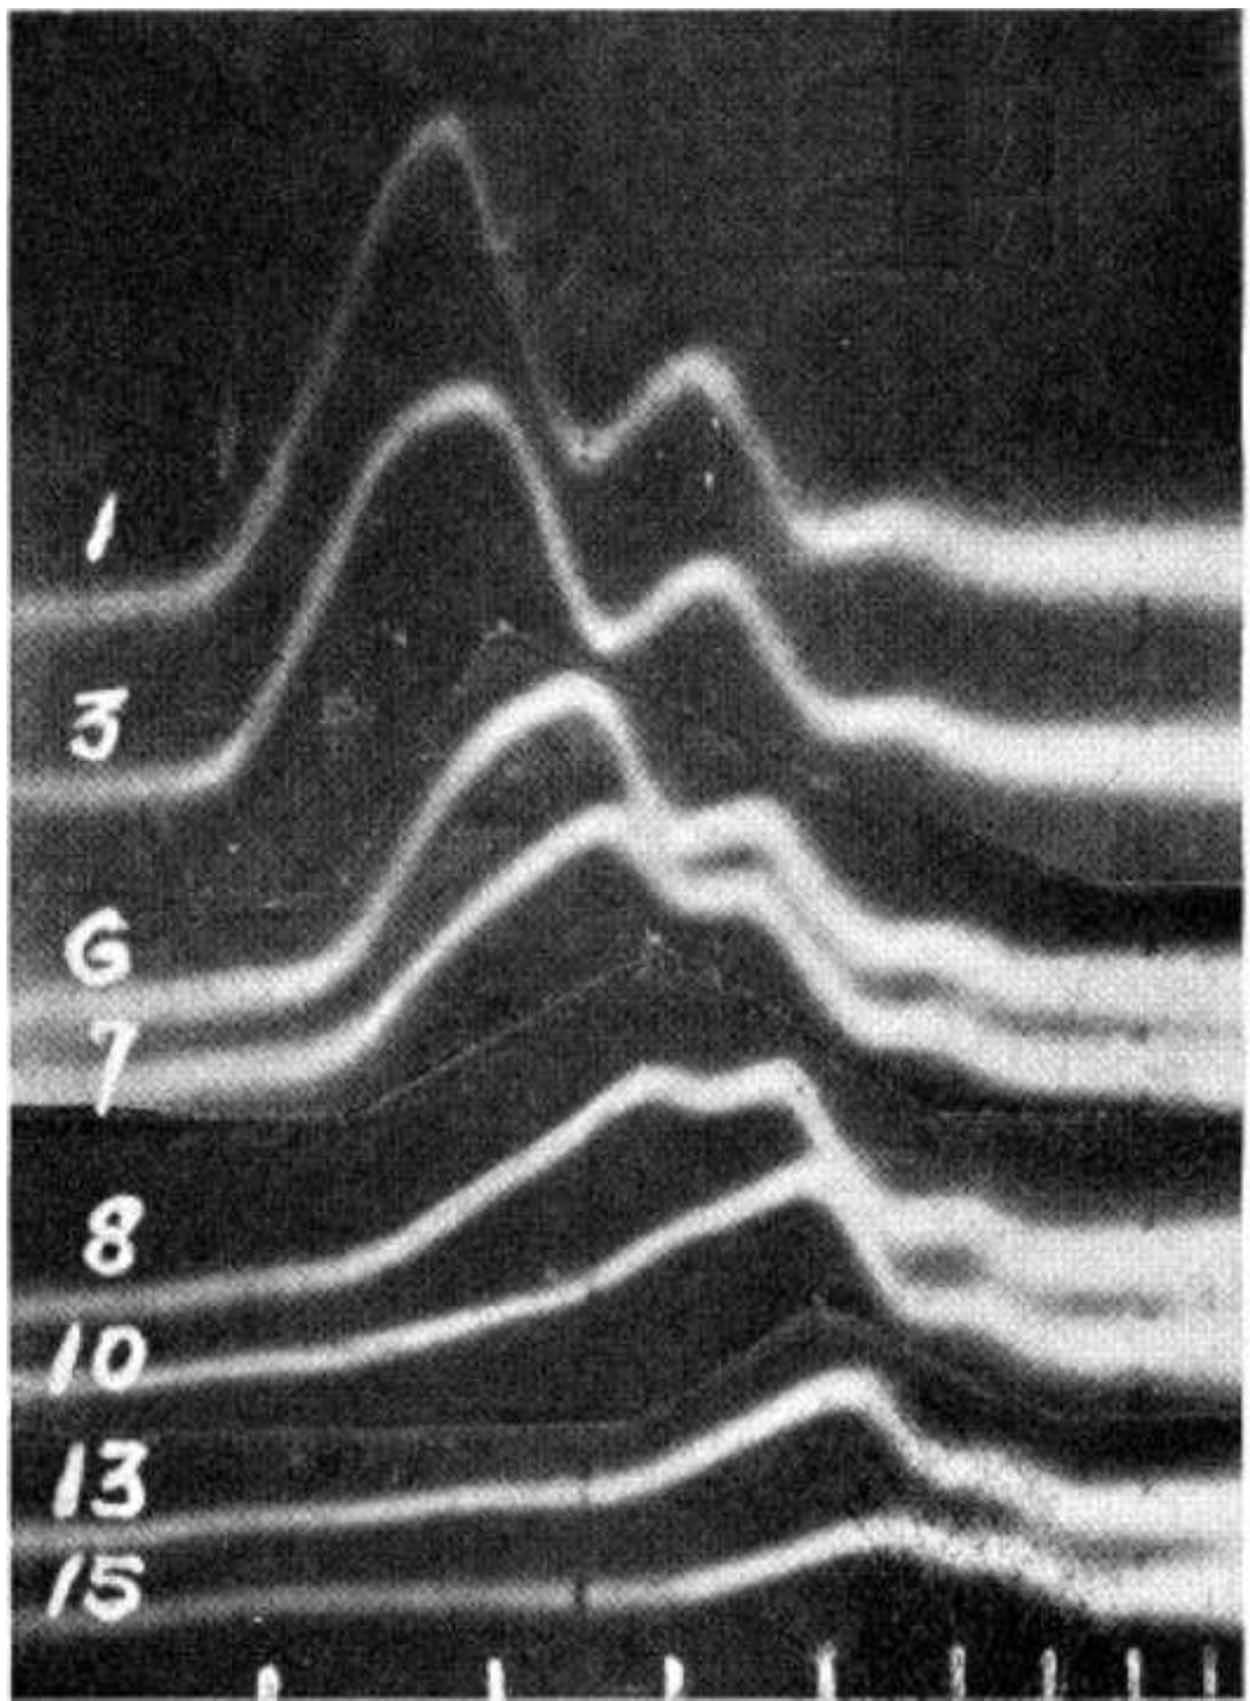
Erlanger et al. also used strategy 3, which involves manipulating the target and observing the results. For instance, they applied increasing pressure to nerves and recorded the resulting action currents (Gasser and Erlanger Reference Gasser and Erlanger1929). They found that the primary peak in the action current diminishes first under increasing pressure and that the secondary peaks diminish only after the primary peak has been eliminated (fig. 6). This finding bears a suggestive relationship to the finding that nerves lose motor function before they lose sensory function under increasing pressure. Unlike the arguments discussed above, this instance of strategy 3 does not support the claim that Erlanger et al.'s apparatus can follow rapidly changing voltages with fidelity in a targeted way. However, the fact that their records revealed changes in action currents that relate in a systematic way to losses of function under increasing pressure confirms their apparatus's reliability in a general way. It also provides targeted support for their finding that nerve action currents can have multiple distinct peaks.
Action currents in a nerve under increasing pressure (Gasser and Erlanger Reference Gasser and Erlanger1929, 585). Reprinted with permission of the American Journal of Physiology.
Erlanger et al. went on to deepen this argument for their apparatus by explaining the systematic relationship between changes in action currents and losses of function by ascribing functional roles to nerve fibers of various sizes and citing a linear relationship between fiber diameter and conduction velocity. However, that explanation involved attending to underlying mechanisms, so the deeper version of this argument belongs to the next section, in which I discuss Erlanger et al.'s uses of process tracing.
5. Arguments by Process Tracing
Process tracing involves appealing to information about underlying mechanisms, either in the apparatus or in the target system. As a result, it generally involves substantial theoretical presuppositions. However, it need not depend on a full-blown theory of the entire technique, and it can involve approximations and idealizations. A derivation of the Boyles-Charlse gas law from a molecular-kinetic theory of gases is a typical instance of process tracing in that it appeals to an idealized theory about underlying mechanisms in order to infer facts about causal relationships among observables.
The Process-Theory View distorts process tracing in that, because it sees process tracing as carrying the entire burden of supporting a method of raw-data interpretation, it expects process tracing to provide a complete theory of how an apparatus produces raw data from beginning to end. In fact, process tracing is often piecemeal: it provides a partial theory of the apparatus or the target phenomenon that adds one piece to an overall argument for a method of raw-data interpretation.
Erlanger et al. used the following three strategies for process tracing to validate their apparatus:Footnote 10
i) Using an apparatus based on a well-corroborated theory.
ii) Eliminating plausible sources of error and alternative explanations of one's results.
iii) Using a non–ad hoc theory to explain one's results.
Erlanger et al. used strategies i and ii when they discussed the physics of electrophysiological recording devices:
All of these instruments are governed by the laws of forced vibration with damping. The differential equation expressing this law is

which says that the applied force, f(t), produces a motion that is determined by the mass, M, the damping, D, and another restoring force, C, the mass effect being greater when the acceleration,  $d^{2}y/ dt^{2}$, is large; the damping increasing with the velocity,
 $dy/ dt$; and the restoring force, C, increasing with the deviation of the system from equilibrium. (Reference Erlanger, Gasser and Bishop1922, 496)
They went on to explain that the curve a recording device produces is “the graph of the curve expressing the value of y which is the solution of the above equation” and that “to get the true form, i.e., f(t) … one would have to operate on y as indicated” (496). However, this procedure faced “great practical difficulties,” the greatest of which lay “in the determination of the acceleration [ $d^{2}y/ dt^{2}$] with satisfactory accuracy” (496). They noted that, because of these difficulties, “the need [had] long been felt of an inertialess system for recording physiological currents” (500). The oscillograph satisfied this need: an electron beam's mass (M) is negligible and—because the oscillograph contains only a “very small amount of gas” (500)—its damping constant (D) is negligible. Thus, the first two terms of equation (1) were essentially zero for the oscillograph, so that equation (1) reduces to
 $Cy=f( t) $. That is, the deflection of the electron beam is proportional to the applied force.
In citing a well-corroborated theory of recording devices to produce equation (1), Erlanger et al. applied strategy i. In eliminating the first two terms of equation (1) as plausible sources of error in appealing to the claim that oscillograph output is proportional to input voltage, they applied strategy ii. This instance of strategies i and ii counts as an instance of process tracing because it involved appealing to information about how the components of the system behave and interact, such as generalization about how the electron beam behaves (eq. [1]), the fact that the electron beam's mass is negligible, and the fact that the interior of the tube is a near vacuum so that damping is negligible. It addressed the issue of the extrapolation of the dynamic characteristic from wires to nerves head-on by showing that the device should be able to follow rapid changes in voltage with fidelity.
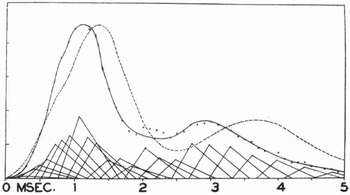
In other instances of process tracing, Erlanger et al. reconstructed action currents they recorded to a good approximation by assuming that each nerve fiber conducts at a rate proportional to its diameter (fig. 7). Gasser and Erlanger explained this procedure as follows: “It is possible by a histological examination of a nerve trunk to predict with some accuracy the form of the action potential it will yield. The reconstructed action potential wave behaves with regard to form, changes of form with conduction (such as increase in the time to maximal potential and decrease of the size of this maximal potential), and appearance of secondary waves, in the same manner as does the corresponding action potential as recorded” (Reference Gasser and Erlanger1927, 546).
Action currents. Solid curve is measured and dashed curve mathematically constructed on the assumption that conduction speed is proportional to fiber diameter (Erlanger and Gasser Reference Erlanger and Gasser1937, 20). Reprinted with permission of the American Journal of Physiology.
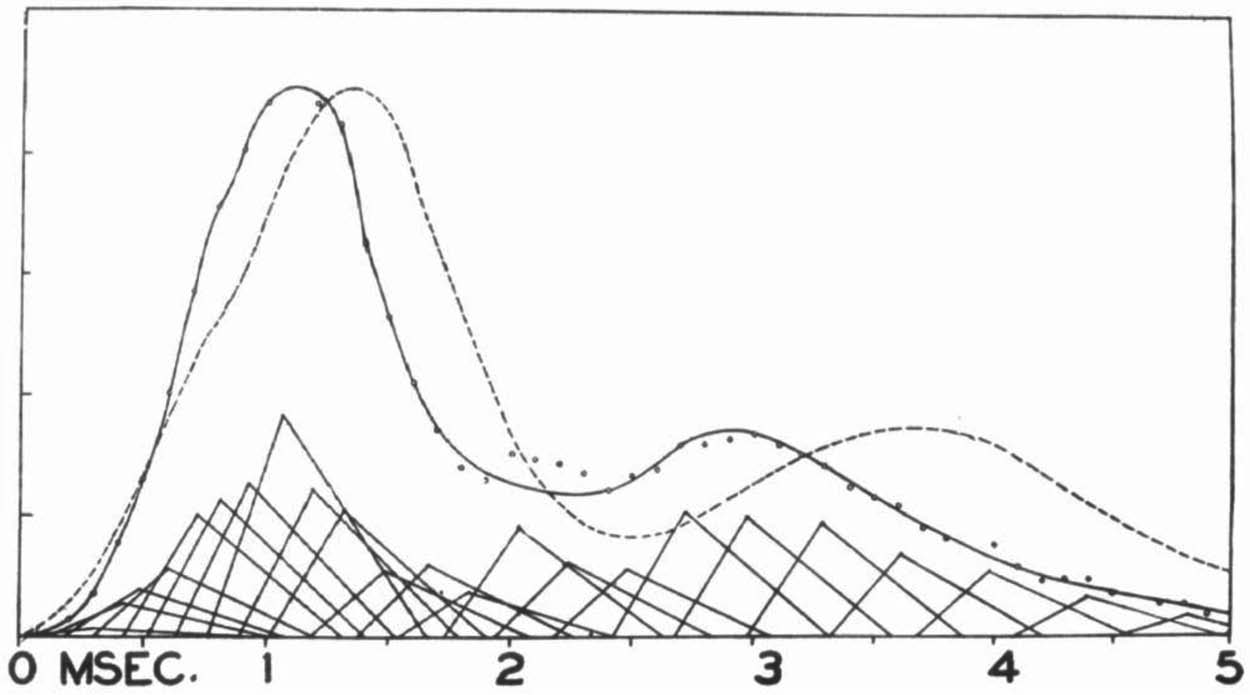
The fact that Erlanger et al. were able to explain their recordings (particularly the approximate location and shape of wavelets) in this non–ad hoc way confirms the reliability of their apparatus. As Erlanger et al. pointed out, the hypothesis that larger nerves conduct more rapidly than smaller nerves is independently plausible on the grounds that larger cables conduct electricity more rapidly than smaller cables (although they admitted that the analogy between nerves and cables is tenuous; Gasser and Erlanger Reference Gasser and Erlanger1927, 523). Erlanger et al. did consider a small number of other possible relationships between conduction speed and fiber size before settling on conduction speed being proportional to fiber diameter, but given the simplicity and plausibility of this relationship and the fact that it yields satisfactory results for many recordings taken from a broad range of nerves, they could hardly be accused of viciously circular reasoning.
As mentioned at the end of the previous section, the hypothesis that fiber diameter is proportional to conduction speed even allowed Erlanger et al. to explain how the form of an action current changes in the presence of interventions. Because the primary peak arrives first, it reflects the contributions of the faster-conducting fibers. By hypothesis, the fastest-conducting fibers are the largest fibers. As Gasser and Erlanger pointed out, it is plausible that larger fibers should fail first under pressure “by analogy with the effect of external pressure on thin-walled tubes, where the large tubes would collapse before the small ones” (Reference Gasser and Erlanger1929, 584). Thus, the independently plausible hypothesis that larger fibers fail first under pressure, in conjunction with the independently plausible hypothesis that conduction speed is proportional to fiber diameter, explains why the primary peak in the action current diminishes first with the application of pressure (see fig. 6). Moreover, this explanation accounts for the fact that motor function fails before sensory function with the application of pressure because motor signals are associated with the largest fibers. In accordance with strategy iii, the fact that Erlanger et al. could explain features of their recordings in this non–ad hoc way confirmed the general reliability of their apparatus.
Process tracing supported Erlanger et al.'s method of raw-data interpretation because it provided a theory of the apparatus, eliminated plausible sources of error, and provided non–ad hoc explanations of their observations. The non–ad hoc explanations supported the overall reliability of Erlanger et al.'s technique for recording certain features of action currents, while the theory of the apparatus provided direct support for their extrapolation procedure.
6. Theory Independence with a Single Technique
The oscillograph's predecessors produced flawed records because of their inertial distortion. Consequently, it was often the case that one could not appeal to one of those other techniques in order to validate an observation made using the oscillograph. Nevertheless, Erlanger et al. had good reason to trust their technique: the method they used to infer its dynamic characteristic does not depend on any worrisome theoretical presuppositions, and the extrapolation of that dynamic characteristic to action currents is supported by multiple, largely independent arguments.
Many authors (e.g., Hacking Reference Hacking1983; Bechtel Reference Bechtel, Fine, Forbes and Wessels1990; Culp Reference Culp, Hull, Forbes and Burian1994, Reference Culp1995; Chalmers Reference Chalmers2003) have emphasized that appealing to multiple independent techniques that converge on a common result is a powerful way to validate one's techniques. Such arguments from coincidence are indeed powerful and an important part of science. However, they cannot account for certain scenarios, such as when one technique makes possible observations that no other technique can replicate (A) and when the results of multiple techniques fail to converge on a single result (B).
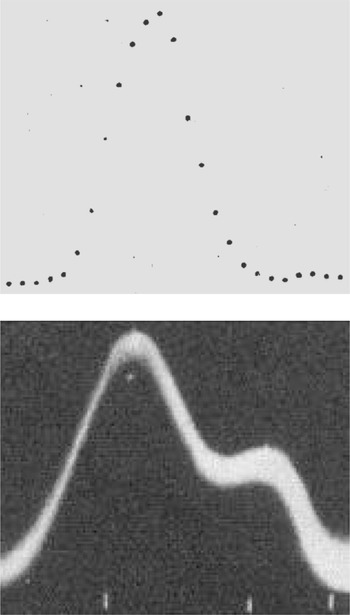
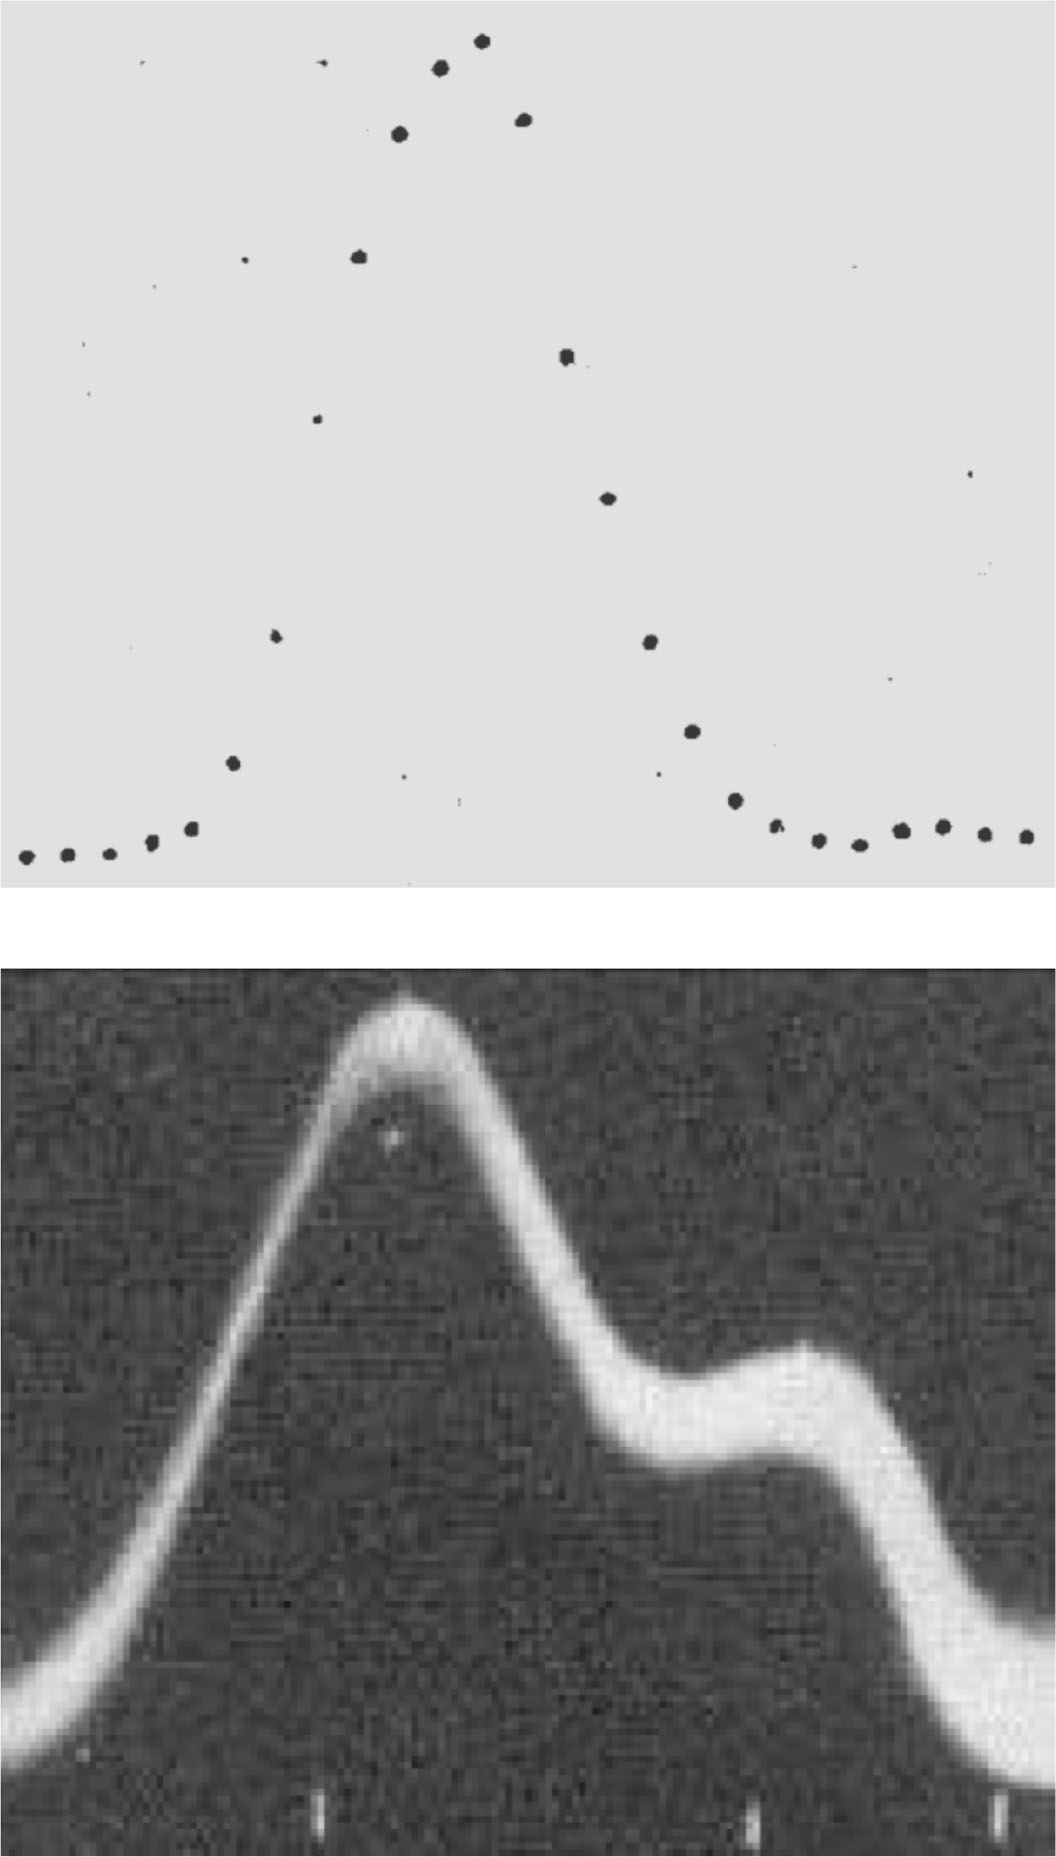
Instances of scenarios A and B arose in the use of the cathode-ray oscillograph. For instance, oscillograph records indicated secondary peaks in voltage during the downward phase of an action current that Erlanger et al. called “wavelets” (fig. 8). According to Erlanger et al., “It is questionable whether the wavelets … correspond to anything that has been previously described” (Reference Erlanger, Gasser and Bishop1922, 519). This case is an instance of scenario A, in which an argument from coincidence is unavailable because only one technique reveals a particular phenomenon. In another case, oscillograph records indicated that the voltage generated by an action current reaches its maximum between 0.54 and 0.72 σ after the start of the action current ( $1\sigma =.001$ seconds), which are “considerably longer durations than those obtained with the capillary electrometer” (517). This case instantiates scenario B, in which an argument from coincidence is unavailable because multiple techniques fail to converge on a single result. Thus, arguments from coincidence were not available either for the claim that the wavelets the oscillograph revealed were real or for the claim that oscillograph measurements of time to maximum and other action current parameters were accurate.
Top, Capillary electrometer record of an action current, corrected for inertial distortion (Lucas Reference Lucas1912, 236). Reprinted with permission of the Journal of Physiology. Bottom, Oscillograph record of an action current, showing a wavelet (Gasser and Erlanger Reference Gasser and Erlanger1924, 629). Reprinted with permission of the American Journal of Physiology.
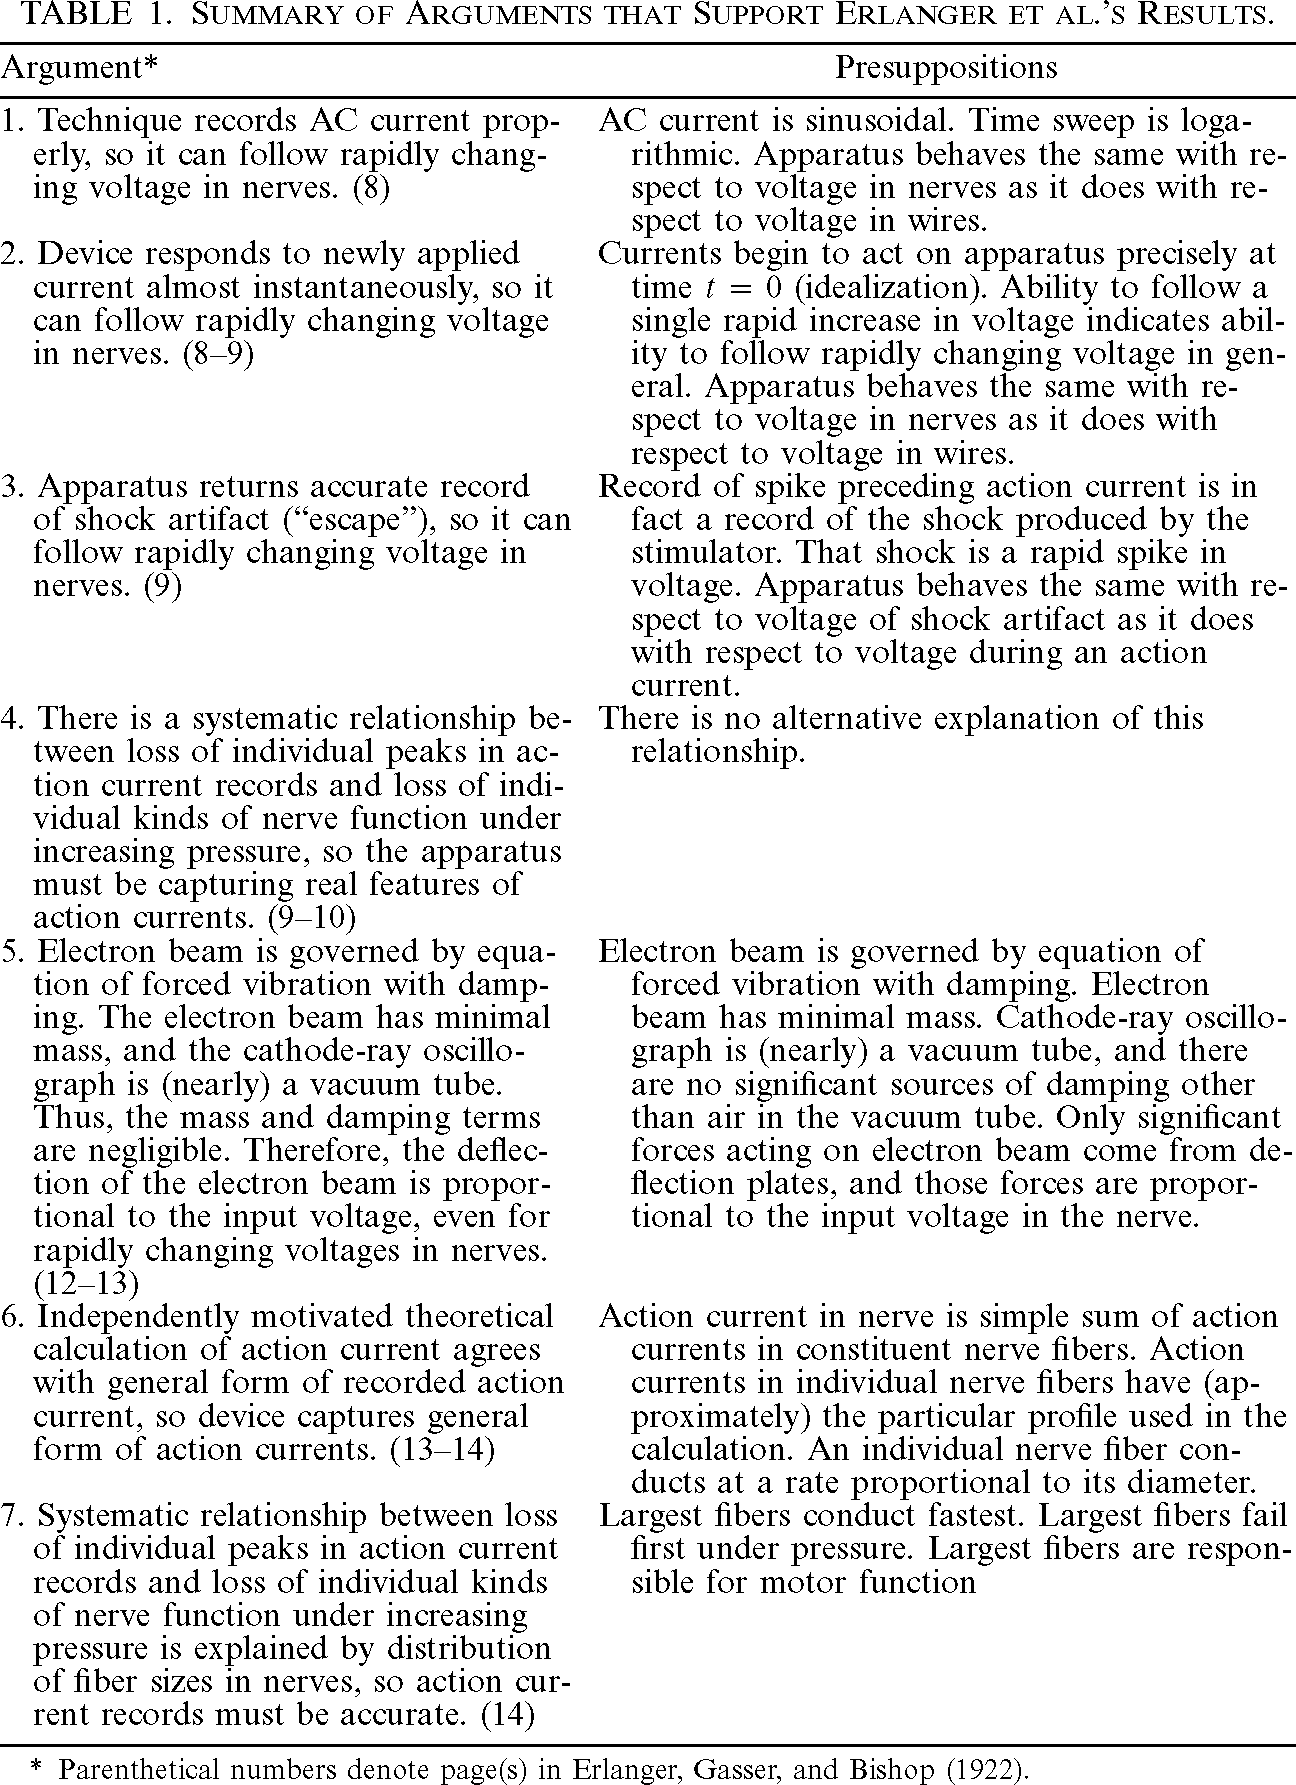
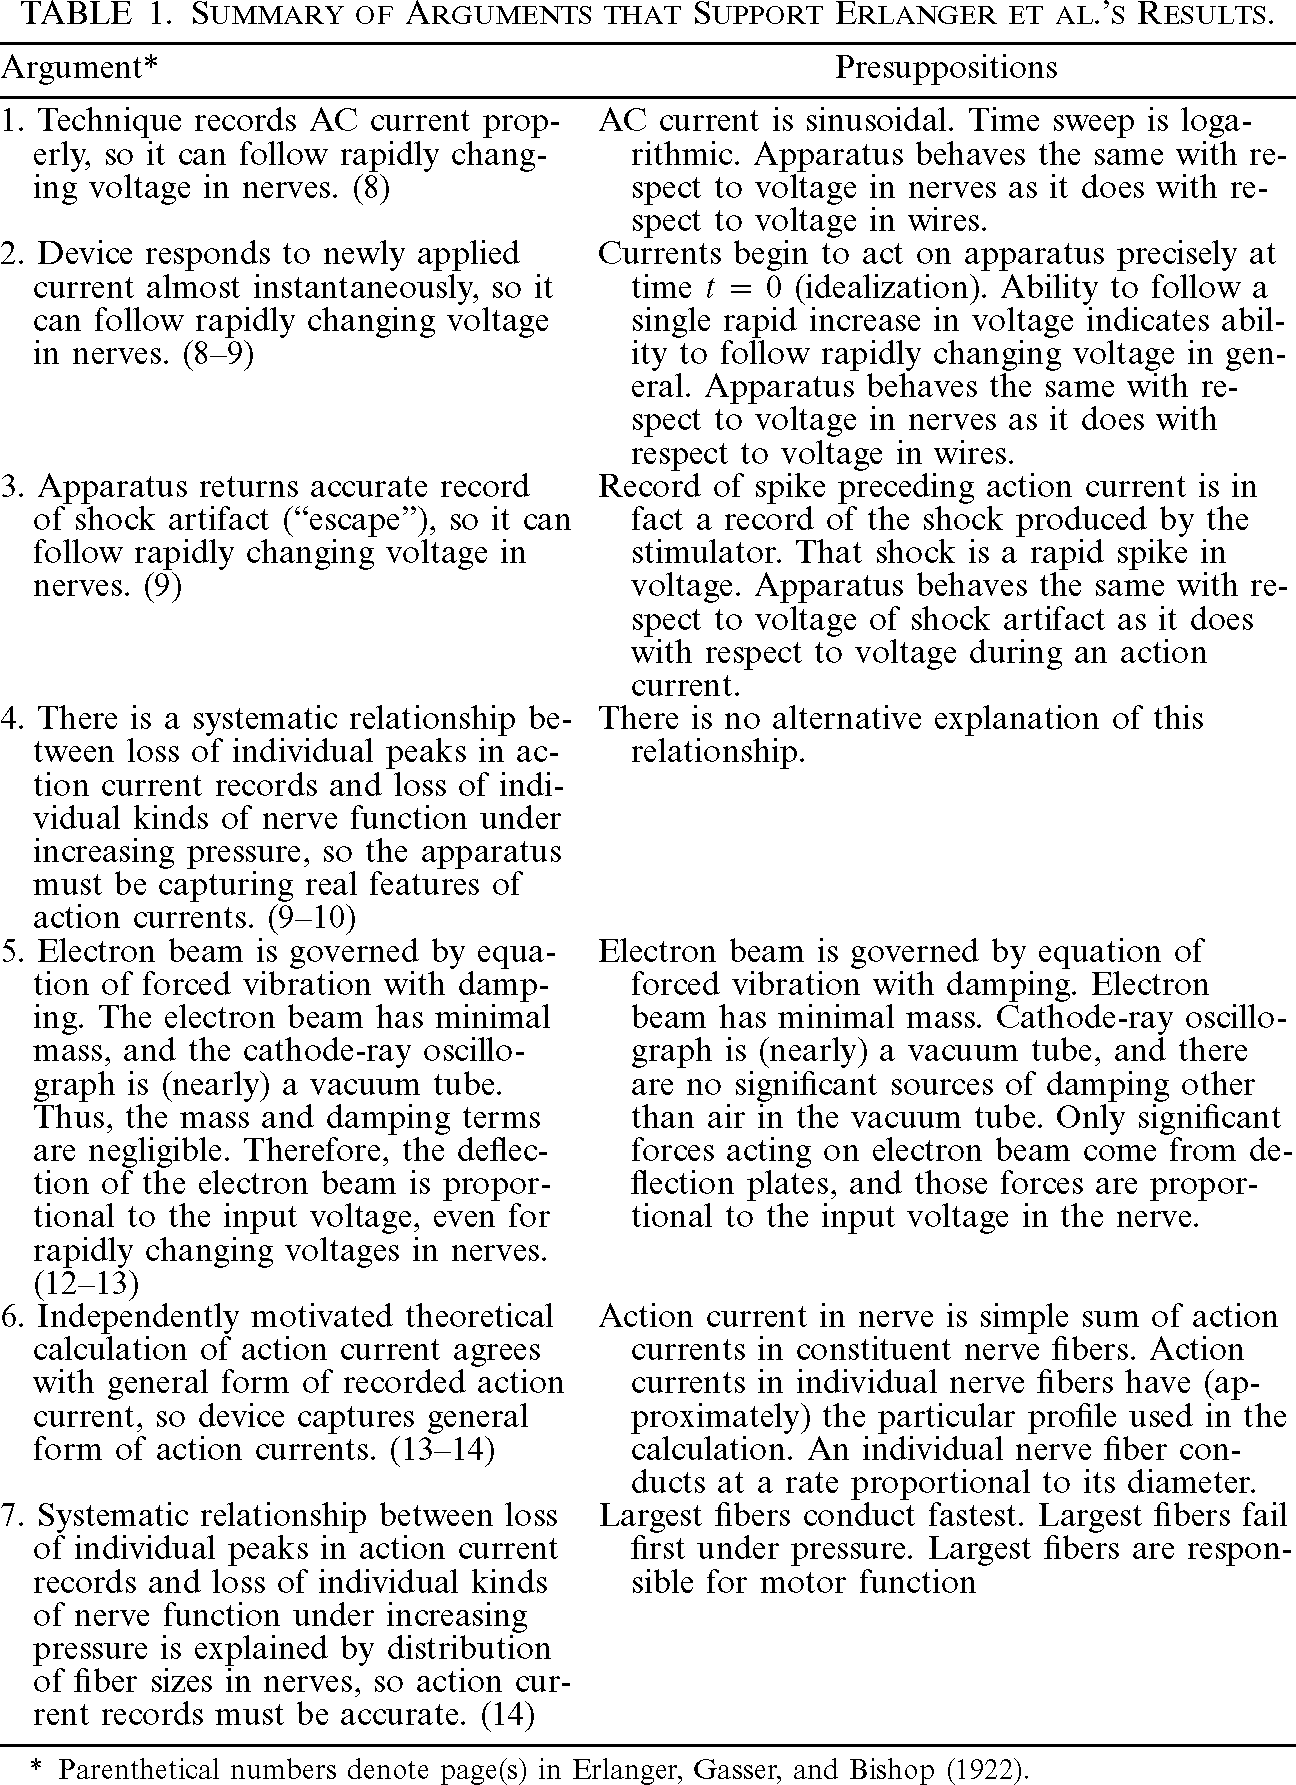
Despite the fact that arguments from coincidence based on convergence with the results of other independent techniques were largely unavailable, worries about theory independence had little force against the cathode-ray oscillograph. Erlanger et al.'s procedure in arriving at their apparatus's dynamic characteristic (sec. 2) was a straightforward instance of direct causal inference in which they manipulated the target and observed the results. The extrapolation from static voltages in nerves to rapidly changing voltages in wires was potentially problematic, but I have recounted seven distinct arguments that supported Erlanger et al.'s method of raw-data interpretation. Table 1 summarizes those arguments and lists their primary presuppositions.
| Argument* | Presuppositions |
|---|---|
| 1. Technique records AC current properly, so it can follow rapidly changing voltage in nerves. (8) | AC current is sinusoidal. Time sweep is logarithmic. Apparatus behaves the same with respect to voltage in nerves as it does with respect to voltage in wires. |
| 2. Device responds to newly applied current almost instantaneously, so it can follow rapidly changing voltage in nerves. (8–9) | Currents begin to act on apparatus precisely at time  $t=0$ (idealization). Ability to follow a single rapid increase in voltage indicates ability to follow rapidly changing voltage in general. Apparatus behaves the same with respect to voltage in nerves as it does with respect to voltage in wires. |
| 3. Apparatus returns accurate record of shock artifact (“escape”), so it can follow rapidly changing voltage in nerves. (9) | Record of spike preceding action current is in fact a record of the shock produced by the stimulator. That shock is a rapid spike in voltage. Apparatus behaves the same with respect to voltage of shock artifact as it does with respect to voltage during an action current. |
| 4. There is a systematic relationship between loss of individual peaks in action current records and loss of individual kinds of nerve function under increasing pressure, so the apparatus must be capturing real features of action currents. (9–10) | There is no alternative explanation of this relationship. |
| 5. Electron beam is governed by equation of forced vibration with damping. The electron beam has minimal mass, and the cathode-ray oscillograph is (nearly) a vacuum tube. Thus, the mass and damping terms are negligible. Therefore, the deflection of the electron beam is proportional to the input voltage, even for rapidly changing voltages in nerves. (12–13) | Electron beam is governed by equation of forced vibration with damping. Electron beam has minimal mass. Cathode-ray oscillograph is (nearly) a vacuum tube, and there are no significant sources of damping other than air in the vacuum tube. Only significant forces acting on electron beam come from deflection plates, and those forces are proportional to the input voltage in the nerve. |
| 6. Independently motivated theoretical calculation of action current agrees with general form of recorded action current, so device captures general form of action currents. (13–14) | Action current in nerve is simple sum of action currents in constituent nerve fibers. Action currents in individual nerve fibers have (approximately) the particular profile used in the calculation. An individual nerve fiber conducts at a rate proportional to its diameter. |
| 7. Systematic relationship between loss of individual peaks in action current records and loss of individual kinds of nerve function under increasing pressure is explained by distribution of fiber sizes in nerves, so action current records must be accurate. (14) | Largest fibers conduct fastest. Largest fibers fail first under pressure. Largest fibers are responsible for motor function |
* Parenthetical numbers denote page(s) in Erlanger, Gasser, and Bishop (Reference Erlanger, Gasser and Bishop1922).
Each of arguments 1–4, arguments by direct causal inference, depends on a small number of fairly unproblematic presuppositions. Even 5–7, which involve process tracing, do not depend on a full-blown theory of the entire technique. Most important, there appears to be no scientifically interesting presupposition on which all of 1–7 depend. The only presuppositions that the arguments all have in common are too mundane to mention and are routinely taken for granted in science, such as the assumption that there is no deceiving demon of the laboratory. Thus, these arguments together support the reliability of Erlanger et al.'s apparatus in a robust, essentially theory-independent way.
7. Conclusion
According to the simple Process-Theory View, “interpretations of raw data depend on theories about the processes being used to produce the raw data” (Culp Reference Culp1995, 450). Contrary to this view, I show that the method Erlanger et al. used to interpret raw data from their cathode-ray oscillograph is supported by multiple, largely independent arguments. Moreover, each argument depends on less than a full theory of the technique, and the arguments do not share any scientifically interesting presuppositions. This is not to say that Erlanger et al.'s work was infallible but rather that their results are generally robust: for them to fail, multiple independent assumptions would have to fail. Appealing to multiple techniques that converge on the same results is one way to achieve robustness, but a high degree of robustness is possible with a single technique.