I. INTRODUCTION
Shape memory alloys are smart materials due to their excellent properties such as shape memory behavior, super elasticity, corrosion resistance, and biocompatibility, and these properties makes them suitable to be used in the robotics, aerospace, and biomedical applications. Reference Fasching, Norwich, Geiser and Paul1 In addition to these properties SMA exhibits SME and PE, high specific strength, greater ductility, and elastic modulus. Reference Lekston, Stroz and Drusik-Pawlowska2,Reference Mazzer, Kiminami, Bolfarini, Cava, Botta and Gargarella3 To further expand their use in several other specific applications, additional alloying elements are to be used. Adding third element in NiTi alloys by replacing Ti or Ni has an extensive effect on their phase transformation behavior and properties of the material. Reference Manjaiah, Narendranath, Basavarajappa and Gaitonde4,Reference Atli, Karaman and Noebe5 Rui and Fu studied the effect of Co addition as a substitute for Ni on the phase transformation behavior and mechanical properties with different percentages of Co 2, 4, 6, 8, and 10 in TiNi alloy. Reference Rui-rui and Fu-shun6 From the literature it was found that Ti50Ni40−x Co x (x = 2–10%) exhibit two step phase transformation and exhibited good ductility with a lower stress plateau because of stress–induced martensite and martensite reorientation at room temperature deformation. The addition of Co in TiNi results in increased loading and unloading plateaus and workability as compared to TiNi alloy. Reference Fasching, Norwich, Geiser and Paul1 Conventional machining of these materials creates poor surface finish, burr formation, low dimensional accuracy of the machined product and high tool wear rate caused due to the characteristic property of the material. Therefore, non-conventional techniques such as laser machining, electrochemical machining, and wire electro discharge machining are suitable for machining of these alloys. Reference Manjaiah, Narendranath and Basavarajappa7–Reference Daneshmand, Monfared and Lotfi Neyestanak9 MRR and SR are most important parameters of all machining processes; these output parameters exhibit the qualities of machining processes. Many researchers have reported in their work that WEDM can produce good surface roughness with better material removal rate during machining of complicated conductive and semi conductive materials without affecting material properties. Reference Gupta and Jain10–Reference Manjaiah, Laubscher, Narendranath, Basavarajappa and Gaitonde12 Most of the published work discussed the effects of third element addition in TiNi alloy on phase transformation and shape memory behavior, however the study of machinability characteristics of such materials are limited. The present work aimed at developing Ti50Ni40Co10 shape memory alloy using vacuum arc melting and to evaluate its machinability characteristics by using nonconventional WEDM process.
II. EXPERIMENTAL PROCEDURE
A. Casting of TiNiCo alloy
Commercially available Titanium (99.3% purity), Nickel (99.90%), and cobalt (99.5%) were charged in to copper crucible in vacuum arc melting furnace to melt SMA of composition Ti50Ni40Co10. Tungsten electrode was used for sparking and melting in an inert argon atmosphere. The vacuum up to 10−5 mbar was created before allowing the argon gas in to the chamber and melting was started. The melting and re-melting is carried out six times to confirm material homogeneity. The materials were melted into button shape followed by further melting into rectangular blocks of size 50 × 12 × 10 mm.
B. EDX and phase analysis of as-cast TiNiCo alloys
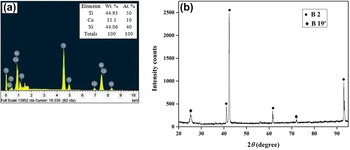
Energy dispersive X-ray (EDX) analysis was performed for as-cast materials using a SEMV018 EDX spectrometer (Carl Zeiss AG, Oberkochen, Germany) for the confirmation of the presence of alloying elements in developed alloys. Figure 1(a) clearly indicates the percentage of alloying elements of Ti, Ni, and Co alloy. The phase analysis was carried out of as-cast alloy by using Bruker D8 advance (Bruker Corporation, Karlsruhe, Germany) using Cu Kα radiation and 2θ scanning rate was 2°/min. B2 austenite phase is present in the as cast alloy with the weak appearance of peaks of B19′ martensite, which can be seen in Fig. 1(b). Similar phase has been observed in TiNiCo alloy and reported by Sharifi et al. Reference Sharifi Mohammad, Karimzadeh and Kermanpur13,Reference Sharifi Mohammad, Kermanpur and Karimzadeh14
(a) EDX analysis of Ti50Ni40Co10 alloy (b) Phase analysis of as cast Ti50Ni40Co10.

C. Machining of the material
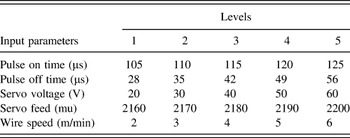
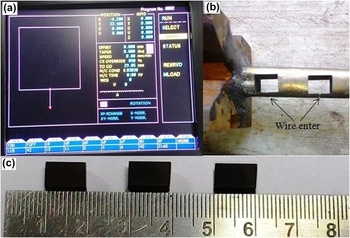
WED machine (Model ELPULS15 CNC, Electronica India Pvt. Ltd., Pune, India) was used for machining of Ti50Ni40Co10 shape memory alloy. Pulse on time (Ton), Pulse off time (Toff), Servo voltage (SV), Servo feed (SF), and Wire speed (WS) were selected as input process parameters and their levels based on trial experiment using response surface design. Reference Majhi, Pradhan and Soni15 Based on the trail experiments, parameters were selected with their different levels are given in Table I. Brass wire of diameter 0.25 mm was used as the tool electrode for electrical discharge, this wire gives superior surface integrity of machined surface compare to zinc coated brass wire Reference Antar, Soo, Aspinwall, Jones and Perez16 and distilled water used as dielectric fluid in the machining process. Figure 2 is an evidence of machining of shape memory alloys whereas Fig. 2(a) indicates the graph of machining program, Fig. 2(b) shows the prepared as cast alloy bar from which the specimen blocks have been cut using WEDM and Fig. 2(c) represents machined samples through Wire electro discharge machining.
Input process parameters and their levels.

(a) Programming graph during machining, (b) As cast alloy bar and (c) Machined samples.

D. Measurement of output responses
Material removal rate is a significant response for production of any product in all manufacturing industries. Hence our interest is to find the optimum process parameters for better MRR and SR. In the current investigation MRR was calculated using Eq. (1).
 $${\rm{MRR\ }}({\rm{m}}{{\rm{m}}^3}/\min ){\rm{\ }} = {\rm{\ cutting\ speed\ }}({\rm{mm}}/{\rm{min}}){\rm{\ }} \times {\rm{\ Kerf\ width\ }}({\rm{mm}}){\rm{\ }} \times {\rm{\ height\ of\ work\ piece\ }}({\rm{mm}})$$
Where, Kerf width (mm) = 2 × spark gap + diameter of wire.
Surface roughness (Ra) is also a noteworthy factor that contributes to the quality of the product. The surface roughness tester SJ-301 (Mitutoyo, Kanagawa, Japan) was used to record the surface roughness of the machined surface. The roughness of each machined surface was measured at three different locations and the average surface roughness (Ra) was reported in the present study. The cut off length of 0.8 mm evaluation length of 3 mm, and the stylus speed of 0.25 mm/s was used to record the surface roughness. Based on the selected process parameters of wire electro discharge machining has been carried out and the values of machining outputs such as MRR and SR are given in Table II.
Machining performance.

Where MRR in mm3/min and SR in µm.
E. Characterization of the machined surface
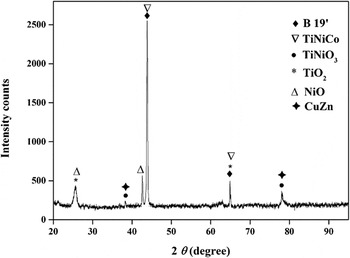
The surface integrity in terms of microstructural features of recast layer formed during wire electric discharge machining was evaluated using scanning electron microscopy (SEM). Since pulse on time and servo voltage has been noticed as most influential process parameters as per observation, therefore recast layer thickness has seen at lower and higher values of pulse on time, servo voltage and it was found that recast layer is thicker at the higher values of pulse on time and lower values of servo voltage. However recast layer formation during wire electro discharge machining is due to the different oxides formation on the machined surface. Hence XRD analysis is carried out to understand the formation of oxides and other changes on the machined surface which is shown in Fig. 8. Where XRD analysis is performed by Bruker D8 using Cu Kα. X-ray radiation of wave length λ = 0.1543 nm, diffraction angle (2θ) was considered ranging from 20 to 95°. Microhardness of the machined surfaces was measured with 300 g load for dwell time of 15 s by using Omni Tech micro hardness tester (Maharashtra, India).
III. RESULTS AND DISCUSSIONS
A. Analysis of material removal rate
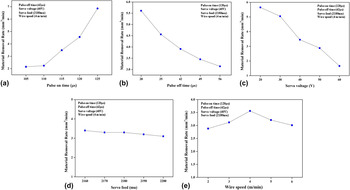
Material removal rate analysis has been carried out for wire electro discharge machining of Ti50Ni40Co10 shape memory alloy with respect to pulse on time (Ton), pulse off time (Toff) servo voltage (SV), servo feed (SF) and wire speed (WS) and their levels which are shown in Figs. 3 (a)–3(e). From Fig. 3(a) it can be seen that MRR increases consistently with increase in pulse on time because at higher pulse on time spark intensity is high which in turn removes more amount of material from the machined surface that results in higher MRR. Reference Soundararajan, Ramesh, Mohanraj and Parthasarathi17 Fig. 3(b) indicates that decreases of MRR with increased pulse off time is inverse in nature which is due to reduction in spark frequency at high pulse off time, results in less amount of material is removed comparatively leading to lower MRR. Similar trend has been observed in Fig. 3(c) where MRR decreases with increased servo voltage. Because of high servo voltage, the average spark gap increases, consecutively decreasing the spark intensity and leading to lower MRR. It is seen from Fig. 3(d) that MRR is almost constant at all specific levels of servo feed. Figure 3(e) shows that MRR increases with increase in wire speed up to 4 m/min. At 4 m/min, more heat is generated at spark gap, this result in more amount of molten material splashed through the machining zone and hence higher MRR. But at lower wire speeds, frequent wire breakage has been observed this causes lower MRR. However after 4 m/min wire speed wire vibration during wire electro discharge machining was noticed, which reduces the dynamic stability of the electrode wire leads to lower MRR. Therefore 4 m/min wire speed has been considered as the optimum value of wire speed in the current study, similar results have been reported by other researchers during the wire electro discharge machining. Reference Saha and Mondal18
The effect of process parameters on MRR (a) Pulse on time versus MRR (b) Pulse off time versus MRR (c) Servo voltage versus MRR (d) Servo feed versus MRR (e) Wire speed versus MRR.

B. Analysis of surface roughness
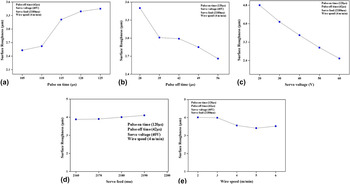
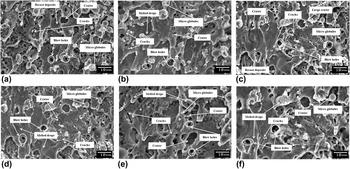
The variation of SR caused due to the wide range of process parameters have been shown in Figs. 4(a)–4(e). Increment in SR is observed with an increase is pulse on time which can be clearly seen in Fig. 4(a). This is due to, at high pulse on time, spark intensity is high and it increases the crater size on the machined surface leading to higher surface roughness. Azhiri et al. Reference Azhiri, Teimouri, Ghasemi Baboly and Leseman19 also observed similar trend during the wire electro discharge machining of Al/SiC metal matrix composite. From microstructures of machined surfaces it is confirmed that at high pulse on time crater size was comparatively bigger which can be seen in Figs. 5(a) and 5(b). However Fig. 4(b) surface roughness decreases with an increase in pulse off time, this is due to higher pulse off time, intensity of spark as well as quantity of molten droplets decreases and this leads to an increase in flushing time in the machining zone, which removes more material by flushing action thereby reducing the surface roughness. Figure 4(c) indicates that surface roughness decreases with increase in servo voltage, during this may be less amount of material are melted on machined surface; as a result of reduced spark intensity and melted material can be easily flushed away from the machined surface through dielectric fluid jet leading to lower surface roughness. Reference Manjaiah, Narendranath, Basavarajappa and Gaitonde4 Surface roughness is almost constant at all specific levels of servo feed which can be seen in Fig. 4(d). Figure 4(e) indicates that surface roughness decreases with increase in wire speed up to 5 m/min due to enhanced splashing of molten material. Further, roughness increases because of wire vibration comes into play. This will cause non uniform sparking conditions during machining and thus create uneven sized craters on the machined surface which leads to higher surface roughness. Reference Sharma, Chakradhar and Narendranath11
The effect of process parameters on SR (a) Pulse on time versus SR (b) Pulse off time versus SR (c) Servo voltage versus SR (d) Servo feed versus SR (e) Wire speed versus SR.

SEM microstructures of machined surface: (a) At high pulse on time (125 µs), (b) Low pulse on time (105 µs), (c) Low servo voltage (20 V), (d) High servo voltage, (e) Low pulse off time (28 µs) and (f) High pulse off time (56 µs).

C. Microstructure analysis
Microstructure analysis has been carried out on the machined surface of Ti50Ni40Co10 alloy. Melted drops, crater, cracks, and micro globules are observed on the machined surface. Which are shown in Figs. 5(a) and 5(e). It is noticed that pulse on time, pulse off time, and servo voltage are major process parameters during WEDM machining. Therefore effects of these parameters on microstructure have been analyzed on machined surface of Ti50Ni40Co10 alloy at lower and higher values of their effective process parameters. It can be seen from Figs. 5(a) and 5(b) that at high pulse on time more cracks, micro globules, and large sized craters are present on machined surface comparatively at low pulse on time. Due to high pulse on time, more amount of thermal energy is transferred to the material which results in the melting of more amount of material from the work piece. This, in turn, contributes to the increase in size of the craters formed on the machined surface and consequently produces a rough surface on the machined components, from Fig. 4(a) indicates clearly the rough surface on the machined surface at high pulse on time. Figures 5(c) and 5(d) represented the microstructures at high and low servo voltage. It can be seen from Fig. 5(c) that at low servo voltage of 20 V, cracks appeared on the machined surface more when compared to samples machined at higher servo voltage. At low servo voltage, surface roughness will be higher due to more intense spark discharge on the machining surface that leads to formation of larger and abrupt crater along with faster resolidification of molten material by dielectric quenching. The entire process is largely complicated during the electrical discharge, the dielectric barrier is broken due to formation of plasma channel which have a temperature of around 10,000 °C that is more than enough to melt, vaporize and disintegrate the material from its bulk core. However this is not sufficient enough to produce the required localized pressure which can splash all the molten material from the machining zone which is to be washed away due to flushing pressure. But some of the molten materials remain attached with the machined surface which tend to entrap some air bubbles and thus produces micro voids and micro globules on the machined surface. The effects of pulse off time on microstructures of machined surface are given in Figs. 5(e) and 5(f). It is evident from figures that at high pulse off time comparatively less surface cracks, micro globules, craters, micro void, melted drops, and blow holes are observed. Because at higher pulse off time more time is allowed for flushing in the machining zone that results in more amount of material removal per unit time from the machined surface. Hence, less re-solidified molten material are found on the machined surface. Reference Choudhary, Kumar and Garg22
D. Analysis of recast layer thickness
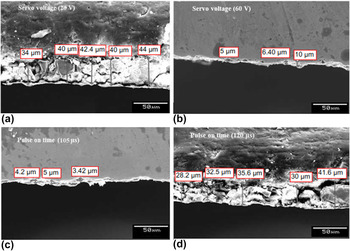
During wire electro discharge machining rapid heating and quenching of the molten material by the dielectric fluid causes the formation of a solidified layer and gets deposited on the machined surface. It is observed that high pulse on time and low servo voltage are major affecting parameters, hence a thicker recast layer deposits has been observed and this can be seen in Figs. 6(a) and 6(d). At higher pulse on time and low servo voltage, more thermal energy is transferred to the workpiece that results in more amount of molten material re-solidify on the surface of workpiece in the machining zone, leading to thicker recast layer on the machined surface. On the other hand, thin film of recast layer was noticed from Figs. 6(b) and 6(c) and is influenced due to lower (105 µs) pulse on time and higher servo voltage (60 V). Similar results have been reported by Sharma et al. Reference Sharma, Chakradhar and Narendranath20 during WED machining of Inconel 706 (Special Metals Corporation, Bangalore, India). As observed from Fig. 6(a) recast layer thickness was in the range of 34–44 µm for machining with lower servo voltage (20 V), whereas at high servo voltage as evident from Fig. 6(b) minimum and maximum recast layer thickness of 5 and 10 µm was observed respectively. Similarly at low pulse on time (105 µs), average recast layer thickness of 4.21 µm was noticed while at high pulse on time (125 µs), average recast layer thickness of 35.4 µm was observed. This is because at high pulse on time workpiece receives more spark discharge of higher intensity which leads to thicker recast layer formation. Longer pulse duration generally leads to higher discharge energy per unit cycle that melts more material and re-solidifies them as well due to rapid quenching by constantly flowing de-ionized water on the machined surface. Reference Hsieh, Hsue, Chen, Lin, Ou and Mao21 During our observation thicker recast layer was found at high pulse on time (125 µs) and lower servo voltage (20 V) while it was thin comparatively at lower pulse on time (105 µs) and higher servo voltage (60 V) which can be seen in Fig. 6.
Cross section morphology shown recast layer at various process parameters (a) at low servo voltage (20 V) (b) at high servo voltage (60 V) (c) at lower pulse on time (105 µs) and (d) at higher pulse on time (120 µs).

E. Microhardness analysis
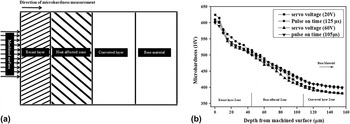
Microhardness has been studied on the machined surface of Ti50Ni40Co10 shape memory alloy at low servo voltage (20 V), high servo voltage (60 V), low pulse on time (105 µs), and higher pulse on time (125 µs). During the machining process three kind of layers are generated on the machined surface such as recast layer, heat affected zone, and converted layer Reference Choudhary, Kumar and Garg22 which is shown in Fig. 7(a) Recast layer near the cutting edge was considered as a starting point (0 µm) and measure the microhardness toward the base material, microhardness results are shown Fig. 7(b). Recast layer formed on the machined surface was about 3.5–45 µm which was hard and 442 HV average microhardness is noticed in this zone. This high hardness on the machined surface is due to formation of surface oxides of TiO2, NiTiO3, and NiO. Below the recast layer heat affected zone gives 375 HV average hardness, this may be due to phase transformation in the TiNiCo alloy which can be seen in Fig. 8. Beneath the heat affected zone converted layer shows hardness of 343 HV. Converted layer is not much affected during WEDM process hence hardness was almost constant in this zone. Such kind of variation in hardness were noticed by Hsieh et al. Reference Hsieh, Hsue, Chen, Lin, Ou and Mao21,Reference Hsieh, Chen, Lin, Lin and Chiou23 during the electro discharge machining of TiNiZr and TiAlfe alloys.
(a) Schematic diagram of three kinds of layers on machined component (b) Micro hardness analyses of the TiNiCo alloy after machining.

XRD pattern of the machined surface.

F. XRD analysis of the machined surface
The assessment of the XRD patterns to identify the phases which are present on the surface of machined component, phases were analyzed by using X’Pert high score plus software (PANalytical B.V., Almelo, The Netherlands). Generally XRD analyses are performed on specific surfaces that are subjected to high temperature which may lead to transformation to different phases. Since wire electro discharge machining involves melting of surface material caused due to electrical discharge, XRD analysis has been carried out for high pulse on time (125 µs) and lower servo voltage (20 V) because at this parameters thicker recast layer was noticed, which is induced by oxides formation during the wire electro discharge machining and can be seen in Fig. 6. From Fig. 8 X-RD graph indicates the presence of B19′ martensite phase and TiNiCo peaks of the shape memory alloy. Other peaks in TiNiO3, TiO2, NiO, and CuZn were also noticed on the machined surface. However the formation of TiNiO3, TiO2, and NiO oxides are credited to the high reactivity of Ti, Ni, and Co with demineralised water used as the dielectric fluid during machining. During the wire electro discharge machining part of the tool material (brass wire) melted and deposited on the machined surface Reference Kim and Kruth24 that causes the formation of CuZn on the machined surface. The formation of oxides are responsible for recast layer on the machined surface that results in increment of net increase in hardness of the machined surface which is evident from Fig. 7(b). Similar trend have been observed by Hsieh et al. Reference Hsieh, Hsue, Chen, Lin, Ou and Mao21 during the machining of TiNi based ternary alloys.
IV. CONCLUSION
The effect of input process parameters of wire electro discharge machining of Ti50Ni40Co10 based shape memory alloy were observed with respect to material removal rate, surface roughness, microstructural study, recast layer thickness, and micro hardness. Based on the results and discussions the following conclusions are drawn:
-
(1) Pulse on time, pulse off time, and servo voltage were observed as major effective process parameters during wire electro discharge machining of Ti50Ni40Co10 shape memory alloy. Material removal rate and surface roughness both increases with increased pulse on time while both decreases with increased pulse off time and servo voltage.
-
(2) Formation of micro cracks, micro globules, micro voids are more consistent at high pulse on time 125 µs and at low servo voltage 20 V and hence the machined surface offer poor surface quality.
-
(3) The cross sectional microstructure of the machined surface of Ti50Ni40Co10 revealed that recast layer surface is more thick at pulse on time of 125 μs and low servo voltage of 20 V. Moreover, minimum RLT was obtained at low pulse on time and high servo voltage.
ACKNOWLEDGMENT
This work was supported by the Department of Science and Technology (DST) Government of India project reference no. SB/S3/MMER/0067/2013. Authors would like to thank DST for its funding support.