


1. Introduction
Turbulent boundary layers over spanwise heterogeneous surfaces have received special attention in the past decade, as they can induce secondary motions that penetrate deep into the outer layer. Such motions have been found to produce ‘dispersive’ or ‘coherent’ stresses that significantly change heat and momentum transfer in turbulent boundary layers, and are therefore of great interest for the atmospherical, geological and industrial communities (Margairaz, Pardyjak & Calaf Reference Margairaz, Pardyjak and Calaf2020a; Stroh et al. Reference Stroh, Schäfer, Forooghi and Frohnapfel2020a). A vast number of numerical and experimental investigations have discussed neutrally buoyant flows over spanwise varying surface roughness where the dominant heterogeneity length scale is of the order of the outer scale (e.g. Chung, Monty & Hutchins Reference Chung, Monty and Hutchins2018; Hwang & Lee Reference Hwang and Lee2018; Medjnoun, Vanderwel & Ganapathisubramani Reference Medjnoun, Vanderwel and Ganapathisubramani2018; Vanderwel et al. Reference Vanderwel, Stroh, Kriegseis, Frohnapfel and Ganapathisubramani2019; Neuhauser et al. Reference Neuhauser, Schäfer, Gatti and Frohnapfel2022). The streamwise vortices that are created in these flows are commonly categorized as Prandtl's secondary flow of the second kind, as they are associated with the heterogeneity of turbulent stresses (Bradshaw Reference Bradshaw1987; Anderson et al. Reference Anderson, Barros, Christensen and Awasthi2015). Effects of stable and unstable thermal stratification on these roughness-induced secondary motions have lately been addressed by Forooghi, Yang & Abkar (Reference Forooghi, Yang and Abkar2020) and Schäfer, Frohnapfel & Mellado (Reference Schäfer, Frohnapfel and Mellado2022), respectively. In addition to heterogeneous roughness, it was recently demonstrated that spanwise varying thermal surface properties can also induce strong secondary flows in stratified channels.
Bon & Meyers (Reference Bon and Meyers2022) showed the presence of secondary motions by direct numerical simulation (DNS) of a stably stratified channel flow with laterally varying temperature boundary conditions. Compared with equivalent stably stratified homogeneous channels, where no secondary motions are present, heat transfer over the thermally heterogeneous surfaces was reduced, while skin friction increased in most cases. Furthermore, the contribution of secondary flows to skin friction and heat transfer, measured by their dispersive components, were shown to be significant. Around the same time, Salesky, Calaf & Anderson (Reference Salesky, Calaf and Anderson2022) reported on secondary currents in large-eddy simulations of unstable channel flow with prescribed spanwise heterogeneous heat flux. Supported by scaling arguments based on the transport equation for Reynolds-averaged streamwise vorticity, they argue that the secondary flows are induced by thermal torque that originates from the thermally heterogeneous boundary conditions. As these thermally induced secondary motions are ‘locked in’ to the heterogeneity, they should be distinguished from the turbulent horizontal convective rolls that are formed in weakly to moderately unstable stratified flows with strong shear over homogeneous surfaces (Pirozzoli et al. Reference Pirozzoli, Bernardini, Verzicco and Orlandi2017; Salesky, Chamecki & Bou-Zeid Reference Salesky, Chamecki and Bou-Zeid2017). Furthermore, Salesky et al. (Reference Salesky, Calaf and Anderson2022) defined the circulations generated by thermal surface heterogeneity as ‘high and low momentum pathways’ (HMPs and LMPs). In these thermally induced secondary flows, the upward motions and LMPs are consistently centred above the strips with higher temperature, while downward motions and HMPs appear above strips with lower temperature (Bon & Meyers Reference Bon and Meyers2022; Salesky et al. Reference Salesky, Calaf and Anderson2022). By contrast, the rotational direction of roughness-induced secondary motions depends on how the heterogeneity is modelled, commonly with either ‘strip-type’ or ‘ridge-type’ roughness (see e.g. Stroh et al. Reference Stroh, Schäfer, Frohnapfel and Forooghi2020b). Despite these qualitative differences, Bon & Meyers (Reference Bon and Meyers2022) showed that the impact of thermally induced secondary motions on global momentum and heat transfer can be similar to cases with secondary circulations generated by roughness heterogeneity (compare e.g. the dispersive friction coefficient  $C_f^D$ of Stroh et al. (Reference Stroh, Schäfer, Forooghi and Frohnapfel2020a) to figures 4 and 12 of Bon & Meyers Reference Bon and Meyers2022).
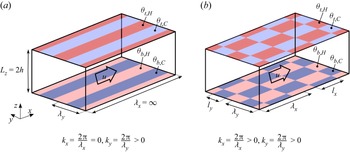
In the majority of studies that have considered secondary motions induced by spanwise varying surface properties, the streamwise direction is kept homogeneous, as depicted in figure 1(a). This implies that the heterogeneous strips can be deemed infinitely long. The present work abandons that assumption, by investigating stably stratified channel flow over spanwise heterogeneous temperature patches of finite length. Hence, this is an extension of the work reported by Bon & Meyers (Reference Bon and Meyers2022) from one- to two-dimensional heterogeneity. The first aim of this paper is to investigate the spatial development of the secondary flows and the impact of the streamwise length scale ( $\lambda _x/h$, see figure 1b) of the spanwise inhomogeneity on the global heat and momentum transfer in the channel. Relevant research questions include how long the temperature patches should be to reach the limit of infinitely long strips, and the opposite, below which length the flow experiences no global effect of inhomogeneity. This is further analysed by applying triple decomposition (Raupach & Shaw Reference Raupach and Shaw1982) to examine the importance of dispersive fluxes. In addition, we provide a direct quantitative comparison between the strength of thermal- and roughness-induced secondary motions, since this has not been done in previous studies. Several prior investigations have examined roughness-induced secondary flows in arrangements that were not homogeneous in the streamwise direction, as we do in the current work. The DNS configuration of Hwang & Lee (Reference Hwang and Lee2018) included a streamwise transition from a smooth to a rough wall with longitudinal ridges, allowing them to study the spatial development of the secondary flow. They found that near the transition from rough to smooth, three distinct counter rotating vortex pairs are present, while further downstream, one of them dominates until a ‘fully developed secondary flow state’ is reached after approximately
 $25\delta _o$ (
 $\delta _o$ being the initial boundary layer thickness). Medjnoun et al. (Reference Medjnoun, Rodriguez-Lopez, Ferreira, Griffiths, Meyers and Ganapathisubramani2021) showed the presence of large-scale secondary motions in an experimental study of flow over multi-scale fractal roughness elements in an aligned configuration, where spanwise spacing between the largest cuboids was of the same order as the boundary layer height. They moreover demonstrated that the form-induced dispersive stresses were significant in the outer layer and Townsend's outer-layer similarity hypothesis is not valid in these cases. When the same roughness elements were placed in a staggered arrangement by Viggiano et al. (Reference Viggiano, Bossuyt, Ali, Meyers and Cal2022), the effect on the global velocity defects in the outer layer was only minimal compared with a smooth wall and there were no large-scale secondary flows. We could roughly view the relationship between these two configurations as a ‘roughness equivalent’ to the link between the present subject of two-dimensional heterogeneous temperature and the study of temperature variations in the spanwise direction by Bon & Meyers (Reference Bon and Meyers2022) (compare figures 1a and 1b).
Schematic overview of stable channel flow set-up with inhomogeneous surface temperatures.(a) Spanwise heterogeneous, streamwise homogeneous as in Bon & Meyers (Reference Bon and Meyers2022), characterized by spanwise wavelength  $\lambda _y$. (b) Two-dimensional (spanwise and streamwise) heterogeneous surface temperatures, defined by wavelengths
 $(\lambda _x, \lambda _y)$ or patch dimensions
 $(l_x, l_y)$.

In the context of the atmospheric boundary layer (ABL), surface temperature heterogeneities have been studied for a longer time, because situations in which abrupt changes of surface temperature or heat flux occur are abundant. Examples include urban or deforested areas, coastlines of water bodies such as oceans, lakes and rivers, or ice floes and ‘leads’ in polar areas (Mahrt Reference Mahrt2000; Bou-Zeid et al. Reference Bou-Zeid, Anderson, Katul and Mahrt2020). For numerical weather prediction (NWP) models, it can be problematic if the scales of these heterogeneities are smaller than the grid resolution and their effects disrupt the mean flow (Margairaz, Pardyjak & Calaf Reference Margairaz, Pardyjak and Calaf2020b). Furthermore, recent studies assert that surface temperature heterogeneity contributes to the imbalance of the earths surface energy budget as measured by eddy-covariance methods (Roo & Mauder Reference Roo and Mauder2018; Margairaz et al. Reference Margairaz, Pardyjak and Calaf2020a; Wanner, Calaf & Mauder Reference Wanner, Calaf and Mauder2021).
A rather specific example of one-dimensional temperature heterogeneity in an ABL context is the so-called lead, a narrow opening in the sea ice cover, where the polar water surface is typically much warmer than the ice surface. The ABL response on leads of different widths has been studied by Esau (Reference Esau2007) using large eddy simulation (LES), and more recently by Wenta & Herman (Reference Wenta and Herman2018) using the weather research and forecasting (WRF) model. The latter also considered random sized circular temperature patches of high and low temperature, representing floes of fragmented sea ice. Wenta & Herman (Reference Wenta and Herman2019) investigated the influence of floe size distribution on ABL convection and proposed a correction factor to parametrise these sub-grid effects in the calculation of surface moisture heat flux in NWP models.
A number of previous LES studies considered convective boundary layers (CBLs) over thermal heterogeneous surfaces consisting of square patches. For example, Raasch & Harbusch (Reference Raasch and Harbusch2001) showed the presence of significant secondary circulations in a CBL over a surface with heterogeneous heat flux in a chessboard pattern, while stressing that these motions depend on many parameters such as wind speed, wind direction, size and amplitude of the surface inhomogeneity. Furthermore, their results indicated that discontinuous inhomogeneities, as used in the present study as well, have similar but stronger effects than continuous (sinusoidal) inhomogeneities. In an idealized LES study of a CBL over square patches with randomly distributed temperature, Margairaz et al. (Reference Margairaz, Pardyjak and Calaf2020a) demonstrated that the effect of surface inhomogeneity on the flow reduces with increasing geostrophic forcing, while it seems independent on the specific spatial distributions that they considered. They propose that dispersive heat fluxes can be used as a measure of the footprint that thermal heterogeneities have on the flow, if the geostrophic forcing is small.
In observational studies of the ABL, Monin–Obukhov similarity theory (MOST) plays a central role as a means of surface-layer scaling. It is also commonly used in atmospheric modelling to relate average surface momentum and heat flux to velocity and potential temperature on the first level of LES or large-scale models (Mahrt Reference Mahrt2014; Bou-Zeid et al. Reference Bou-Zeid, Anderson, Katul and Mahrt2020). However, MOST assumes that fluxes are constant and the surface is homogeneous, which is of course often violated. A number of numerical studies that considered stably stratified flows over surfaces with streamwise varying temperature boundary conditions showed that MOST does not hold in these situations. Stoll & Porté-Agel (Reference Stoll and Porté-Agel2009) used LES to examine a stable boundary layer (SBL) over strips with 3 and 6 K temperature difference, and found higher turbulence levels and stronger vertical mixing than over a homogeneous surface. Moreover, they reported significant effects on mean wind speed and temperature profiles, concluding that standard MOST is not valid in these heterogeneous flows. Mironov & Sullivan (Reference Mironov and Sullivan2016) used a comparable configuration but with a sinusoidal streamwise temperature variation instead of discrete patches, concluding that the enhanced temperature variance near the heterogeneous surface results in reduced magnitude of downward heat flux. Most recently, Mironov & Sullivan (Reference Mironov and Sullivan2023) extended this work towards a very strongly stratified boundary layer, by means of DNS of a plane Couette flow. In addition to corroborating their previous findings, they show the presence of local convective instabilities and upward eddy heat transport due to quasi-organized cell-like structures that are generated by the surface heterogeneity. Both studies also indicate that MOST is not valid for thermally heterogeneous surfaces, concluding that new flux-profile relations are required. The last aim of the present work is to shed light on the validity of classic scaling relations, such as MOST, for stably stratified flows over surfaces with spanwise and two-dimensional anisotropic surface temperature heterogeneities (see figure 1).
The remainder of this text is organized as follows. The numerical methodology and details of input parameters for the DNS are described in § 2, while the results are presented and discussed in § 3. The first goal of the paper, to gain insight in the streamwise development of thermally induced secondary vortices, is addressed in § 3.1. By inspecting global heat and momentum transfer in § 3.2, we investigate the degree to which finite-length spanwise heterogeneities resemble the limiting case of infinitely long strips, and conversely, below which patch length the global effect of the inhomogeneities is negligible. To gain more insight in the vertical flow structure and the importance of dispersive motions, we examine the distribution of vertical fluxes and variances in § 3.3. Section 3.4 focuses on our final objective of evaluating the accuracy of existing mean-profile scaling relationships, i.e. local MOST and classic outer-layer scaling, for stable channel flows with one- and two-dimensional surface temperature variations. Lastly, we present a more general discussion on the relevance and interpretation of the results in § 3.5. Our central conclusions are then summarized in § 4. Appendices B.1 and B.2 provides some additional mean profiles of the high-Reynolds-number cases.
2. Numerical methods and case set-up
2.1. DNS framework
A series of DNSs has been carried out using a fully developed turbulent closed channel flow driven by a fixed pressure gradient. The incompressible Navier–Stokes equation under the Boussinesq approximation and convection–diffusion equation for potential temperature are numerically integrated using the LES/DNS code SP-Wind, developed at KU Leuven. More details on this code are given by Allaerts (Reference Allaerts2016) and Bon & Meyers (Reference Bon and Meyers2022). The governing equations are made non-dimensional using the friction velocity  $u_\tau = (\tau _w/\rho )^{1/2}$ (with
 $\tau _w$ the wall-shear stress and
 $\rho$ the constant background density), half-channel height
 $h$ and the fixed mean vertical temperature difference
 $\Delta _z\theta = \langle \theta _{t}\rangle - \langle \theta _{b}\rangle$. Note that throughout this text,
 $\Delta _z$ indicates a vertical difference, subscripts
 $t$ and
 $b$ are used to indicate top and bottom surface, and angular brackets
 $\langle {\cdot } \rangle$ denote that a variable is averaged over the horizontal directions. In addition, the pressure gradient that is used to drive the flow is constant in all simulations. This driving force directly fixes the friction velocity since
 $u_\tau = \sqrt {(h/\rho ) (\partial P/\partial x)}$ in a fully developed channel flow. The governing equations are therefore fully characterized by three non-dimensional numbers: the friction Reynolds number, friction Richardson number and Prandtl number, respectively defined as
 \begin{equation} Re_\tau = \frac{u_\tau h}{\nu}, \quad Ri_\tau = \frac{hg\beta \Delta_z\theta}{ u_\tau^2}, \quad Pr = \frac{\nu}{\alpha}. \end{equation}
As usual,  $\nu$ is the kinematic viscosity,
 $\alpha$ the thermal diffusion coefficient,
 $g$ the gravitational acceleration and
 $\beta$ the thermal expansion coefficient.
2.2. Description of cases
An overview of all simulations is given in table 1. Three sets of cases with heterogeneous temperature are considered, two at  $Re_\tau =180$ and one more computationally expensive set at
 $Re_\tau =550$. The Prandtl number in all cases is set to 0.71 to match the value of air. Regarding the thermal stability, we note that a too large
 $Ri_\tau$ at low Reynolds numbers may result in intermittent turbulence and full laminarization. The linear stability analysis of Gage & Reid (Reference Gage and Reid1968) and the
 $Re_\tau - Ri_\tau$ diagram of Zonta & Soldati (Reference Zonta and Soldati2018) (their figure 4) may be used as a guideline to determine a priori to which regime a (homogeneous) pressure driven channel flow belongs. To make sure that our simulations with low and higher Reynolds number are comparable and both belong to the weakly stratified turbulent regime, all simulations have
 $Ri_\tau = 120$. This also enables easy comparison to cases from Bon & Meyers (Reference Bon and Meyers2022) and allows to limit our parameter space.
Overview of simulations. Computational domains (CDs) are further specified in table 2. Presented layout parameters are streamwise and spanwise wavelengths  $\lambda _x/h$ and
 $\lambda _y/h$ (as in figure 1), wavenumbers
 $k_xh$ and
 $k_yh$, and aspect ratio
 $a = \lambda _x/\lambda _y$. Resulting global flow quantities are also provided: bulk Reynolds and Richardson numbers, stability parameter, skin friction coefficient, Nusselt number and volume-averaged dispersive kinetic energy. See §§ 2 and 3.2 for definitions.

Details on the computational domain (CD) size and grid resolution.  $L_x, L_y, L_z$ refers to the streamwise, spanwise and vertical dimensions,
 $N_x, N_y, N_z$ to the number of grid points in each dimension, and
 $\Delta x^+$,
 $\Delta y^+$ and
 $\Delta z^+$ to the grid spacing in wall units.
 ${T_{av}u_\tau }/{h}$ denotes the time period used to calculate statistics in each domain.

The numerical domain is schematically depicted in figure 1. The temperature heterogeneity at the channels’ lower and upper surfaces is determined by the streamwise wavelength  $\lambda _x/h$ and spanwise wavelength
 $\lambda _y/h$, while we will denote the length and width of individual patches as
 $l_x = \lambda _x/2$ and
 $l_y = \lambda _y/2$, respectively. In streamwise homogeneous cases, we consider
 $\lambda _x/h = \infty$ and the corresponding wavenumber
 $k_xh = 2{\rm \pi} h/\lambda _x=0$. The temperature difference between the hot and cold patches,
 $\Delta _{xy}\theta = \theta _{b,H} - \theta _{b,C} = \theta _{t,H} - \theta _{t,C}$, is equal at the bottom and top, where we used again subscripts
 $b,t$ to denote bottom and top, and
 $H, C$ to indicate hot and cold patches. For simplicity, we take this horizontal temperature difference equal to the mean vertical temperature difference between the top and bottom surface:
 $\Delta _{xy}\theta = \Delta _z\theta$. Since our configuration is symmetric about the channel centre, we present results of the lower channel half only. The temperature transitions at the surface are smoothed over a few grid points using a Gaussian function to avoid oscillations in our spectral code. Details on the smoothing procedure and how it reduces spurious oscillations are provided in the first section of Appendix A. The preliminary tests reported there show that the effect of smoothing the temperature transition does not significantly alter the main results. This corroborates the findings of Raasch & Harbusch (Reference Raasch and Harbusch2001), which also indicated that the effects of inhomogeneous temperature mainly depend on the inhomogeneity ‘amplitude’ and not on the smoothness of the transition. Moreover, in the context of heterogeneous roughness with different modelling approaches, Neuhauser et al. (Reference Neuhauser, Schäfer, Gatti and Frohnapfel2022) explain that the details of the transition of the boundary conditions are contained only in the high wavenumber part of the spectrum, which decays rapidly away from the wall. Therefore, they concluded that the (spanwise) gradient of the inhomogeneous boundary condition has only a very small effect on the turbulent secondary flow.
The two sets at  $Re_\tau =180$ are distinguished by their spanwise wavelengths
 $\lambda _y/h$, namely
 ${\rm \pi} /4 (\approx 0.79)$ and
 ${\rm \pi} /2 (\approx 1.57)$. In our earlier study, we found that these heterogeneity lengths have the largest global impact on the flow (Bon & Meyers Reference Bon and Meyers2022). This is in agreement with a vast number of roughness studies showing that flow response to spanwise heterogeneous roughness is strongest for wavelengths of approximately 1 to 1.5 times the outer scale (e.g. Medjnoun et al. Reference Medjnoun, Vanderwel and Ganapathisubramani2018; Zampino, Lasagna & Ganapathisubramani Reference Zampino, Lasagna and Ganapathisubramani2022).
The streamwise wavelength of the temperature patches is varied between  ${\rm \pi} h/4$ and
 $16{\rm \pi} h$. In table 1, each surface temperature layout is named according to the format X[
 $\lambda _x/({\rm \pi} h)$]Y[
 $\lambda _y/({\rm \pi} h)$]. The letter ‘h’ instead of a number implies that direction to be homogeneous. For example, case XhY0.5 has spanwise wavelength
 ${\rm \pi} h/2$ and is homogeneous in the streamwise direction. For completeness, the wavenumbers
 $k_i = 2{\rm \pi} /\lambda _i$ and patch aspect ratio
 $a = \lambda _x/\lambda _y = k_y/k_x$ are also provided in table 1. For the cases with
 $Re_\tau = 180$, the patch aspect ratio varies between 1 and 32. In the set with
 $Re_\tau = 550$, the range of aspect ratio is smaller due to domain size limitations and higher computational cost (see § 2.3).
To assess the effect of the finite streamwise patch length on secondary flows induced by spanwise heterogeneity, we compare each set to the corresponding case with homogeneous  $x$-direction (
 $k_x = 0$, layout starting with ‘Xh’) and equal
 $\lambda _y$ and
 $Re_\tau$ (as in figure 1a). Moreover, for both Reynolds numbers, a completely homogeneous layout is also included, i.e. with
 $k_x =k_y =0$, named ‘XhYh’. We note that all streamwise homogeneous simulations (with
 $k_x = 0$) were reused from Bon & Meyers (Reference Bon and Meyers2022).
2.3. Numerical details
The computational domain that was used for each case is indicated in the second column of table 1, with details of the grid resolution and domain size provided in table 2. These specifications match those used by Bon & Meyers (Reference Bon and Meyers2022). At  $Re_\tau =180$, a rather large domain size of
 $8{\rm \pi} h \times 4{\rm \pi} h$ (domain A) is required to avoid full laminarization caused by damping of turbulence by the stable stratification (García-Villalba & del Álamo Reference García-Villalba and del Álamo2011). For the case with
 $\lambda _x/h = 16{\rm \pi}$, a longer domain was needed, indicated by AL. The same holds for the case with
 $\lambda _x/h = 8{\rm \pi}$ at
 $Re_\tau = 550$ (indicated by BL). Another doubling of
 $\lambda _x/h$, and thus the domain length, would increase the computational cost at
 $Re_\tau =550$ even further, which is why this case is not included. To ensure that the domain size is sufficient for the cases with the largest streamwise wavelength, i.e.
 $\lambda _x = L_x$, we performed another simulation with layout X4Y0.5 but half the domain length. Given that we found no significant differences in key parameters compared with the case with the full length, we can conclude that the domain is long enough.
Due to the pseudo-spectral nature of our DNS code, the horizontal grid spacing is uniform. In viscous units (i.e.  $\Delta x^+ = Re_\tau \Delta x/h$), the horizontal resolution is equal in all cases. Nonlinear terms are treated using the 3/2-dealiasing rule (Canuto et al. Reference Canuto, Hussaini, Quarteroni and Zang2007), which increases the resolution for these contributions in physical space. The grid in the wall-normal (
 $z$) direction is stretched with a symmetric hyperbolic tangent function, and the size of the smallest and largest vertical grid cells are reported in table 2. Ghiasi et al. (Reference Ghiasi, Li, Komperda and Mashayek2018) outline two general criteria for vertical resolution in DNS of wall-bounded turbulent flows, being that (i) the first grid point is placed below
 $\Delta z^+ = 1$ and (ii) there are at least ten grid points within
 $z^+ = 10$. Here, we have 18 (domain A) and 19 (domain B) grid points below
 $z^+ = 10$, so these conditions are amply fulfilled. Moreover, both the horizontal and vertical resolution are similar to previous DNS studies of stably stratified channel flow (García-Villalba & del Álamo Reference García-Villalba and del Álamo2011; He & Basu Reference He and Basu2015). Validation of our code against the stably stratified homogeneous channel flow of García-Villalba & del Álamo (Reference García-Villalba and del Álamo2011) at both Reynolds numbers is reported by Bon & Meyers (Reference Bon and Meyers2022). To guarantee that the present resolution is also adequate for DNS with two-dimensional heterogeneous temperature boundary conditions, Appendix A presents a grid sensitivity study with layout X4Y0.5 at
 $Re_\tau =180$. It was found that doubling the horizontal or vertical resolution does not significantly alter first- and second-order statistics, indicating that the used grid is indeed sufficient. In each case, the flow was allowed to develop from the initial field until a statistically steady state was reached after approximately 60 non-dimensional time units (
 $tu_\tau /h = 60$). After this spin-up phase, statistics were collected over a period as listed in the last column of table 2. Hence, unless explicitly stated otherwise, all variables shown in this paper are time-averaged, indicated by an overline (e.g
 $\bar {\phi }$). All simulations are initialized from either a laminar flow profile with random perturbations or the fully developed velocity field of the corresponding homogeneous simulation to speed up the spin-up phase. We verified that the initial condition does not affect the fully developed state.
3. Results and discussion
3.1. Secondary flow structures
Before presenting the effect of the surface heterogeneity on global flow parameters, we examine the spatial development of the secondary flows in the low-Reynolds-number cases with  $(\lambda _x, \lambda _y) = (8{\rm \pi}, {\rm \pi}/4)$ and
 $(\lambda _x, \lambda _y) = (8{\rm \pi}, {\rm \pi}/2)$ to get an idea of what the flow structure in general looks like. As usual in studies concerning secondary flow, we use the mean-signed swirling strength,
 $\bar {\varLambda }_{ci} = \bar {\lambda }_{ci} \bar {\omega }_x/|\bar {\omega }_x|$, to visualize the streamwise roll motions. Here,
 $\bar {\lambda }_{ci}$ is calculated as the imaginary part of the complex eigenvalue of the local (time-averaged) velocity gradient tensor on the
 $yz$-plane (Zhou et al. Reference Zhou, Adrian, Balachandar and Kendall1999; Anderson et al. Reference Anderson, Barros, Christensen and Awasthi2015). The sign of the vorticity is used to indicate direction of the rotation. Signed swirling strength is generally recognized to be a more satisfactory way of identifying swirling motions than the vorticity itself, as the latter cannot distinguish between genuine vortex motions and regions of strong shear (Castro et al. Reference Castro, Kim, Stroh and Lim2021).
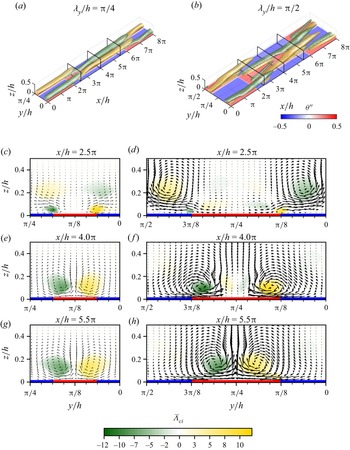
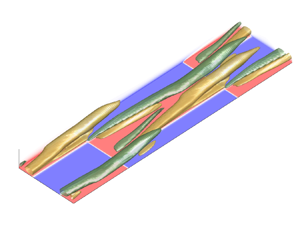
Isocontours of time- and phase-averaged mean signed swirling strength of layout X8Y0.25 are depicted in figure 2(a), with contour levels at 10 % of the maximum and minimum values. Note that the original domain is 16 times larger in the  $y-$direction, but phase-averaging was applied. We observe two longitudinal roll structures that emerge from the streamwise transition at
 $x/h=2{\rm \pi}$. The streamwise development of the secondary motions can be appreciated more clearly in the
 $yz$-planes in figure 2(c,e,g), depicting contour plots of signed swirling strength with vectors of spanwise and vertical velocity. The streamwise locations where the planes are taken,
 $x/h \in \{2.5{\rm \pi}, 4{\rm \pi}, 5.5{\rm \pi} \}$, are also illustrated in figure 2(a). Figure 2(c) clarifies that the two vortices are formed right above the spanwise temperature step, and their extent grows as the flow travels downstream. In the last two planes (figure 2e,g), the size and strength of the swirling motions is nearly equal, indicating that the secondary flow could be considered to be fully developed. Behind the streamwise transition at
 $x/h=6{\rm \pi}$, the roll structures move upward and eventually fade out. This is also visible in figure 2(c), where the two upper vortices are a remainder of the secondary flows that have developed over the upstream section (
 $x/h < 2{\rm \pi}$).
(a,c,e,g) Layout X8Y0.25, (b,d, f,h) layout X8Y0.5. (a,b) Time- and phase-averaged isosurfaces of signed swirling strength  $\bar {\varLambda }_{ci}$. Contour levels are 10 % of the maximum and minimum values, while colours indicate positive (yellow) and negative (green) values. Bottom and side planes indicate potential temperature reduced with its horizontal average (
 $\bar {\theta }''=\bar {\theta } - \langle \bar {\theta }\rangle$). (c–h) Time- and phase-averaged
 $yz$-planes of signed swirling strength, at
 $x=2.5{\rm \pi}, 4{\rm \pi}$ and
 $5.5{\rm \pi}$, as also indicated in (a,b). Vectors are constructed from mean spanwise and vertical velocity. Red and blue lines at the bottom correspond to high and low surface temperature. Note that the spanwise axes are reversed to have them aligned with the 3-D plots in (a,b). The aspect ratio in all plots is 4:1:1.

Figure 2(b,d, f,h) present the same variables, but for layout X8Y0.5. Compared with layout X8Y0.25, only the width of the hot and cold patches is doubled. In this scenario as well, two counterrotating vortices arise just above the spanwise temperature transitions, and they develop downstream to become the main secondary flow. Above the centre of the hot patch however, a weaker vortex pair forms, rotating in opposite direction to the adjacent main secondary motions (see figure 2d, f). Such tertiary flows have also been reported in flows over spanwise varying surface stress (Stroh et al. Reference Stroh, Hasegawa, Kriegseis and Frohnapfel2016) and longitudinal ridges (Hwang & Lee Reference Hwang and Lee2018; Castro et al. Reference Castro, Kim, Stroh and Lim2021). We remark that in the present case, this may be more counter-intuitive as we observe downward motion above a high-temperature patch, where the buoyancy force is upward. As the flow travels downstream, the extent of the strongest vortices grows until the tertiary vortices have disappeared near the end of the patch (figure 2h) and the two main vortices dominate the flow.
Comparing the left and right columns in figure 2 reveals that the main difference between the two cases with layouts X8Y0.25 and X8Y0.5 are the tertiary flows that develop above the wider patch. In addition to that, the magnitude of the swirling strength and the vectors are larger for the case with  $\lambda _y/h = {\rm \pi}/2$. Finally, the secondary motions in the case with
 $\lambda _y/h={\rm \pi} /4$ seem to reach a fully developed state, where there only are minimal changes in the streamwise direction from approximately
 $2{\rm \pi} h$ downstream of the transition. In contrast, the last two contours in the case with
 $\lambda _y/h={\rm \pi} /2$ (figure 2 f,h) are less similar, illustrating that the secondary motions are still changing in the streamwise direction.
To investigate the strength and streamwise development of the secondary motions in a more quantitative way for all simulations, we consider two measures that are commonly used to describe the intensity of the secondary circulations. The first is based on the magnitude of the cross-stream velocity components  $\psi = (\bar {v}^2 + \bar {w}^2)^{1/2}$, whereas the second involves the streamwise vorticity
 $\omega _x = \partial \bar {w}/\partial y - \partial \bar {v}/\partial z$. Both are calculated from the time- and phase-averaged
 $v$ and
 $w$ fields. The three-dimensional
 $\psi$ and
 $\omega _x$ arrays are then consecutively squared and averaged over the spanwise and vertical directions, defining
 \begin{equation} \varOmega_x(x) = \frac{1}{A}\int_0^{2h} \int_0^{\lambda_y} \omega_x^2 \,\text{d}y\,\text{d}z \quad \text{and} \quad \varPsi(x) = \frac{1}{A}\int_0^{2h} \int_0^{\lambda_y} 0.5\psi^2 \,\text{d}y\,\text{d}z, \end{equation}
where  $A = 2h\lambda _y$ is the area of the cross-stream plane. The former is the specific mean streamwise enstrophy, which can be interpreted as a measure of the rotational energy contained in the secondary motions (Stroh et al. Reference Stroh, Schäfer, Frohnapfel and Forooghi2020b). Likewise, the latter is related to the volume-averaged kinetic energy contained in the cross-stream velocity (Schäfer et al. Reference Schäfer, Frohnapfel and Mellado2022; Zampino et al. Reference Zampino, Lasagna and Ganapathisubramani2022). To enable comparison of the secondary motions in the 2-D heterogeneous cases to the equivalent streamwise homogeneous cases, we normalize
 $\varOmega _x$ and
 $\varPsi$ first by the bulk velocity
 $u_b = (1/2h) \int _{0}^{2h} \langle \bar {u} \rangle {\textrm d}z$ and finally by the average value from the corresponding streamwise homogeneous simulation, denoted by subscript Xh.
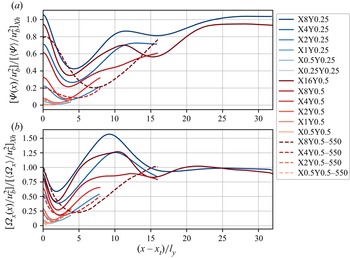
The ratios of normalized mean cross-stream velocity and enstrophy that are then obtained are displayed in figure 3. To generalize the length along the streamwise direction, we subtract the location of the streamwise transition ( $x_t$) and normalize by the spanwise width of the temperature patches, i.e.
 $(x-x_t)/l_y$. Since the development over only one patch length is shown (
 $0 < x-x_t < l_x=\lambda _x/2$), the total length of the lines in figure 3 corresponds to the aspect ratio
 $a = l_x/l_y = \lambda _x/\lambda _y$ of the rectangular temperature patches. With this normalization, we observe some similarity for cases with the same aspect ratio, if
 $a \ge 8$. In particular, the two cases with the largest aspect ratio (darkest red and blue lines) converge to a value of
 $[\varOmega _x(x)/u_b^2]/[\langle \varOmega _x\rangle /u_b^2]_{Xh} \approx [\varPsi (x)/u_b^2]/[\langle \varPsi \rangle /u_b^2]_{Xh} \approx 1$ for
 $x-x_t \gtrsim 25 l_y$, suggesting that the secondary motions need approximately 25 times the spanwise width to reach the same strength as they would have if the patches were infinitely long. Directly downstream of the streamwise transition, the total strength of the secondary motions decreases as the ‘new’ secondary motions are forming and the secondary motions formed above the downstream patch are diminishing. Remarkably, the locations of the local minimum in
 $\varPsi$ (at
 $x-x_t \approx 4l_y$) and
 $\varOmega _x$ (at
 $x-x_t \approx 2l_y$) are very similar for all cases with
 $Re_\tau =180$ and
 $a \ge 8$. Downstream of this minimum, the secondary motion strength increases further and the enstrophy even exceeds the streamwise homogeneous value with a peak around
 $x-x_t \approx 10l_y$. We hypothesize that this large enstrophy may be due to strong shear near the surface, where
 $\partial v/\partial z \gg \partial w/\partial y$, rather than that the secondary motions are actually stronger. In the cross-stream velocity ratio, this local maximum at
 $x-x_t = 10l_y$ does not exceed unity.
Ratio of (a) integrated cross-stream velocity  $\varPsi$ and (b) vorticity
 $\varOmega _x$ with respect to the equivalent streamwise homogeneous case. The
 $x$-axis starts at the location of a streamwise transition
 $x_t$ and is scaled with patch width
 $l_y$. Only one patch is shown, such that the length of the lines corresponds to the patch aspect ratio
 $a$. Blue lines indicate surface layouts with
 $\lambda _y/h = {\rm \pi}/4$, red lines
 $\lambda _y/h = {\rm \pi}/2$ and dashed lines represent cases with
 $Re_\tau =550$. Darker lines illustrate longer patches (larger
 $\lambda _x/h$).

The findings in figure 3 suggest that for relatively long strips ( $a \ge 8$), the streamwise development of the secondary motions is governed by the patch aspect ratio rather than the patch length. An intuitive explanation would be that the initial spanwise separation between the secondary motions, as they start to develop close to the surface, is larger if
 $\lambda _y/h$ is larger (cf. figure 2c,d). Consequently, the two main counterrotating vortices require more distance to reach each other above the centre of the patch, where they eventually reinforce each other. Furthermore, as discussed in the previous section, the tertiary vortices arising between the two ‘main’ circulations for the cases with wider patches may prevent them from merging faster. However, we emphasize that a wider range of patch widths should be considered to draw a more general conclusion.
The cases with  $Re_\tau = 550$, indicated by dashed lines in figure 3, show qualitatively similar behaviour to the cases with lower Reynolds number. In the simulation with layout X8Y0.5, the streamwise enstrophy reaches the same magnitude as the streamwise homogeneous case, while the maximum
 $\varPsi$ is approximately 80 %. The location of the minimum
 $\varPsi$ and
 $\varOmega _x$ is shifted further downstream compared with the cases with
 $Re_\tau = 180$. Both observations imply that at higher Reynolds number, the secondary flows diminish and grow over a larger distance but at a smaller rate.
Lastly, it is clear that the secondary flows are much less significant in the channels with shorter patches ( $a \lesssim 4$ or
 $\lambda _x/h \lesssim {\rm \pi}$), since the averaged cross-stream velocity and enstrophy are smaller than
 ${\sim }10$% of the streamwise homogeneous value.
3.2. Global flow properties
In this subsection, we will analyse the effect of heterogeneous surface temperature and the induced secondary motions on domain-averaged flow characteristics, which are also reported in table 1. The bulk Reynolds and Richardson numbers there are defined as  $Re_b = u_b h/\nu$ and
 $Ri_b = gh\beta \Delta _z\theta /(2 u_b^2)$, allowing comparison to studies with fixed flow rate
 $u_b$. In addition, the stability parameter
 $h/L_{O}$, which is often used in the ABL community to characterize stability of the surface layer, is also presented. The Obukhov length given by
 \begin{equation} L_O = \frac{u_\tau^3}{\kappa g\beta \alpha \left(\dfrac{\partial \langle \bar{\theta}\rangle}{\partial z} \right)_w} \end{equation}
can be interpreted as the height at which the buoyancy flux is of the same order as the turbulent energy production (Nieuwstadt Reference Nieuwstadt2005; Flores & Riley Reference Flores and Riley2011). In the definition above,  $\kappa \approx 0.4$ is the Von Kármán constant and
 $(\partial \langle \bar {\theta }\rangle /\partial z)_w$ is the temperature gradient averaged over the bottom and top wall. The Obukhov length also plays a central role as a scaling parameter in MOST, which will be discussed in § 3.4. According to Nieuwstadt (Reference Nieuwstadt2005), flows with
 $h/L_O \gtrsim 0.51$ exhibit intermittent or fully collapsed turbulence and therefore belong to the strongly stably stratified regime (van Hooijdonk et al. Reference van Hooijdonk, Moene, Scheffer, Clercx and van de Wiel2017). Later studies suggest the Obukhov–Reynolds number as a parameter that governs the transition from weak to strong stratification, with
 $Re_L = Re_\tau L_O/h \approx 200$ as a critical value (Flores & Riley Reference Flores and Riley2011; Deusebio et al. Reference Deusebio, Brethouwer, Schlatter and Lindborg2014; Zhou, Taylor & Caulfield Reference Zhou, Taylor and Caulfield2017). In both classifications, all of the present cases fall well within the weakly stable regime (see table 1), implying that turbulence is continuous in our simulations and we do not need to consider effects of intermittency.
The skin friction coefficient and Nusselt number, defined as
 \begin{equation} C_f=2\frac{u_\tau^2}{u_b^2}, \quad \textit{Nu} = \frac{2h}{\Delta_z \theta} \left(\frac{\partial \langle \bar{\theta}\rangle}{\partial z} \right)_w, \end{equation}
are commonly used to quantify momentum and heat transfer in stably stratified channel flows (García-Villalba & del Álamo Reference García-Villalba and del Álamo2011; Zonta & Soldati Reference Zonta and Soldati2018; Bon & Meyers Reference Bon and Meyers2022), and will now be considered to investigate the effect of the varying surface temperature configuration in our simulations. It may be useful here to realize that the stability parameter  $h/L_O$ and Nu are directly related by external parameters since
 $h/L_O = (\kappa /2) Ri_\tau \textit {Nu} (Pr Re_\tau )^{-1}$. Figure 4(a,b) presents
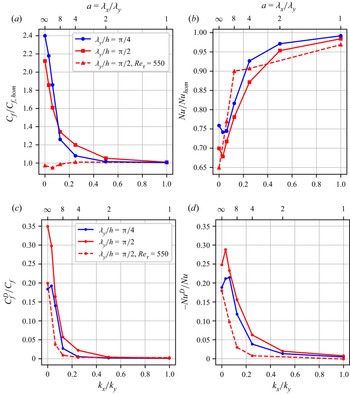
 $C_f$ and Nu, normalized by the value from the fully homogeneous simulation, as a function of the (inverse) aspect ratio of the temperature patches. Focusing on the cases with
 $Re_\tau =180$ (full lines), it is clear from figure 4(a) that friction is significantly increased for infinitely long patches (
 $k_x/k_y=0$), as reported by Bon & Meyers (Reference Bon and Meyers2022). When the patch aspect ratio and thus the patch length is reduced (i.e.
 $k_x/k_y$ is increased), the skin friction coefficient drops substantially. For
 $a=2$,
 $C_f$ is within 5 % of the homogeneous value. In the higher-Reynolds-number cases (dashed lines), the impact of the heterogeneous surface on the friction coefficient is much smaller and
 $C_f/C_{f,{hom}}$ drops below 1. This small drag reduction due to the thermal heterogeneous surface was already reported by Bon & Meyers (Reference Bon and Meyers2022) for the
 $k_x=0$ case, where it was attributed to a decrease in turbulent shear stress. Here, we find that the drag reduction is slightly enhanced for finite-length strips, i.e. the X8Y0.5 layout shows a 5 % decrease with respect to the homogeneous case. Although a deeper analysis of the physical mechanism behind the observed drag reduction is beyond the scope of the present work, we note that Hickey et al. (Reference Hickey, Younes, Yao, Fan and Mouallem2020) demonstrated as well that localized heating by streamwise-aligned heating strips can lead to modest drag reduction in an unstratified, low-Mach-number channel flow with similar
 $Re_\tau$.
(a) Skin friction coefficient  $C_f$ and (b) Nusselt number Nu as a function of surface wavenumber ratio
 $k_x/k_y$, normalized by the value from the corresponding homogeneous simulations. (c) Dispersive contributions to skin friction coefficient and (d) Nusselt number, relative to the total value.

In figure 4(b), we observe that heat transfer is reduced in channels with infinitely long spanwise heterogeneity and, for the longest finite-length patches, this reduction is just larger. As the temperature patches become shorter ( $k_x/k_y$ increases), the Nusselt number increases and at
 $a= 2$, it is within 2 % of the homogeneous value. A very similar trend is followed by the cases with higher Reynolds number.
To assess the effect of the secondary motions on these patterns, we follow Bon & Meyers (Reference Bon and Meyers2022), by applying a triple decomposition to split  $C_f$ and Nu into a laminar, turbulent and dispersive contribution. Triple decomposition is widely used to assess flows with spatial heterogeneities (e.g. Raupach & Shaw Reference Raupach and Shaw1982; Nikora et al. Reference Nikora, McEwan, McLean, Coleman, Pokrajac and Walters2007; Li & Bou-Zeid Reference Li and Bou-Zeid2019), and is obtained from averaging a variable in space and time. Hence, we split a variable into three components:
 \begin{equation} \phi(x,y,z,t) = \langle \bar{\phi} \rangle(z) + \bar{\phi}''(x,y,z) + \phi'(x,y,z,t), \end{equation}
where it is important to emphasize that  $\bar {\phi }''(x,y,z) = \bar {\phi }(x,y,z) - \langle \bar {\phi } \rangle (z)$ represents the time-averaged local deviation from the mean profile and is typically referred to as the dispersive or coherent fluctuation. Further,
 $\langle \bar {\phi } \rangle$ is the horizontal and time average, while
 $\phi '$ represents the random or turbulent fluctuation. When this time–space averaging procedure is applied to the convective terms of the governing equations, dispersive fluxes
 $\langle \bar {u}_i'' \bar {u}_j''\rangle (z)$ and
 $\langle \bar {w}'' \bar {\theta }''\rangle (z)$ arise (see (B1) and (B2)). Physically, these terms result from the transport by the mean (time-averaged) coherent flow structures (Li & Bou-Zeid Reference Li and Bou-Zeid2019), such as the persistent mean secondary circulations induced by spanwise surface heterogeneity.
By means of vertical integration and a specific normalization, the contribution of the dispersive fluxes to the friction coefficient is then given by
 \begin{equation} C_f^D ={-} \frac{6}{u_b^2h} \int_{0}^{h}\left(1 - \frac{z}{h} \right) \langle \bar{u}''\bar{w}'' \rangle {\textrm d}z. \end{equation}
We refer to Stroh et al. (Reference Stroh, Schäfer, Forooghi and Frohnapfel2020a) for a derivation of the full decomposition of  $C_f$ in a laminar, turbulent and dispersive part, which is also applied by Bon & Meyers (Reference Bon and Meyers2022). Similarly, the dispersive contribution to the Nusselt number is (Fukagata, Iwamoto & Kasagi Reference Fukagata, Iwamoto and Kasagi2005; Bon & Meyers Reference Bon and Meyers2022)
 \begin{equation} \textit{Nu}^D ={-} \frac{2}{\alpha \Delta^z\theta} \int_{0}^{h} \langle \bar{w}''\bar{\theta}''\rangle {\textrm d}z. \end{equation}
The ratio of the dispersive contribution to the total  $C_f$ and Nu are displayed in figure 4(c,d). This shows that the dispersive momentum transfer contributes 20 to 35 % to the total friction for very long strips, and decreases to 5 % or less for
 $a \le 8$ (or
 $k_x/k_y \ge 0.125$). The dispersive component of the Nusselt number shows a rather similar trend, except that its sign is negative, which will be discussed further in the next section (see also Bon & Meyers Reference Bon and Meyers2022). At higher Reynolds number (dashed lines), the contribution of the dispersive fluxes is smaller and drops faster as
 $a$ increases. In general, we can conclude that the effect of the heterogeneity-induced mean secondary flows on the vertical momentum and heat transfer is significant, but it is strongly reduced as the patch aspect ratio reduces. To allow direct comparison of the strength of the thermally induced streamwise secondary motions in the present study to the cases with roughness-induced secondary flows of Schäfer et al. (Reference Schäfer, Frohnapfel and Mellado2022), the volume-averaged coherent (or dispersive) kinetic energy of the cross-sectional velocity components,
 $K''_c = 0.5\langle \bar {v}''\bar {v}'' + \bar {w}''\bar {w}'' \rangle _{xyz}$, is reported in the last column of table 1. Since the cross-sectional global mean velocity components
 $\langle \bar {v} \rangle$ and
 $\langle \bar {w}\rangle$ are zero, this quantity is simply the streamwise average of
 $\varPsi (x)$ as defined in (3.1a,b) and shown in figure 3. The values of
 $K_c''/u_\tau ^2$ for the cases with the longest strips are of the order of
 $10^{-2}$, which agrees very well with the range of 0.01–0.07 in figure 12(a) of Schäfer et al. (Reference Schäfer, Frohnapfel and Mellado2022), indicating that the strength of the thermally induced secondary motions here is similar to the secondary flows that are generated by streamwise-aligned Gaussian ridges under neutral or weakly unstable stratification in their study. We note however that a direct comparison of the two generation mechanisms may not be fair, since the magnitude of the induced secondary motions depends on many different factors. Although the Reynolds number and spanwise heterogeneity length scale are similar in both studies, a comparison of the ‘amplitude’ of the heterogeneity (i.e. the differences in roughness, temperature or heat flux at the surface) would obviously be ambiguous.
3.3. Variance and covariance distributions
The signs of the dispersive contributions to  $C_f$ and Nu in the previous section reveal that there is a negative spatial correlation between
 $\bar {u}''$ and
 $\bar {w}''$, and a positive spatial correlation between
 $\bar {w}''$ and
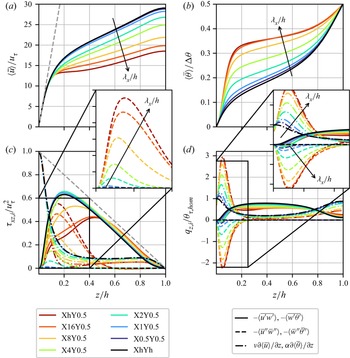
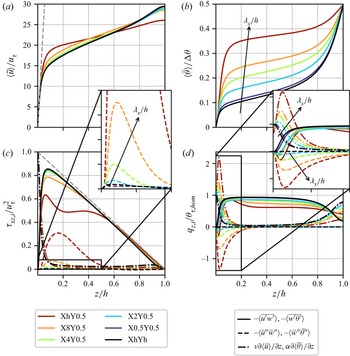
 $\bar {\theta }''$. To examine this further, we investigate the horizontal distribution of these three components along with the viscous, turbulent and dispersive components of the vertical heat and momentum fluxes (see (B1) and (B2)). Note that mean profiles of these fluxes are presented in Appendix B.1 for completeness.
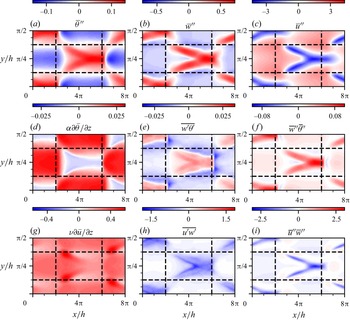
Figure 5 displays phase- and time-averaged  $xy$-planes at
 $z/h = 0.1$ for layout X8Y0.5, where the black dashed lines indicate the location of the temperature transitions at the underlying bottom surface. At this approximate height, the dispersive fluxes are maximal for this case, as shown in figure 11 of Appendix B.1. The temperature distribution in figure 5(a) shows that the central patch is warmer than average, but the pattern at
 $z/h = 0.1$ is slightly shifted downstream compared with the surface temperature. In accordance with figure 2, we see two ‘legs’ of upward motions (
 $\bar {w}'' > 0$) in figure 5(b), which merge further downstream above the centre of the high-temperature patch (
 $\bar {\theta }'' > 0$). Consequently, the dispersive heat transfer, which is the product of these two terms as displayed in figure 5( f), is mostly positive. Moreover, figure 5(g) shows a negative temperature gradient above the high-temperature patch, implying there is an unstably stratified region in the flow where vertical motions are not damped. This explains the enhanced vertical turbulent and dispersive transport of both heat and momentum in that region in figure 5(e, f,h,i). Moreover, the turbulent heat transfer in this convective region is positive, while it is negative in the stably stratified zones above the low-temperature areas. As such, we find that both the turbulent and dispersive heat transfer above the high-temperature patches are opposite to the mean gradient, but not against the local one.
Horizontal phase- and time-averaged planes at  $z/h = 0.1$ for layout X8Y0.5 with
 $Re_\tau = 180$. Black dashed lines indicate boundaries of underlying temperature patches. (a) Spatial fluctuations of potential temperature, (b) vertical and (c) streamwise velocity. (d,e,f) Laminar, turbulent and dispersive heat flux. (g,h,i) Laminar, turbulent and dispersive momentum flux.

Regarding the streamwise velocity distribution, figure 5(c) reveals that the streamwise velocity is significantly reduced in the convective region above the hot temperature patch, since  $\bar {u}''= \bar {u}(x,y) - \langle \bar {u}\rangle < 0$. Here, low-momentum fluid from near the bottom is brought upward by the vertical motions. In the regions where the temperature is below average, downdrafts bring high-momentum fluid from above downward, resulting in an increased streamwise velocity in these regions. These alternating high and low momentum pathways (HMPs and LMPs) are commonly found in studies with secondary motions induced by spanwise heterogeneity (e.g. Barros & Christensen Reference Barros and Christensen2014; Salesky et al. Reference Salesky, Calaf and Anderson2022). The correlation between streamwise and vertical velocity deviations is emphasized in figure 5(i), which shows that the magnitude of the dispersive momentum flux
 $\langle \bar {u}''\bar {w}''\rangle$ is maximal in the centre between the counter-rotating vortices. Furthermore, figures 5(g) and 5(h) show that the strongest laminar and turbulent momentum fluxes also occur in the unstably stratified areas above the high-temperature patches.
In summary, we conclude from figure 5 that the convective regions above the high-temperature patches play a crucial role in the vertical transport of heat and momentum. In these zones, all heat transfer components are in the opposite direction with respect to the stable regions, explaining the reduction in overall heat transfer (i.e. Nu) due to the temperature heterogeneity that we found in the preceding section. Moreover, the rise in friction coefficient induced by the inhomogeneous surface can be related to the increased magnitude of both turbulent and dispersive momentum transfer in the unstably stratified sections.
Lastly, we study the effect of the thermal heterogeneity on the variances of streamwise velocity and temperature. Analogous to the vertical fluxes, the variances (or normal stresses in the case of velocity components) can also be decomposed into a turbulent and dispersive part, denoted respectively by  $\langle \overline {\phi '\phi '}\rangle$ and
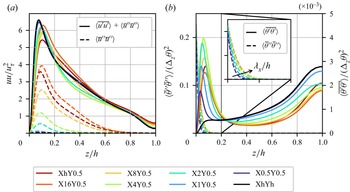
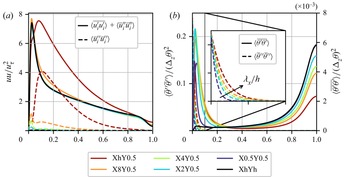
 $\langle \bar {\phi }''\bar {\phi }''\rangle$. The latter provides information on the penetration depth of the heterogeneity, also referred to as the blending height. This is the height above which the flow is homogeneous (Bou-Zeid, Meneveau & Parlange Reference Bou-Zeid, Meneveau and Parlange2004) and therefore the dispersive normal stresses are zero. Figure 6(a) shows mean profiles of the total (turbulent
 $+$ dispersive) normal stress (full lines) and the dispersive contribution (dashed lines) for the cases with
 $Re_\tau =180$ and
 $\lambda _y/h = {\rm \pi}/2$. The significant streamwise dispersive stress reveals that the streamwise velocity is highly heterogeneous, which is strongly associated with the formation of HMPs and LMPs as explained above and shown in figure 5(c). The fact that the dispersive stresses and fluxes are negligible in the channel core confirms that the channel centre is homogeneous in all cases. Interestingly, we observe that the total variance,
 $\langle \overline {u'u'}\rangle + \langle \bar {u}''\bar {u}''\rangle$ (full lines), remains approximately equal among all cases, suggesting that dispersive and turbulent variance act like communicating vessels. Furthermore, this implies that the turbulent stress is reduced in the cases where the dispersive stress is large (not shown). The reduction of turbulent stresses in the presence of secondary flows was shown previously by Medjnoun, Vanderwel & Ganapathisubramani (Reference Medjnoun, Vanderwel and Ganapathisubramani2020) and Stroh et al. (Reference Stroh, Schäfer, Forooghi and Frohnapfel2020a) in neutral flow conditions, and can possibly be explained by the fact that there is more temporal coherence in the flow due to the spatially fixed surface heterogeneity.
Horizontally averaged profiles of (a) streamwise normal stresses and (b) temperature variances, for cases with  $Re_\tau =180$ and
 $\lambda _y/h = {\rm \pi}/2$. The full lines in (a) represent the total velocity stress (dispersive
 $+$ turbulent), while in (b), full lines denote only the turbulent fluctuations. Dashed lines show dispersive variances. In (b), the left ordinate belongs to dispersive component (dashes) and the right ordinate to turbulent component (full lines). Inset in (b) shows zoom of dispersive temperature variance, where the arrow indicates the direction of increasing temperature patch length.

The temperature variances in figure 6(b) expose that the dispersive temperature fluctuation (dashed lines, left ordinate) in the near-wall region is nearly two orders of magnitude larger than the turbulent variance (full lines, right ordinate), but decreases sharply away from the wall. In fact, the value of  $\langle \bar {\theta }'' \bar {\theta }''\rangle$ at the surface is directly determined by the heterogeneous boundary conditions (figure 1) and is therefore equal for all cases. The inset in figure 6(b) shows that the dispersive temperature variance decays faster for smaller
 $\lambda _x/h$, implying that horizontal temperature mixing is stronger in the presence of streamwise heterogeneity. This enhanced mixing is accompanied by larger turbulent temperature fluctuations, as evidenced by the observation that the peak in turbulent temperature variance (full lines) close to the wall is higher for most layouts with small
 $\lambda _x/h$, while there is no near-wall peak in the homogeneous case (black line). The conclusion that heterogeneous temperature boundary conditions enhance temperature variance close to the surface was already made by Mironov & Sullivan (Reference Mironov and Sullivan2016, Reference Mironov and Sullivan2023) in their respective LES and DNS studies with streamwise varying surface temperature, although they did not distinguish between dispersive and turbulent components (see § 3.5). The dispersive variance is negligible for
 $z/h \gtrsim 0.15$, indicating that the blending height for temperature is significantly lower than that for streamwise momentum.
3.4. Monin–Obukhov similarity and outer layer scaling
The preceding sections demonstrate that surface temperature heterogeneity can have significant impact on the flow, penetrating deeply into the outer layer. In this section, we evaluate two existing methods to scale mean velocity and temperature profiles in the outer layer, and see to what extent they can be applied in these heterogeneous channel flows.
To this end, we first use the local Monin–Obukov similarity theory (MOST), which is widely used to interpret ABL data. Previous DNS studies have shown that homogeneous stable channel flow at sufficiently high Reynolds number agrees reasonably well with (local) Monin–Obukhov scaling (García-Villalba & del Álamo Reference García-Villalba and del Álamo2011; He Reference He2016; He & Basu Reference He and Basu2016). We note that at low Reynolds numbers, the intermediate layer where MOST is valid, between the viscous sublayer and the internal-wave-dominated channel centre, is not present (García-Villalba & del Álamo Reference García-Villalba and del Álamo2011; Shah & Bou-Zeid Reference Shah and Bou-Zeid2014). The original MOST assumes that all fluxes are constant with height, and employs the Obukhov length as defined in (3.2) based on surface momentum and temperature fluxes. In the current stable channel flows, the fluxes are not constant (figures 11 and 12c,d). Therefore, the dynamics in the outer region is governed by a local scaling based on a local Obukhov length (Nieuwstadt Reference Nieuwstadt1984):
 \begin{equation} \varLambda(z) = \frac{u_*(z)^3}{\kappa g\beta q_z}, \end{equation}
with  $u_*(z) = (\tau _{xz})^{1/2}$ as in (B1) and
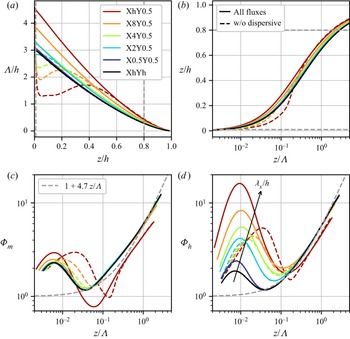
 $q_z$ as in (B2). Note that with this definition, the laminar and dispersive fluxes are also explicitly included in the framework, while the original MOST is based on homogeneous flow at infinite Reynolds number and therefore only includes the turbulent fluxes (Shah & Bou-Zeid Reference Shah and Bou-Zeid2014). Nevertheless, recent DNS studies involving heterogeneous surfaces have also incorporated laminar and (implicit) dispersive fluxes in their comparisons to MOST (Lee, Gohari & Sarkar Reference Lee, Gohari and Sarkar2020; Mironov & Sullivan Reference Mironov and Sullivan2023). Figure 7(a) shows profiles of the local Obukhov length scale for the present simulations with
 $Re_\tau =550$. Given that
 $u_*(0) = u_\tau$ and
 $q_z$ is constant through the channel (see Appendix B.2),
 $\varLambda (0)$ corresponds to the Obukhov length
 $L_O$ as reported in table 1. The local Obukov length is maximal for layout XhY0.5, and decreases with streamwise wavelength and wall distance. The dashed lines in figure 7(a) indicate
 $\varLambda (z)$ without inclusion of the dispersive fluxes. These are significantly smaller for the cases with the longest temperature patches, where the secondary flows are most significant.
(a) Local Obukhov length as a function of wall distance. (b) Mapping of stability parameter  $z/\varLambda$ onto wall distance
 $z/h$. Similarity functions for (c) momentum and (d) heat. Coloured dashed lines indicate calculations without dispersive fluxes. Grey dashed lines in (a,b) represent limits for
 $z/h$ that have been used for data in (c,d). Light dashed lines in (c,d) depict empirical linear relation
 $1+4.7z/\varLambda$.

Within the MOST framework, the similarity functions for the non-dimensional shear  $\varPhi _m$ and temperature gradient
 $\varPhi _h$ are
 $$\begin{gather} \varPhi_m\left(\frac{z}{\varLambda}\right) = \frac{\kappa z}{u_*(z)}\frac{\partial \langle \bar{u}\rangle}{\partial z} \approx 1+\beta_m \frac{z}{\varLambda(z)}, \end{gather}$$
 $$\begin{gather}\varPhi_h\left(\frac{z}{\varLambda}\right) = \frac{\kappa z}{\theta_*(z)}\frac{\partial \langle \bar{\theta}\rangle}{\partial z} \approx \alpha_h+\beta_h \frac{z}{\varLambda(z)}, \end{gather}$$
where the local friction temperature  $\theta _*(z) = q_z/u_*(z)$. Although MOST does not specifically predict the shape of these functions, it has been established empirically that under stable conditions, both are linear in
 $z/\varLambda$ as indicated by the right-hand side of (3.8). While the exact values of the linear coefficients differ across different publications, we use typical values of
 $\alpha _h = 1$ and
 $\beta _m = \beta _h = 4.7$ (Stull Reference Stull1988; Hogstrom Reference Hogstrom1996; He Reference He2016).
Figures 7(c) and 7(d) depict the stability functions  $\varPhi _m$ and
 $\varPhi _h$ for all cases at
 $Re_\tau = 550$. To avoid the impact of molecular viscosity at the bottom and internal waves in the channel centre, we only consider data from
 $0.01 < z/h < 0.8$ (
 $5 < z^+ < 440$), as indicated by the grey dashed lines in figure 7(a,b).
First, we find that the profiles from the homogeneous channel (black lines) agree reasonably well with the proposed linear relation for  $z/\varLambda \gtrsim 0.05$, justifying the comparison of our DNS data at moderate Reynolds number to MOST. Note that we can use the mapping provided in figure 7(b) to determine that
 $z/\varLambda = 0.05$ corresponds to
 $z/h \approx 0.1$. The scaled velocity gradient profiles of all heterogeneous cases with finite length show excellent collapse; however, this outcome may be rather unsurprising since the velocity profiles are already highly similar before any scaling is applied (see Appendix B.2, figure 12a). The collapse of
 $\varPhi _h$ profiles on the other hand depends clearly on the surface layout, while for
 $z/\varLambda \gtrsim 0.35$ (
 $z/h \gtrsim 0.45$), all layouts with finite-length temperature patches are similar. For layout XhY0.5, where the temperature strips are infinitely long, the velocity and temperature gradient profiles in the outer layer have a comparable slope but are shifted downwards.
To assess the influence of dispersive fluxes in the present MOST framework, we also calculated the scaling functions and local Obukhov length without taking the dispersive fluxes into account. Resulting profiles are depicted by the dashed lines in figure 7. The differences between the dashed and full lines are most evident for layouts with long temperature strips in the region where dispersive fluxes are non-negligible (cf. figure 12c,d). We find that when dispersive fluxes are ignored, the near-wall peak in the scaling functions moves further away from the wall (towards larger values of  $z/\varLambda$) and the height of the peak in
 $\varPhi _h$ decreases. However, if the dispersive fluxes are not neglected, the location of the peak (in terms of
 $z/\varLambda$) remains relatively unchanged, but the height of the peak increases as the temperature patch length increases. The near-wall peaks in
 $\varPhi _m$ and
 $\varPhi _h$ are directly related to the high values of the velocity and temperature gradients there (see figures 11 or 12c,d), except that the scaling prefactors are different. The substantial reduction of peak heights in the
 $\varPhi _h$ curves when ignoring the dispersive stresses can be understood by reexamining (B1) and (B2) and again figures 11 or 12(c,d). As the dispersive shear stress is positive, neglecting it results in an underestimation of momentum flux (
 $u_*(z)$). Disregarding the (negative) contribution of the dispersive heat flux leads to an overestimation of
 $q_z$. Therefore, the scaling factor
 $1/\theta _*(z) = u_*(z)/q_z$ becomes smaller when the dispersive fluxes are not taken into account.
Finally, we present a different way of scaling the outer layer, by means of a velocity or temperature deficit. In the present channel flow set-up, this is defined as the difference between the local quantity and the centreline value (indicated with subscript  $c$). Such defect laws are typically of the form
 \begin{equation} \frac{U_c - u(z/h)}{U_s} = f_m\left(\frac{z}{h}\right) \quad \text{and} \quad \frac{\theta_c - \theta(z/h)}{\theta_s} = f_h\left(\frac{z}{h}\right), \end{equation}
where  $U_s$ and
 $\theta _s$ are scaling parameters. In the classical method, the inner velocity and temperature
 $u_\tau$ and
 $\theta _\tau$ are used (Pope Reference Pope2000). The velocity scaling in this form is also referred to as Townsend's similarity hypothesis. Medjnoun et al. (Reference Medjnoun, Rodriguez-Lopez, Ferreira, Griffiths, Meyers and Ganapathisubramani2021) already demonstrated that this scaling is violated as a consequence of large-scale secondary motions over a heterogeneously rough wall. The present results corroborate this finding, i.e. there is no collapse if defect profiles are scaled using
 $u_\tau$ and
 $\theta _\tau$ (not shown).
Alternatively, Zagarola & Smits (Reference Zagarola and Smits1998) propose to use  $U_s = U_c\delta ^*/\delta$ as an outer velocity scale, while Wang & Castillo (Reference Wang and Castillo2003) suggest to use a very similar scale for the temperature, namely
 $\theta _s = (\theta _w - \theta _c)\delta ^*_T/\delta _T$. Here, the so-called displacement thickness for momentum and temperature are given by
 \begin{equation} \delta^* = \int_{0}^{h}\left(1-\frac{u(z)}{U_c}\right){\textrm d}z \quad \text{and} \quad \delta^*_T = \int_{0}^{h}\frac{\theta(z) - \theta_c}{\theta_w - \theta_c}{\textrm d}z. \end{equation}
For  $\delta$ and
 $\delta _T$, referring to the (thermal) boundary layer thickness, we simply use the half-channel height
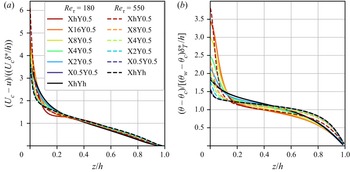
 $h$. The resulting scaled velocity and temperature deficit profiles for the homogeneous cases and all cases with
 $\lambda _y/h = {\rm \pi}/2$ are displayed in figure 8. The collapse of the velocity defect profiles is excellent for
 $z/h > 0.2$, even for different Reynolds numbers. For the temperature deficit in figure 8(b), the profiles from the simulations with
 $Re_\tau =550$ (dashed lines) appear to collapse better. However, given that these scaling relations were mainly intended to study developing forced convection turbulent boundary layers with and without a pressure gradient (Wang & Castillo Reference Wang and Castillo2003), the applicability to our thermally heterogeneous stably stratified channel flows may be remarkable.
(a) Scaled velocity deficit and (b) temperature deficit, with outer scaling parameters based on displacement thickness following Zagarola & Smits (Reference Zagarola and Smits1998) and Wang & Castillo (Reference Wang and Castillo2003). Simulations with  $Re_\tau =180$ (full lines) and
 $Re_\tau =550$ (dashed lines). Red indicates cases heterogeneous surface temperature and black lines are homogeneous simulations.

Nevertheless, we point out that while for classical defect scaling, only the surface values  $u_\tau$ and
 $\theta _\tau$ need to be measured, the calculation of the displacement thickness (3.10a,b) depends on knowledge of the entire profile. A similar argument holds for local MOST, where additional information on flux profiles is needed, as already discussed by Nieuwstadt (Reference Nieuwstadt1984).
3.5. Further discussion
In this final section, we discuss some general remarks about the present study and interpretation of its results.
First, it might be instructive to get an understanding of how relevant the used flow set-up is to real-world situations. To assess how realistic our input parameters are in an ABL context, we take some estimates from an LES study of a heterogeneous SBL by Stoll & Porté-Agel (Reference Stoll and Porté-Agel2009), which itself was based on the GABLS intercomparison study (Beare Reference Beare2006). The latter was designed for an intercomparison of LES models applied to a relatively simple yet realistic stable boundary layer. In the result of this study, the friction velocity  $u_\tau \approx 0.27$ m s
 $^{-1}$ and the reference potential temperature
 $\theta _0 = 265$ K (note that we use
 $\beta = 1/\theta _0$ here), we estimate the ABL height approximately to be 180 m, and the temperature difference between the surface and the ABL top to be approximately 2 K. Given our symmetric channel flow set-up, we can then roughly state that the half-channel height
 $h$ equals the ABL height, and the temperature difference
 $\Delta _z\theta$ over the full channel is twice the temperature difference between the ABL top and bottom. Using that, we find that
 $Ri_\tau = gh\Delta _z\theta /(\theta _0 u_\tau ^2) \approx 360$, which is at least the same order of magnitude as the
 $Ri_\tau = 120$ used in the present study. Given that the horizontal temperature difference at the surface in the present simulations is equal to the vertical temperature difference, this would also amount to
 $\Delta _{xy}\theta \approx 4$ K. This surface temperature difference is certainly possible, and consistent with previous numerical studies with heterogeneous surface temperatures (e.g. Stoll & Porté-Agel (Reference Stoll and Porté-Agel2009) and Mironov & Sullivan (Reference Mironov and Sullivan2016), see also the discussion of Mironov & Sullivan Reference Mironov and Sullivan2023). With
 $h \approx 180$ m, the present spanwise heterogeneity width
 $l_y = \lambda _y/2 = ({\rm \pi} /4 - {\rm \pi}/8 )h \approx 70\unicode{x2013}140$ m, and the streamwise patch length ranges from 70 m for the shortest patches to
 $16{\rm \pi} /2 \times h \approx 4.5$ km. Based on these values, we infer that the current set-up is not impossible in real-world scenarios.
The most obvious shortcoming of DNS studies is the low Reynolds number, which would be several orders of magnitude larger in the ABL. However, since we have shown in the previous section that the (homogeneous) high-Reynolds-number simulations follow local MOST quite well, we believe that low-Reynolds-number effects in these results are limited. Although LES would easily enable higher or infinite Reynolds numbers, it relies on MOST in the surface layer, while it is exactly the validity of MOST in heterogeneous flows that we wanted to test. Our results imply that, for surfaces with temperature heterogeneities of spanwise wavelength  $\lambda _y/h = {\rm \pi}/2$, there exists an outer layer in which local MOST is valid if the streamwise heterogeneity scale is not longer than
 $4{\rm \pi} h$. However, for this patch length, the secondary flows are not yet fully developed (figure 3) and dispersive transport is significantly smaller than for infinitely long strips (figures 4(c,d), 12 and 13). If the surface heterogeneity effects would approach those for infinitely long strips, local MO-scaling does not work as shown in figure 7(c,d). Unfortunately, the largest patch length in the present high-Reynolds-number simulations was not long enough to reach that limit, but given the similarity with the simulations at
 $Re_\tau = 180$, one may estimate from figure 3 that this limit would occur around the same patch length,
 $l_x \approx 8{\rm \pi} h$ (or
 $\lambda _x \approx 16{\rm \pi} h$). However, a wider range of Reynolds numbers, Richardson numbers and surface temperature layouts should be explored to draw more general conclusions.
A last remark regarding MOST concerns the explicit inclusion of dispersive fluxes in the present study. We have shown that this improves similarity close to the surface, where the peak in the  $\varPhi$ functions appears to scale with
 $k_x$ but remains on the same
 $z/\varLambda$ location. In field studies, localized eddy-covariance measurements do not account for dispersive transport due to secondary circulations; therefore, scaling relations derived from this may be biased (Roo & Mauder Reference Roo and Mauder2018; Bou-Zeid et al. Reference Bou-Zeid, Anderson, Katul and Mahrt2020). To incorporate sub-grid scale heterogeneity in mesoscale NWP models, mosaic approaches or methods involving modified flux-profile relationships based on local similarity have been developed (Stoll & Porté-Agel Reference Stoll and Porté-Agel2009; Mironov & Sullivan Reference Mironov and Sullivan2016), but a general procedure to understand the complex flow patterns over heterogeneous terrain remains lacking (Bou-Zeid et al. Reference Bou-Zeid, Anderson, Katul and Mahrt2020). Parametrizations for dispersive (shear) stresses based on surface characteristics are to be developed, for which the current dataset may serve as a reference. In that perspective, recent efforts have focused on predicting the decay of dispersive motions in the outer layer utilizing theoretical frameworks based on the linearized Navier–Stokes equations (Meyers, Ganapathisubramani & Cal Reference Meyers, Ganapathisubramani and Cal2019; Zampino et al. Reference Zampino, Lasagna and Ganapathisubramani2022), but they do not yet include streamwise heterogeneity or stratification effects.
As a more pragmatic approach, Margairaz et al. (Reference Margairaz, Pardyjak and Calaf2020b) introduced a non-dimensional number to determine under which conditions the influence of heterogeneous surface temperature on the mean flow is significant. This heterogeneity parameter,  $\mathcal {H} = (gl_h/U_g^2) (\Delta T/T_0)$, depends on the heterogeneity length scale
 $l_h$, geostrophic wind
 $U_g$ and surface temperature difference
 $\Delta T$, and represents a balance between buoyancy effects due to the surface heterogeneities and inertia of the mean flow. In their LES results, the ratio of dispersive to turbulent heat flux is directly related to
 $\mathcal {H}$ by a power law. In the context of spanwise heterogeneous temperature and using different scaling arguments, based on the balance equation for mean streamwise vorticity, Salesky et al. (Reference Salesky, Calaf and Anderson2022) arrived at a very similar dimensionless parameter
 $\mathcal {H} = (gl_y/u_\tau ^2) (\Delta \theta /\Delta \theta _0)$, where
 $l_y$ represents the spanwise heterogeneity length scale and
 $u_\tau$ friction velocity. They remark that
 $\mathcal {H}$ can be interpreted as a modified Richardson number, which quantifies the capacity for spanwise thermal gradients to sustain mixing in the plane. Although the above-mentioned heterogeneity parameters provide an elegant way to quantify thermal surface heterogeneity, there are two reasons why they cannot be directly applied to the present results. First, they have been derived for unstable stratification, using the convective velocity scale, and therefore do not account for the damping of vertical motions by mean stable stratification. Second, they do not account for the anisotropy (or aspect ratio) of the heterogeneity, which, as we have shown, strongly affects dispersive fluxes that are caused by streamwise-aligned secondary circulations. Finally, we notice that the present results of the skin friction coefficient and Nusselt number in figure 4(a,b) contradict the Reynolds analogy, which states that heat and momentum transfer behave qualitatively similar. Although for the cases with
 $Re_\tau = 180$ the values of
 $C_f$ and Nu are both strongly affected by surface heterogeneity, we found that at
 $Re_\tau = 550$, the effect on skin friction is very small while the heat transfer is significantly reduced. We can explain the reduction in heat transfer using the current results and arguments from Mironov & Sullivan (Reference Mironov and Sullivan2016) and Mironov & Sullivan (Reference Mironov and Sullivan2023), who performed an analysis of second-moment budgets in stably stratified boundary layers over streamwise varying surface temperature. They point out that temperature variance multiplied by the buoyancy parameter,
 $Ri_\tau$ in the present study, occurs as the buoyancy production term in the budget equation for vertical temperature flux, and therefore is a source of positive (upward) heat transfer that partially compensates the downward transport along the mean gradient. As a result, the magnitude of the total downward heat flux, which is constant throughout the entire channel in our set-up, is reduced. Importantly, Mironov & Sullivan (Reference Mironov and Sullivan2023) do not distinguish between what we defined as ‘dispersive’ and ‘turbulent’ motions, while our findings demonstrate that treating these terms separately can lead to a better understanding of heat flux over (thermally) heterogeneous surfaces. First, figure 6(b) (and figure 13d) clarify that the enhanced temperature variance near the surface is exclusively due to dispersive temperature fluctuations that are directly determined by the boundary condition. Second, figures 11(d) and 12(d) in Appendix B show that the upward heat transfer is primarily caused by dispersive motions. Lastly, examination of horizontal planes in figure 5 exposed that the upward heat flux contributions mainly originate from the high-temperature patches, where the local stratification is unstable, and both turbulent and dispersive temperature transport are upward.
4. Conclusions
Direct numerical simulations have been performed to analyse how the streamwise extent of spanwise heterogeneous temperature patches affects the secondary motions induced by them. A pressure-driven stably stratified channel flow set-up is used, with fixed-temperature boundary conditions at the bottom and top surface and equal stability ( $Ri_\tau = 120$). Two sets of simulations have friction Reynolds number
 $Re_\tau = 180$, spanwise heterogeneity wavelength
 $\lambda _y/h = {\rm \pi}/2$ and
 $\lambda _y/h = {\rm \pi}/4$, and streamwise wavelength between
 $\lambda _x/h = {\rm \pi}/4$ and
 $\lambda _x/h = 16{\rm \pi}$. A third set at
 $Re_\tau = 550$ with fixed patch width and varying patch length is considered to explore Reynolds-number effects and compare with MOST.
Three-dimensional visualizations of swirling strength show that streamwise-aligned secondary vortices develop over the patches. The strength of these circulations, measured by means of streamwise enstrophy or cross-stream velocity, decreases over the first part of the patch and then increases towards a final value. For long patches, the streamwise development of the structures appears to be a function of patch aspect ratio ( $a=\lambda _x/\lambda _y$) rather than only patch length. A visual inspection of the flow field suggests that a larger pair of counterrotating vortices that are induced by wider patches requires a longer distance to merge above the patch centre and reach a fully developed state, which may be related to tertiary vortices that develop in between. However a wider range of patch widths should be considered to verify this conclusion in a broader context. For the simulations with the longest patches and
 $Re_\tau = 180$, the secondary flows become fully developed after approximately 25 times the patch width. That is, the strength of the streamwise circulations is then equal to that over a surface with infinitely long spanwise heterogeneous temperature strips. For the latter surface type, the skin friction coefficient is strongly increased and the Nusselt number reduced compared with those of an equivalent homogeneous stable channel flow (Bon & Meyers Reference Bon and Meyers2022). Present results show that as the patch length or aspect ratio is decreased, the impact on friction and heat transfer is smaller. By means of triple decomposition of the velocity and temperature fields, we show that the contribution of coherent motions to the friction coefficient and Nusselt number is also reduced for smaller patches, because the secondary circulations are weaker. For the surface layouts with the shortest temperature patches (i.e.
 $a=1$), the
 $C_f$ and Nu are equal to those in a homogeneous channel, since the dispersive contribution due to streamwise-aligned secondary flows are negligible. This demonstrates that isotropic temperature heterogeneities with streamwise length scales smaller than
 ${\rm \pi} /2h \approx 1.57h$ have no global effect on the flow. Overall, there is a clear correlation between the strength of the streamwise circulations, the dispersive momentum and heat flux, and the increase (decrease) in
 $C_f$ (Nu). These trends are similar at
 $Re_\tau = 550$, except that the effect of heterogeneous surface temperature on the skin friction is significantly smaller than at
 $Re_\tau = 180$, and even induces a minor drag reduction in the cases with the strongest secondary flows. Additionally, the contribution of the dispersive to the total stresses is smaller. Nevertheless, the overall strength of the thermally induced secondary flows in this study, as measured by the domain-averaged coherent kinetic energy, is of the same order of magnitude as secondary flows generated by spanwise heterogeneous surface roughness as reported by Schäfer et al. (Reference Schäfer, Frohnapfel and Mellado2022).
For all surfaces with heterogeneous temperature, both the dispersive and turbulent temperature variances are substantially enhanced close to the wall. The former is more than an order of magnitude larger and a direct manifestation of the heterogeneous boundary condition, but decays fast away from the surface, indicating that the blending height for temperature is significantly lower than for the velocity components. The large temperature fluctuations can be used to explain the reduction of mean heat transfer in the channel, as this term appears in the second-order transport equation as a source of upward temperature flux (Mironov & Sullivan Reference Mironov and Sullivan2016). We show that this upward heat transfer, which is against the mean gradient, is mostly due to dispersive motions. An analysis of horizontal planes reveals that the upward heat flux primarily stems from the high-temperature patches, where the local stratification is unstable, and both turbulent and dispersive temperature transport are upward. Moreover, both dispersive and turbulent momentum flux display clear maxima at the same locations, indicating that the unstably stratified regions above the high-temperature patches play a crucial role in both heat and momentum transport. Comparing the results from the simulations with  $Re_\tau = 550$ to local Monin–Obukhov scaling, we demonstrate that the homogeneous simulation follows the empirical correlations for the scaled velocity and temperature gradients reasonably well. Since MOST is often used in an ABL context and these empirical correlations have been obtained from atmospheric data, this finding corroborates the idea that the present results are relevant to the atmospheric flows, which generally have a much higher Reynolds number. Even for most simulations with heterogeneous surface temperature, the similarity functions for velocity and temperature gradient collapse quite well in the outer layer, where dispersive stresses are negligible. Only the profiles from the surface with infinitely long patches do not match the empirical correlations. Closer to the surface, the gradient similarity functions show a significant peak. When dispersive fluxes are included in the local MOST equations, the locations of the peaks coincide for all cases, but the height increases with the length of the temperature patches or the strength of the secondary motions. Finally, we show that with an outer-layer scaling based on displacement thickness, mean profiles of all cases collapse fairly well.
Future work could obviously involve extending the data set to a wider range of surface layouts, stability strengths and Reynolds numbers. Particularly, moving from the weakly stable to the very stable regime would allow to explore the interaction between turbulence collapse and thermally induced secondary motions. Furthermore, including Coriolis force in a flow over a spanwise heterogeneous surface would allow to investigate the formation of secondary flows in an Ekman layer, where the wind direction becomes height-dependent as in the ABL.
Acknowledgements
The computational resources and services used in this work were provided by the VSC (Flemish Supercomputer Center), funded by the Research Foundation – Flanders (FWO) and the Flemish Government.
Funding
The authors acknowledge support from the Research Foundation Flanders (T.B., FWO grant number G098320N).
Declaration of interests
The authors report no conflict of interest.
Data availability statement
The data that support the findings of this study can be provided by contacting the corresponding author.
Author contributions
T.B. performed code implementations, carried out part of the simulations, worked on visualization and interpretation of results, and wrote the original draft. D.B. performed part of the simulations, contributed to conceptualization and interpretation. R.B.C. and J.M. supervised the research, reviewed the original draft and were responsible for acquisition of funding.
Appendix A. Sensitivity to surface temperature smoothing and grid resolution
The procedure that was used to smooth the heterogeneous temperature boundary condition is outlined in the first section of this appendix, and a comparison is presented between a case with and without smoothing. Subsequently, the grid sensitivity is discussed in § A.2. The additional simulations that are discussed here are summarized in table 3. They all have the same domain size, surface temperature layout X4Y0.5, averaging time and  $Re_\tau =180$.
Overview of simulations that have been performed to address the sensitivity to surface temperature smoothing and grid resolution.  $\sigma _s$ refers to the standard deviation used in the Gaussian filter kernel that is used to smooth the surface temperature, as described in the text.
 $\Delta _\alpha$ denotes the relative difference of
 $\alpha$ with respect to the reference case.

A.1. Smoothing of boundary conditions
The heterogeneous temperature boundary conditions are imposed by adding a spatially dependent term to the vertical derivative operators. Therefore, the surface temperature at every grid point is provided by an input file containing two 2-D arrays. These arrays are initially generated with sharp transitions from low to high (or high to low) temperature. To smooth these step functions, a two-dimensional Gaussian filter is used through the python function scipy.ndimage.gaussian_filter (Virtanen Reference Virtanen2020), with standard deviation  $\sigma _s$ and truncation after
 $4 \sigma _s$ grid points. For all cases reported in the body of this study, we used
 $\sigma _s = 1.5$, such that the radius of the Gaussian kernel is 6 and the full kernel size is
 $13 \times 13$ grid points.
To illustrate the effect of the Gaussian filter, we performed one simulation of layout X4Y0.5 with  $Re_\tau =180$ without smoothing of the boundary conditions, indicated by ‘NoSmoothing’ in table 3. This simulation was started from the instantaneous flow field of the smoothed case and advanced shortly until a steady state was reached, after which statistics were collected over the same time as the reference case. Figures 9 and 10 show the resulting time-averaged vertical velocity and temperature at the first grid point above the surface. Notice that figure 9 shows the streamwise development at the centreline (i.e.
 $y=L_y/2 = 2{\rm \pi}$) and the
 $x$-axis is centred around the transition from low to high surface temperature, while figure 10 is taken at
 $x=L_x/2=4{\rm \pi}$ and centred around the spanwise centre point. The red lines in these figures clearly show that oscillations occur in vertical velocity in temperature, related to Gibbs ringing due to the spectral method that we are using. These oscillations are clearly removed by applying the Gaussian filter (blue line). We should mention that these oscillations become smaller further above the surface, and that they are much less pronounced in horizontal velocity components
 $u$ and
 $v$ (not shown). Moreover, we point out that the spurious oscillations only have a small effect on the mean flow, given that the time-averaged friction coefficient and Nusselt number differ only by approximately one percent with respect to the smoothed case (as reported in table 3).
Streamwise development of (a) vertical velocity and (b) potential temperature at the first grid point above the surface at the centreline of the  $xy$-plane (i.e. at
 $y=2{\rm \pi}$). The
 $x-$axis is centred around one cold–hot transition, and expressed in viscous units.

Spanwise profiles of (a) vertical velocity and (b) potential temperature at the first grid point above the surface at the centreline of the  $xy$-plane (i.e. at
 $x=4{\rm \pi}$). The
 $y$-axis is centred around the spanwise centre of the domain, and expressed in viscous units.

A.2. Grid sensitivity
To assess the sensitivity of our results to the horizontal and vertical resolutions separately, we performed one simulation where we doubled the number of grid points in the  $x$- and
 $y$-directions (denoted by ‘2NxNy’ in table 3), and another where we doubled the vertical resolution (2Nz in table 3). Both were again initialized from an instantaneous field of the coarser case, interpolated to the finer grid. Note that when we doubled the horizontal resolution, we also doubled the standard deviation
 $\sigma _s$ of the Gaussian filter. In that way, the surface temperature transitions are smoothed over the same physical distance as in the coarser resolution case, as illustrated by the exact overlap of the blue and green lines in figures 9 and 10.
Table 3 shows that the effect of refining the grid on  $C_f$ and Nu is at most 0.21 %. The values obtained on the finer grid fall within the confidence interval of
 $C_f$ and Nu in the reference simulation, as calculated from time series using the moving block bootstrap method described by Bon & Meyers (Reference Bon and Meyers2022). Furthermore, we observed no significant changes in mean profiles of velocity and temperature, and both their turbulent and dispersive (co)variances (not shown here). This demonstrates that the grid resolution for the DNS of homogeneous stable channel flow is also sufficient for the cases with heterogeneous temperature boundary conditions considered here.
Appendix B. Mean profiles of first- and second-order statistics
B.1. Mean profiles at  $Re_\tau = 180$

To provide additional information on the vertical structure of the flow, the present appendix provides mean profiles of velocity, temperature and their vertical fluxes. Figure 11 displays the horizontally averaged profiles for the cases with  $Re_\tau =180$ and
 $\lambda _y/h = {\rm \pi}/2$. Close to the wall, all velocity profiles follow the law of the wall
 $u^+ = z^+$, as indicated by the grey dashed line in figure 11(a). Further away from the surface, the velocity and temperature distributions are more well mixed as
 $\lambda _x$ becomes larger. As a result, the case with infinitely long temperature strips exhibits the lowest centreline velocity of all cases. For the configuration with the shortest temperature patches, layout X0.5Y0.5, both the velocity and temperature profiles are approximately equal to the homogeneous case (black line), demonstrating that the surface heterogeneity in this case does not affect the mean flow field.
Horizontally averaged (a) velocity and (b) potential temperature profiles for cases with  $Re_\tau =180$ and
 $\lambda _y/h={\rm \pi} /2$. Grey dashed line indicates
 $u^+ = z^+$. (c,d) Horizontally averaged profiles of turbulent (full lines), dispersive (dashed lines) and viscous (dash-dotted lines) (c) flux of momentum and (d) heat. Arrows indicate direction of increasing streamwise wavelength
 $\lambda _x/h$, while the grey dashed line in (c) represents the expected linear profile of total shear stress.

To analyse the importance of dispersive transport, we apply triple decomposition (3.4) to the horizontally momentum and temperature fluxes. For the horizontally averaged shear stress, this results in
 \begin{equation} \tau_{xz} = u_\tau^2 \left(1 - \frac{z}{h}\right) = \underbrace{\nu \frac{{\textrm d}\langle \bar{u}\rangle}{{\textrm d}z}}_{viscous} \underbrace{-\langle \overline{u'w'} \rangle}_{turbulent} \underbrace{-\langle \bar{u}''\bar{w}''\rangle}_{dispersive}, \end{equation}
where the first equation on the left-hand side illustrates that the total shear stress in a fully developed channel flow is a linear profile. Each term of (B1) is shown separately in figure 11(c). In all cases, the viscous term (dash-dotted lines) dominates near the wall, where the velocity gradient is large and velocity components are by definition zero due to the no-slip walls. Away from the wall, the turbulent momentum flux  $\langle \overline {u'w'}\rangle$ (full lines) becomes dominant. In the cases with long patches however (reddish lines), the dispersive flux
 $\langle \bar {u}''\bar {w}'' \rangle$ also has a significant contribution, which even exceeds the turbulent flux. The inset of figure 11(c) shows a zoom of the dispersive fluxes, indicating that the peak location and magnitude increase as
 $\lambda _x/h$ becomes larger. Note that the area under this peak, weighted with the distance from the wall, is proportional to the dispersive contribution of the friction coefficient (as per (3.5)), and therefore this is consistent with figure 4(c).
Equivalently to (B1), the (kinematic) heat flux can be decomposed as
 \begin{equation} q_z = \left(\alpha \frac{{\textrm d}\langle \bar{\theta}\rangle}{{\textrm d}z} \right)_w = \underbrace{\alpha\frac{{\textrm d}\langle \bar{\theta}\rangle}{{\textrm d}z}}_{viscous} \underbrace{-\langle \overline{w'\theta'} \rangle}_{turbulent} \underbrace{-\langle \bar{w}''\bar{\theta}''\rangle}_{dispersive}. \end{equation}
The first equality, indicating that the total heat flux  $q_z$ is constant throughout the channel and equal to the molecular heat flux at the wall, can be derived by integrating the advection-diffusion equation for temperature with the present boundary conditions (Armenio & Sarkar Reference Armenio and Sarkar2002). The three terms in (B2) are displayed in figure 11(d), normalized by the friction temperature of the homogeneous channel. The latter is viewed as an inner scale for the temperature, corresponding to the friction velocity
 $u_\tau$ and is defined as
 $\theta _\tau = 1/u_\tau ( \alpha {\textrm d}\langle \bar {\theta }\rangle /{\textrm d}z )_w$ (Armenio & Sarkar Reference Armenio and Sarkar2002). The laminar heat flux at the wall (dash-dotted lines), which is directly proportional to the Nusselt number through (3.3a,b), is therefore equal to 1 for the homogeneous case and lower for all other layouts. Closely above the surface, the temperature gradient sharply increases, and this increase is enhanced for larger
 $\lambda _x$. The turbulent heat flux contribution (full lines) is mostly positive, indicating that
 $\langle \overline {w'\theta '}\rangle$ is negative, as usual in stably stratified flows. The dispersive component of the heat flux (dashed lines) is mostly negative, indicating that the dispersive heat transfer is counter-gradient, and consistent with the negative dispersive contribution to the Nusselt number mentioned in the previous section. Furthermore, the magnitude of
 $\langle \bar {w}''\bar {\theta }''\rangle$ increases as
 $\lambda _x$ grows, similar to the dispersive momentum flux.
B.2. Mean profiles at $Re_\tau = 550$

Here, we provide an additional discussion similar to that in the previous section but for the simulations with  $Re_\tau =550$. In general, we find that the dispersive fluxes and stresses are smaller compared to their turbulent counterpart than in the simulations with lower Reynolds number. Furthermore, the impact of surface temperature heterogeneity on the mean first- and second-order profiles of velocity are smaller than on the temperature distributions.
Mean profiles of velocity, temperature and their vertical fluxes are displayed in figure 12. Considering the mean streamwise velocity in figure 12(a), we see that only the profile from the streamwise homogeneous case (XhY0.5) is considerably different, exhibiting a higher gradient in the near-wall region but a more well-mixed profile in the channel core. As a result, the integrated bulk velocity, and therefore the friction coefficient, is nearly equal for all cases (cf. figure 4). In the near vicinity of the wall, all velocity profiles collapse on the linear law of the wall  $u^+ = z^+$, as indicated by the dashed grey line. The dispersive momentum fluxes in figure 12(c) show the same trend as in the
 $Re_\tau =180$ cases, namely that their magnitude and peak location decrease as
 $\lambda _x$ becomes smaller. However, the size of the dispersive momentum flux compared to that of the turbulent flux is smaller. The laminar contribution (dash-dotted lines) is also smaller than in the cases with
 $Re_\tau = 180$ (cf. figure 11c), due to lower viscosity. All in all, we conclude that turbulent momentum fluxes are relatively more important at higher Reynolds number.
Same as figure 11, but for  $Re_\tau =550$.

For the mean temperature profile and temperature fluxes in figure 12(b,d), however, we find larger differences between different surface layouts and a trend more similar to the low-Reynolds-number cases. While the molecular heat flux at the wall (dash-dotted lines), which is proportional to Nu (cf. figure 4b), decreases as  $\lambda _x$ increases, the near-wall pycnocline becomes stronger. Not only is the dispersive heat flux negative, also the turbulent temperature transport shows small negative values close to the wall. As explained in § 3.3, this counter-gradient mean heat flux is related to the unstably stratified regions above the high-temperature patches. In addition, figure 13 displays the total velocity and temperature variances and their dispersive components. In general, it is clear that the dispersive contributions (dashed lines) of the velocity variances are significantly smaller than the total normal stresses (full lines). This again indicates that the significance of the dispersive compared with the turbulent stresses decreases as the Reynolds number increases. The exception is the case with infinitely long strips (XhY0.5), where
 $\langle \bar {u}''\bar {u}''\rangle$ exceeds
 $\langle \overline {u'u'}\rangle$ in some part and penetrates nearly to the channel centre.
Same as figure 6, but for simulations with  $Re_\tau =550$.

The temperature variances in figure 13(d) are qualitatively similar to the low-Reynolds-number cases in figure 6(b). Quantitatively, we see that the turbulent temperature variance is larger at higher Reynolds number. Although the dispersive temperature variance at the wall is equal for all heterogeneous cases, since it is determined by the boundary conditions, the inset in figure 13(d) discloses that  $\langle \bar {\theta }''\bar {\theta }''\rangle$ decays faster, as it is already negligible at
 $z/h \gtrsim 0.1$ (compared with
 $\sim 0.15$ for the cases with
 $Re_\tau = 180$).