INTRODUCTION
Production of milk takes place within the mammary gland following parturition, and the volume of milk produced in a given period of time varies with stage of lactation. Lactation models provide concise summaries of the evolution of milk yield during lactation determined by the biological efficiency of the animal. Lactation curves are valuable tools in research and farm management, and applications include estimation of total lactation yield from incomplete records, analysis of economic aspects, use in feeding trials as a covariate and integration in nutrient-based models that predict changes in milk production in response to variations in the diet (Baldwin et al. Reference Baldwin, France and Gill1987; Leon-Velarde et al. Reference Leon-Velarde, McMillan, Gentry and Wilton1995; Scott et al. Reference Scott, Yandell, Zepeda, Shaver and Smith1996; Dekkers et al. Reference Dekkers, Hag and Weersink1998; Hanigan et al. Reference Hanigan, Rius, Kolver and Palliser2007).
Much attention has been paid to modelling lactation curves, but the standard reference model is still the incomplete gamma function proposed by Wood (Reference Wood1967; hereafter referred to as Wood's equation). A number of other models have been suggested to overcome some of the limitations of Wood's equation (e.g. Cobby & Le Du Reference Cobby and Le Du1978; Rook et al. Reference Rook, France and Dhanoa1993; Fathi Nasri et al. Reference Fathi Nasri, France, Odongo, Lopez, Bannink and Kebreab2008; López Reference López, France and Kebreab2008). In general, such models of lactation curves have provided good fits to observations and describe total milk yield accurately. Some attempts to find an even more attractive empirical model may have resulted in smaller and more random residuals, but these are generally more complex and become unsuitable for practical use (Rowlands et al. Reference Rowlands, Lucey and Russell1982; Rook et al. Reference Rook, France and Dhanoa1993; Williams Reference Williams1993; Scott et al. Reference Scott, Yandell, Zepeda, Shaver and Smith1996). Furthermore, parameters contained in some of these alternative equations are not always biologically interpretable.
Advances in mechanistic modelling, however, have provided models supported by some rationale assumed to represent biological processes occurring in the mammary gland. Dijkstra et al. (Reference Dijkstra, France, Dhanoa, Maas, Hanigan, Rook and Beever1997) developed a mechanistic model that describes proliferation and death of mammary gland cells during pregnancy and lactation. In view of the close relationship between cell numbers in the gland and milk production (Tucker Reference Tucker1987; Wilde et al. Reference Wilde, Henderson, Knight, Blatchford, Faulkner and Vernon1987; Fowler et al. Reference Fowler, Knight, Cameron and Foster1990), this model offered the opportunity to describe lactation data. The mechanistic representation provides an understanding of factors controlling the variation in milk production throughout lactation that cannot be attained with most empirical models. As with Wood's equation, this model allows simple calculation of position and magnitude of peak yield but, in contrast to the classical equation, the mechanistic model is not forced to a milk yield at parturition equal to zero and allows for a realistic estimate of initial yield on parturition day.
There are many factors causing variation in shape of the lactation curve and multiple various effects must be considered in a study of this nature. External effects, such as season of calving, weather and climate, obviously alter the expression of production potential (Knight et al. Reference Knight, Peaker and Wilde1998). Variation caused by factors of this type will not be examined in this particular model evaluation, and only basic parameters that describe the underlying biology of lactation will be studied. Previously, correction factors have been introduced in an attempt to overcome such variation in cattle, goats and sheep (Wood Reference Wood1969; Rowlands et al. Reference Rowlands, Lucey and Russell1982; Scott et al. Reference Scott, Yandell, Zepeda, Shaver and Smith1996; Portolano et al. Reference Portolano, Spatafora, Bono, Margiotta, Todaro, Ortoleva and Leto1997). Greater complications arise when using a mechanistic model. For instance, non-limited supply of nutrients to the mammary gland needs to be assumed for simplification.
The objectives of the current study were: (i) to evaluate the mechanistic model developed by Dijkstra et al. (Reference Dijkstra, France, Dhanoa, Maas, Hanigan, Rook and Beever1997) ; (ii) to compare it to the widely used incomplete gamma function of Wood (Reference Wood1967) using lactation data from cows, goats and sheep; and (iii) to identify variation in lactation parameters related to animal factors such as species and parity.
MATERIALS AND METHODS
Database
The data used in the current study consist of a number of data sets comprising lactation recordings from cow, goat and sheep herds. Dairy cattle data (176 lactation curves of Holstein Friesian cows) were taken from two trial groups and were recorded in 1994/95 and 1997/98 at the Centre for Dairy Research (University of Reading, UK) with lactations varying in length from 26 to 48 weeks. Milk yields were recorded daily and then converted to average daily milk yield per week. All cows calved between August and December of their particular year and were fed a standard diet. Data from Murciano–Granadina goats (30 lactation curves) were collected in southern Spain, where recordings had been taken on random test-days, and then converted to weekly average daily yields. The first milk recording was between 10 and 40 days after parturition and mean lactation length was 240 days, with minimum and maximum lactation lengths of 23 and 38 weeks. During lactation, milk yield was recorded weekly with average intervals of 6 days (s.d. 4·5). Spanish Churra sheep data (40 lactation curves) were obtained from the flock managed at the experimental farm of the University of León (Spain), where milk yields were recorded up to week 25 (average lactation length 153 days, minimum and maximum lactation lengths of 109 and 173 days). In this flock, the lambs were suckled by their mother and weaning was on average 34 days after parturition. The first milk recording was 8–35 days after parturition (average 19 days) and thereafter recordings were taken weekly. In the pre-weaning period, lambs were separated from their mother for 8 or 16 h (depending on morning or afternoon milk recording) prior to the milking in which milk production was measured.
Lactation models
Two models were used in the current study to describe lactation curves, viz. the incomplete gamma function referred to as Wood's equation (Wood Reference Wood1967) and the lactation model based on mammary cell proliferation and death, referred to as the mechanistic model (Dijkstra et al. Reference Dijkstra, France, Dhanoa, Maas, Hanigan, Rook and Beever1997). Wood's equation is

where M is milk production (kg/day) at time t of lactation (weeks), and a, b and c are parameters that determine the shape and scale of the curve. Parameter a is related to peak milk yield, b is the inclining slope parameter up to peak yield, and c is the declining slope parameter.
The mechanistic lactation model is

where M 0 is the initial rate of milk production (kg/day) at parturition (t=0 weeks). The parameters μ (per week) and λ (per week) are defined as the specific rates of secretory mammary cell proliferation at parturition and of death respectively, and k (per week) as a decay parameter associated with reduction in cell proliferation capacity with time.
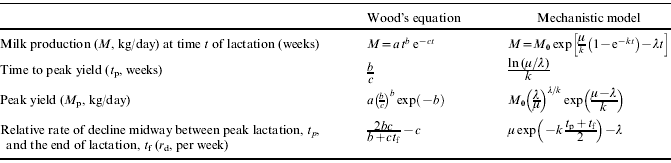
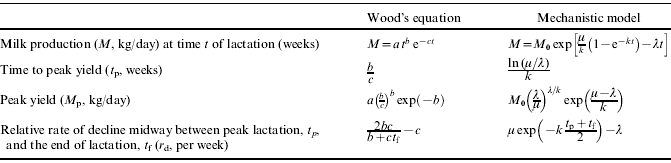
Formulae commonly used for lactation performance attributes (peak yield, M p; time to peak yield, t p; relative rate of decline at midway point between peak and end of lactation, r d) for both models are given in Table 1. Total lactation milk yield was calculated by numerical integration, taking standard lactation periods of 305, 240 and 120 days for cattle, goats and sheep, respectively.
Formulae commonly used for lactation performance for Wood's equation and the mechanistic model
Statistical analysis
Wood's equation (Eqn 1) and the mechanistic model (Eqn 2) were fitted by non-linear regression to the data described above using the PROC NLIN statement of the statistical package SAS (SAS 1999). This non-linear regression method is preferred to that of log-linear transformation, because the reduction in weighting of higher yields when using the log-scale may lead to a greater lack of fit around the peak (Cobby & Le Du Reference Cobby and Le Du1978). Estimates of the parameters of each of the models were obtained for each individual lactation curve within the database. The residual mean square (RMS), as a measure of goodness-of-fit, was calculated for each individual lactation curve and used for the comparison of strengths and weaknesses of statistical fit attained with the two models under investigation. Based on information theory, alternative methods have been developed for comparing models, determining which model is more likely to be correct. Akaike information criterion (AIC) was calculated as
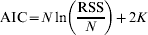
where RSS is the residual sum of squares, N is the number of data points and K is the number of independent parameters in the model (Burnham & Anderson Reference Burnham and Anderson2002; Motulsky & Christopoulos Reference Motulsky and Christopoulos2003).
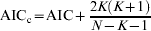
With data sets without a large number of data points (N) or for models containing more parameters, corrected AIC (AICc) is more accurate:
Bayesian information criterion (BIC; Leonard & Hsu Reference Leonard and Hsu2001) is a model-order selection criterion based on parsimony and imposes a penalty on more complicated models for inclusion of additional parameters:
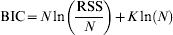
A smaller numerical value of AIC, AICc or BIC indicates a better fit when comparing models. The likelihood that a model is correct can be calculated based on the difference between AICc scores. Akaike's weights and evidence ratios were calculated and used to quantify the plausibility of each equation being the best model for fitting the lactation data (Burnham & Anderson Reference Burnham and Anderson2002; Motulsky & Christopoulos Reference Motulsky and Christopoulos2003).
Analysis of variance was performed for the comparisons of the parameter estimates between animal species and number of lactations within each species, with multiple comparisons among means carried out by the Tukey method.
Initially, a number of problems arose in fitting the models to the experimental data. Without suitable initial estimates of model parameters, the procedure tended to fail to converge (particularly with the mechanistic model) or to give a very poor fit. To provide satisfactory starting estimates, several possible values were specified for each parameter, so that the NLIN procedure evaluates the model at each combination of initial values on the grid, using for the first iteration of the fitting process the combination yielding the smallest RMS. Additionally, some restrictions were imposed on parameter estimates, so that parameters b and c of Wood's equation and parameters μ, k and λ of the mechanistic model would be positive.
RESULTS
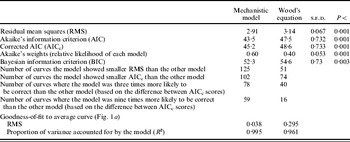
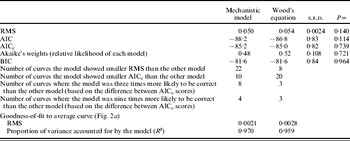
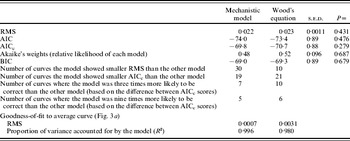
Some lactation curves were well-fitted and others poorly fitted by each of the models. For more than two-thirds of the cow lactation curves (125 of the 176 lactations), RMS values for the mechanistic model were lower than those for Wood's equation and average RMS value for all lactations was significantly smaller for the mechanistic than for Wood's equation (Table 2). This indicates that the mechanistic model provided a statistically better fit than Wood's equation for the majority of lactation curves, but due to the sensitivity of the model in cases where the data showed a large day-to-day variation, obtaining a reasonable fit became a problem leading to high RMS values. Comparison of maximum RMS values recorded for each model revealed the poor fit observed with the mechanistic model with some particular curves (for which RMS was very high). The mechanistic model also generally resulted in smaller RMS values when analysing goat (22 of the 30 lactations; Table 3) and sheep (30 of 40 lactations; Table 4) data.
Statistical performance of mechanistic model and Wood's equation when applied to 176 dairy cow lactation curves

s.e.d.=standard error of the difference.
Statistical performance of mechanistic model and Wood's equation when applied to 30 goat lactation curves

s.e.d.=standard error of the difference.
Statistical performance of mechanistic model and Wood's equation when applied to 40 sheep lactation curves

s.e.d.=standard error of the difference.
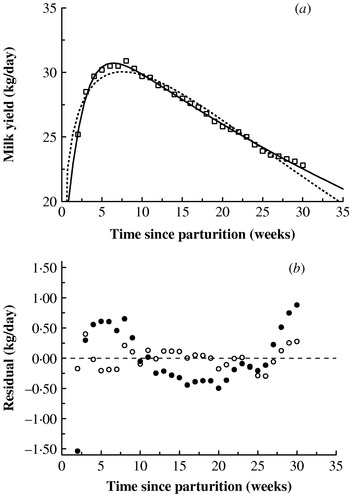
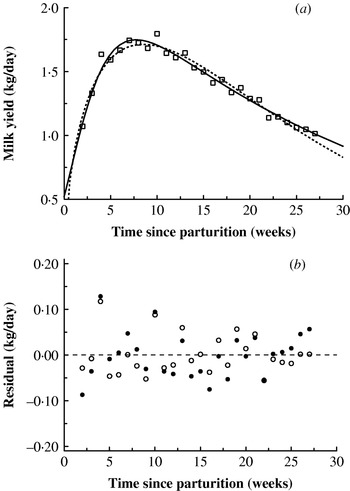
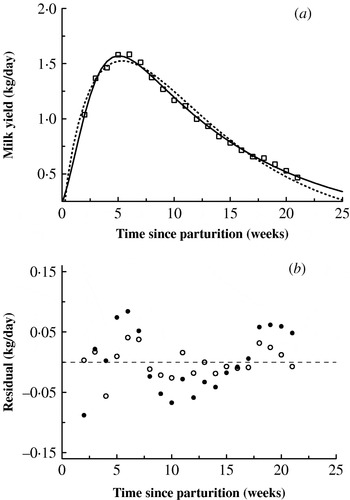
Along with comparison of RMS values for both models when fitted to the same curves, it is necessary to examine the pattern of the residuals. Cow lactation data were combined to give a single mean lactation curve for all 176 cows. Figure 1a compares the fitted curves against the observed experimental values and the resulting residuals are plotted in Fig. 1b. Both models were also fitted to lactation data for 30 goats and 40 sheep and residuals during lactation were examined. Plots of fitted curves and of residuals for average goat and sheep lactation curves are shown in Figs 2a, b and 3a, b, respectively. Figures 1a, 2a and 3a clearly indicate a better fit by the mechanistic model than Wood's equation, with the former demonstrating smaller and more randomly distributed residuals (Figs 1b, 2b and 3b). Statistics of goodness-of-fit (RMS, R 2) revealed that the mechanistic model provided a better fit to average lactation curves than Wood's equation (Tables 2–4). Wood's equation consistently underestimated peak yield, overestimated yield in early lactation and underestimated yield in late lactation. The residuals of the mechanistic model were more randomly distributed and showed little sign of recurring trends, apart from slight underestimation of yield in late lactation in cows.


Information criteria (AIC, AICc and BIC) confirmed the comparison between models. The mechanistic model was superior to Wood's equation in fitting cow lactation curves, showing smaller AIC, AICc and BIC (Table 2), whereas both models seemed to be equally successful in fitting goat or sheep lactation curves based on the average values of information criteria (Tables 3 and 4). Evidence ratios used for model comparison in Tables 2–4 represented those situations in which the best model was either 3 (relative probabilities of 0·75 and 0·25 for the best and worst models, respectively) or 9 (relative probabilities of 0·9 and 0·1 for the best and worst models, respectively) times more likely to be correct than the other model (based on the difference between AICc scores). For cow lactation curves, evidence ratios showed that the mechanistic model was more likely to be accurate than Wood's equation for a substantial number of curves (Table 2).
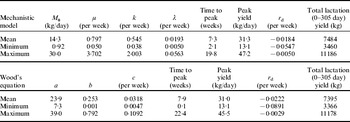
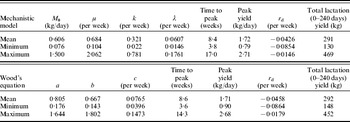
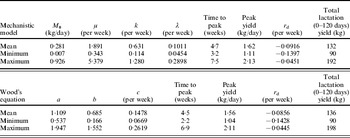
On summarizing these observations on goodness of fit and likelihood of correctness of the models (based on information theory), it appears that the mechanistic model generally fitted better to curves characterized by a sharp peak, with Wood's equation favouring a more gradual rise and decline in yield and curves that peak slightly later in lactation. The consequences of this trend were that for the cow data, Wood's equation generally resulted in estimation of later peaks and lower peak yields (7·94 weeks and 31·0 kg/day, respectively), compared with estimates from the mechanistic model (7·32 weeks and 31·3 kg/day, respectively) (Table 5). Parameter estimates from goat data gave rise to a similar trend (Wood's equation: 8·59 weeks and 1·71 kg/day, respectively; mechanistic model: 8·41 weeks and 1·72 kg/day, respectively; Table 6), but, although a smaller mean peak yield for sheep was estimated by Wood's equation, the average time to peak was shorter than that estimated by the mechanistic model (Table 7). Estimates of total lactation milk yield in goats were similar with both models, whereas for cows the mechanistic model resulted in an estimate of total lactation milk yield that was 1·2% greater than that estimated from Wood's equation, but in sheep the mechanistic model estimated a 2·9% lower total milk yield than Wood's equation.
Estimated parameters and lactation performance attributes obtained from the mechanistic model and Wood's equation when applied to 176 dairy cow lactation curves

r d=relative rate of decline midway between peak lactation and the end of lactation.
Estimated parameters and lactation performance attributes obtained from the mechanistic model and Wood's equation when applied to 30 goat lactation curves

r d=relative rate of decline midway between peak lactation and the end of lactation.
Estimated parameters and lactation performance attributes obtained from the mechanistic model and Wood's equation on application to 40 sheep lactation curves

r d=relative rate of decline midway between peak lactation and the end of lactation.
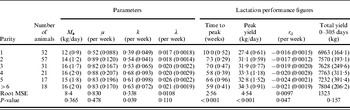
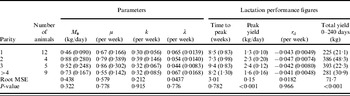
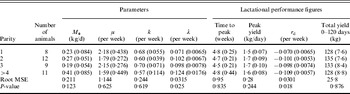
Having established that the general fit of the mechanistic model was at least as good as Wood's equation, the lactation parameters of the mechanistic model were analysed across species and across parity groups within species (Tables 8–10). From the cow data, a variation in the estimated initial milk production M 0 of between 0·9 and 30·0 kg/day was observed (Table 5). The average estimate of M 0 by lactation showed a tendency to increase from first lactation heifers to cows in their third lactation (Table 8), although differences were not significant. For goats and sheep, this tendency was less pronounced. Obviously, in comparison with cattle M 0 was much smaller for goats and sheep. Total milk production was lowest for first parity cows, goats and sheep as expected.
Parameter estimates for the mechanistic model (s.e.m. in parenthesis) for cow (n=176) data averaged across parity

s.e.m.=standard error of the mean; MSE=mean square error (d.f.=170); r d=relative rate of decline midway between peak lactation and the end of lactation.
Parameter estimates for the mechanistic model (s.e.m. in parenthesis) for goat (n=30) data averaged across parity

s.e.m.=standard error of the mean; MSE=mean square error (d.f.=26); r d=relative rate of decline midway between peak lactation and the end of lactation.
Parameter estimates for the mechanistic model (s.e.m. in parenthesis) for sheep (n=40) data averaged across parity

s.e.m.=standard error of the mean; MSE=mean square error (d.f.=36); r d=relative rate of decline midway between peak lactation and the end of lactation.
For cattle, the specific rate of secretory mammary cell proliferation at parturition, μ, was lowest in first lactation (0·52 per week) (Table 8). This rate varied from 0·82 to 0·89 per week in multiparous cows. Such an effect was not apparent for goats and sheep, probably due to few data available within each parity. A similar pattern emerged for the growth decay parameter k. The average cell proliferation rate was much higher for sheep than for cattle and goats, indicating a potentially faster increase in secretory cell number for sheep. However, the specific rate of cell death λ appeared to be much lower for cattle, giving rise to a slower decrease in secretory cell numbers as lactation proceeds and indicative of a higher persistency of lactation.
Using the parameters of the mechanistic model, a large variation was observed in the estimated number of weeks to peak yield, t p, in cows (2·1–19·8; average 7·3 weeks), with the yield at t p averaging 31·3 kg/day (range 13·1–47·2) (Table 5). The average time to peak for goat lactations was later (8 weeks) with an average peak yield of 1·72 kg/day (Table 6), with sheep showing the earliest average time to peak (5 weeks) and lowest average peak yield (1·62 kg/day) (Table 7). The relative rate of decline midway between peak lactation and the end of lactation, r d, was calculated. A constant of 305, 240 and 120 days was used as the length of lactation, t f, of cattle, goats and sheep, respectively. r d values (per week) were in descending order: −0·0184 for cows, −0·0426 for goats and −0·0916 for sheep. If a constant of 305 days (cattle lactation length) was used as the length of lactation for goats and sheep, so as to compare the r d values of species for the same lactation length, the r d values (per week) changed only slightly: −0·0459 and −0·1008 for goats and sheep.
DISCUSSION
Over the years, Wood's equation has been the standard model to describe the lactation curve of animals. Although Wood (Reference Wood1977) tried to integrate the rate parameters of this empirical model with the processes of proliferation and death of mammary gland cells, practical interpretations of these rate parameters were not provided. The mechanistic model developed by Dijkstra et al. (Reference Dijkstra, France, Dhanoa, Maas, Hanigan, Rook and Beever1997) was the first model that gave a biological description of the lactation curve. It is based on theories of mammary cell death and proliferation and has been initially utilized to describe mammary gland growth patterns during pregnancy and lactation. The dynamic representation of mammary cell growth and apoptosis allows for the calculation of total mammary cells, a key parameter in models predicting milk and milk component yields and nutrient partitioning between milk and body stores (Baldwin et al. Reference Baldwin, France and Gill1987). In the model of Hanigan et al. (Reference Hanigan, Rius, Kolver and Palliser2007), parameters describing cell proliferation and cell death were estimated for multiparous cows only. The results from the present analysis (Table 8) suggest that an alternate set of parameters for primiparous cows is warranted. It should be noted that the enzymatic activity per secretory cell varies during lactation (Knight & Wilde Reference Knight and Wilde1993), not reaching a maximum until several days or weeks after parturition, after which the activity remains relatively constant. The combination of secretory capacity per cell and cell numbers explains the changes in milk production throughout lactation. The number of cells and the secretory activity per cell cannot both be uniquely defined from lactation data using the mechanistic model. This is partly reflected by the non-physiological maximum values of rate of cell proliferation at parturition as high as 5·379 per week (Table 7) and discussed fully by Dijkstra et al. (Reference Dijkstra, France, Dhanoa, Maas, Hanigan, Rook and Beever1997).
Similar to the mathematical approach of Rook et al. (Reference Rook, France and Dhanoa1993), the mechanistic model can, essentially, be rearranged and presented as the product of two functions F 1 and F 2, where F 1 is  and F 2 is
 . This transformation implies that the first component, F 1, is a more complex alternative to the function at b of Wood's equation, and the specific rate of cell death λ of the mechanistic model would be similar to the declining slope parameter c of Wood's equation. Plotting λ against c shows a positive correlation between the two values for each of the 176 cow lactation curves, verifying similarity in their functional properties:

where s.e. is standard error of the estimate.
There is an obvious correspondence between the curve for lactation and the pattern of appearance in faeces of a digesta-flow marker, in that they both rise to a fairly early peak and subsequently fall away. Dhanoa et al. (Reference Dhanoa, Siddons, France and Gale1985) and France et al. (Reference France, Thornley, Dhanoa and Siddons1985) derived an equation by solving a multi-compartmental model assuming first-order kinetics:

to describe faecal marker concentration patterns, where C denotes marker concentration (μg marker/g dry matter faeces) at time t (h), and A, n, k 1 and k 2 are parameters.
It was not possible, at the time, to re-nominate this multi-compartment scheme in a way that was biologically meaningful for lactation. However, returning to our current lactation model, Eqn (2) can be written as

Clearly, Eqns (3) and (4) are mathematically equivalent. Therefore, the functional form given by Eqns (3) and (4) can be derived as either a multi-compartment, first-order process or a single-compartment process with exponentially declining fractional proliferation and constant fractional (first-order) death.
Another mathematically equivalent form is the derivative of the Gompertz growth function (Gompertz Reference Gompertz1825; Thornley & France Reference Thornley and France2007):

Equation (5) was promulgated as an egg-yolk output curve (Emmans & Fisher Reference Emmans, Fisher, Fisher and Boorman1986) and subsequently proposed as a lactation curve (Friggens et al. Reference Friggens, Emmans and Veerkamp1999; Thornley & France Reference Thornley and France2007), where G 0 [=ln(n−2)], b (=k 2−k 1) and c were defined by Friggens et al. (Reference Friggens, Emmans and Veerkamp1999) as the degree of maturity of the milk-producing system at calving (a measure of milk secretory potential at parturition), rate at which milk yield increases to peak and rate of decline in milk yield parameters, respectively. Although no formal derivation was offered for Eqn (5), Friggens et al. (Reference Friggens, Emmans and Veerkamp1999) showed that this equation was equivalent to the mechanistic model derived by Dijkstra et al. (Reference Dijkstra, France, Dhanoa, Maas, Hanigan, Rook and Beever1997), so that the choice of which parameterization to use would depend upon how well the parameter interpretations relate to the purpose for which the model is to be applied. From the parameters of Eqn (5), lactation attributes such as peak yield, maximum acceleration in milk yield, or times to these points can be calculated (Hansen et al. Reference Hansen, Friggens and Højsgaard2006; Fathi Nasri et al. Reference Fathi Nasri, France, Odongo, Lopez, Bannink and Kebreab2008).
Both the mechanistic model and Wood's equation explained much of the variation in lactation data, describing milk yield with a high degree of accuracy. Present ability to describe these biological processes using simple mathematical formulae is impressive. Future efforts in lactation modelling should therefore focus on developing new statistical approaches and more complex models to address issues such as variation due to animal and environmental factors. The mechanistic model was generally found to be of statistically better fit than Wood's equation with residuals invariably demonstrating more randomness. In agreement with other authors (Val-Arreola et al. Reference Val-Arreola, Kebreab, Dijkstra and France2004; Dematawewa et al. Reference Dematawewa, Pearson and VanRaden2007), the mechanistic model derived by Dijkstra et al. (Reference Dijkstra, France, Dhanoa, Maas, Hanigan, Rook and Beever1997) is, in many cases, superior to the classical Wood's equation for fitting lactation curves, with the advantages of mechanistic representation of the processes occurring in the mammary gland at the cell level and of the plausible biological interpretation of the parameters. In the present study, the superiority of the mechanistic model was clearly demonstrated for the cow lactation curves. For lactating cows, the various parameters in Table 5 are largely in line with those reported by Dijkstra et al. (Reference Dijkstra, France, Dhanoa, Maas, Hanigan, Rook and Beever1997), Val Arreola et al. (Reference Val-Arreola, Kebreab, Dijkstra and France2004) and Dematawewa et al. (Reference Dematawewa, Pearson and VanRaden2007). As discussed in Dijkstra et al. (Reference Dijkstra, France, Dhanoa, Maas, Hanigan, Rook and Beever1997), direct comparison of parameters in the mechanistic model with experimentally derived parameters is usually not straightforward. Rate parameters in the model are defined in units of time (per week), whereas experimental data are expressed in terms of e.g. fraction of alveolar nuclei (proportion of total) (Sorensen et al. Reference Sorensen, Nørgaard, Theil, Vestergaard and Sejrsen2006) or apoptotic index (proportion of total cells; Capuco et al. Reference Capuco, Wood, Baldwin, McLeod and Paape2001). Where applicable, qualitative comparisons between model and experimental values have been discussed by Dijkstra et al. (Reference Dijkstra, France, Dhanoa, Maas, Hanigan, Rook and Beever1997). In the case of sheep and goat lactation curves, the mechanistic model was at least as good as the classical Wood's equation in terms of statistical performance, and offered the possibility of a mathematical representation of the underlying biology. The classical Wood's equation imposes a milk yield at parturition equal to zero, whereas the mechanistic model allows for a realistic estimate of initial yield on parturition day. From the cow data, a variation in the estimated initial milk production M 0 of between 0·9 and 30·0 kg/day was observed (Table 5). The minimum value, in particular, appeared unrealistically low and, on examination of the lactations in such cases, the presence of abnormally low yields during early lactation was observed. These low yields, caused by health problems (e.g. mastitis, lameness, etc.), forced the model to underestimate initial yield. The Dijkstra mechanistic model has been recommended as sufficient for modelling lactation curves (Val-Arreola et al. Reference Val-Arreola, Kebreab, Dijkstra and France2004; Dematawewa et al. Reference Dematawewa, Pearson and VanRaden2007), because other mechanistic models representing biology in the mammary gland, such as that of Pollott (Reference Pollott2000), are over-parameterized, and thus of less practicability. In line with earlier reports (e.g., Cobby & Le Du Reference Cobby and Le Du1978; Rowlands et al. Reference Rowlands, Lucey and Russell1982; Rook et al. Reference Rook, France and Dhanoa1993), Wood's equation tended to over-predict milk production in early lactation and under-predict peak yield (Figs 1a, b, 2a, b and 3a, b). It was noticed, however, that if a set of data was of poor quality, Wood's equation showed greater ability to find a closer fit, with the mechanistic model tending to result in large RMS values. This is particularly so when the number of pre-peak observations is small, as indicated by the generally better fit of Wood's equation for some of the sheep lactations. For sheep, first recordings were taken only at on average 19 days after parturition. Peak production of these sheep occurred at 33 days on average, limiting the number of pre-peak observations much more than for cattle or goats. Analysing simulated data, Dijkstra et al. (Reference Dijkstra, France, Dhanoa, Maas, Hanigan, Rook and Beever1997) found that the right amount and spread of data are required to obtain a satisfactory fit of the mechanistic model. Thus the less satisfactory fit of the mechanistic model to the sheep data may be explained by inadequacy of the data. Official regulations for milk controls (applicable mainly to breeding programmes), for several goat and sheep breeds give an interval between records of 28–34 days, i.e. monthly records. Hence under practical situations, the number of controls would be too small for the mechanistic model to be applied. From a research point of view, to study factors related to proliferation and death of mammary secretory cells and to milk yield, more records than officially required are necessary.
When analysing parameter variation across lactation for the goat and sheep data it is difficult to draw physiological conclusions, because of the small numbers of animals in each subset of the data. The differences within the goat estimates, in particular, do not give a clear indication of trends. However, some novel findings were obtained from using the biologically based lactation model. The specific proliferation rate at parturition μ was smaller for cattle and goats than for sheep. In cattle, μ was lowest for first parity animals. In guinea pigs, higher total numbers of mammary gland cells, as indicated by mammary gland DNA, were observed from first to sixth lactation, with the increase in DNA content becoming much smaller with higher lactation numbers (Anderson & Sheffield Reference Anderson and Sheffield1983). Similarly, in goats, higher numbers of parenchyma cells were observed in second lactation compared to first lactation (Fowler et al. Reference Fowler, Knight, Cameron and Foster1990). The growth rate of parenchyma cells in the final part of gestation, near parturition, was also smaller for first lactation goats compared with second lactation goats. Such observations correspond well with the observed lower values of μ in first lactation cows compared with later lactations. Effects of goat parity on peak yield and time to peak are similar to those reported by Fernández et al. (Reference Fernández, Sánchez and Garcés2002) and Groenewald & Viljoen (Reference Groenewald and Viljoen2003). The proliferation of mammary cells in pregnant animals at the end of lactation to prepare the gland for the next lactation (Fowler et al. Reference Fowler, Knight, Cameron and Foster1990) is not represented in the mechanistic model and may result in a tendency to underestimate milk yield at the very end of lactation (Fig. 1b).
The decrease in specific rate of proliferation of mammary cells as lactation proceeds and cells become differentiated (Knight & Wilde Reference Knight and Wilde1993) is represented in the mechanistic model by the growth decay parameter k. Small values of k indicate a high capacity of mammary secretory cells to maintain the initial value of specific proliferation rate at parturition μ with time. The estimated values of k were lower for first lactation than later lactation cows (Table 8). However, for goats and sheep this effect was absent, likely related to the small number of animals in each subset. At the same time, the specific proliferation rate of secretory cells at parturition μ was lower for first lactation cows, in line with experimental results as discussed before. As a result of these differences in k and μ, from approximately the second week of lactation onwards, the specific proliferation rate of cow mammary gland cells (calculated as μ exp[−kt], Dijkstra et al. Reference Dijkstra, France, Dhanoa, Maas, Hanigan, Rook and Beever1997) was higher for first lactation animals than for later lactation animals. In line with these trends, Fowler et al. (Reference Fowler, Knight, Cameron and Foster1990) observed that although late gestation parenchymal growth in first parity goats was much lower than in second lactation goats, early lactation parenchymal growth in first parity goats was much more pronounced than in second lactation goats. Thus it appears that the mechanistic model provides parameter estimates that can be implemented in detailed studies of mammary gland cell dynamics.
High peak milk production may increase negative energy balance (NEB) in early lactation animals, and NEB is associated with increased incidence of metabolic disorders and reduced reproductive performance, albeit dependent on diet composition (Van Knegsel et al. Reference Van Knegsel, Van den Brand, Dijkstra, Tamminga and Kemp2005). Animals with a more persistent lactation curve (i.e. animals with a lower rate of decline in milk yield after peak lactation) may be less stressed, have better feed utilization efficiency and less nutrition related diseases than animals with a less persistent lactation curve; also, differences in persistency between animals may exist because of genetic selection (Shanks et al. Reference Shanks, Berger, Freeman and Dickinson1981). The declining phase of lactation is characterized by a decrease in number of secretory cells (Knight & Wilde Reference Knight and Wilde1993; Tucker Reference Tucker1987) and reduced milk yield, having a marked effect on persistency of the curve after peak yield has been achieved. The decline in secretory cell number is represented by the specific rate of cell death parameter λ. An increase in λ with increased parity is observed for cattle (Table 8) and sheep (Table 10), but not for goats (Table 9), confirming theory and practice that persistency of an animal's lactation decreases with increased parity as death rate λ increases as well. Other authors have observed no significant effect of parity on parameters describing the evolution of lactation to peak, whereas there was a highly significant effect of parity on the decay coefficient (Friggens et al. Reference Friggens, Emmans and Veerkamp1999; Hansen et al. Reference Hansen, Friggens and Højsgaard2006). On comparing the λ values across species, there was a clear difference between goats and sheep (relatively high λ) and cattle (low λ), consistent with the differences in length of lactation across these species.
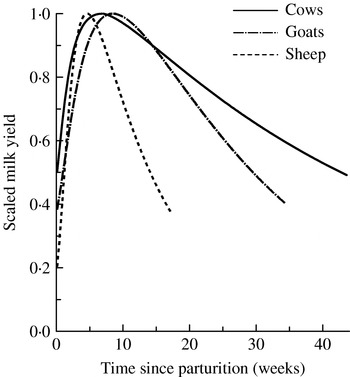
Aiming at comparing the milking potential of the dairy breeds used in the current study, an average lactation curve was obtained for each species (Fig. 4) by scaling the predicted yields so that each curve peaks at a value of unity. This indicates the superior milking potential, on a relative scale, of the Holstein Friesian cow over the goat and sheep breeds used in the current study, which could be attributed to inherent qualities, or improved production characteristics through advances in breeding and better nutritional supplementation of diets. Dietary changes (Goodwill et al. Reference Goodwill, Jessop and Oldham1996), oxytocin (Nostrand et al. Reference Nostrand, Galton, Erb and Bauman1991) and/or bovine somatotropin (bST) (Knight et al. Reference Knight, Fowler and Wilde1990) treatments and frequency of milking (Wilde et al. Reference Wilde, Henderson, Knight, Blatchford, Faulkner and Vernon1987) have been observed to affect the mammary gland cell number, but whether such responses are caused by changes in proliferation rate or in death rate is not immediately clear. Since proliferation and death rate parameters are estimated using the mechanistic model, this offers an opportunity to analyse responses due to treatments within and across species. The use of such parameters is essential in mechanistic models that, unlike requirement-based current empirical feed evaluation systems, aim at predicting the responses of animals to dietary changes (Dijkstra et al. Reference Dijkstra, Kebreab, Mills, Pellikaan, López, Bannink and France2007).
Plot of average lactation curve for each species (cattle, goats and sheep) scaled to give a peak value of unity.

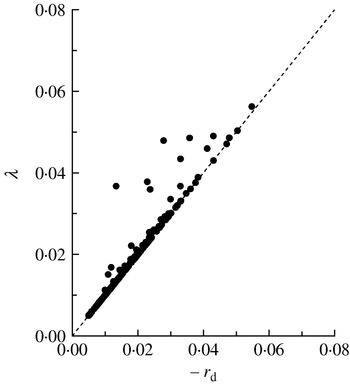
From analysis of the parameter estimates of the three species, it became apparent that the parameter r d, as a measure of the rate of decline of yield after peak, is highly correlated with parameter λ, as illustrated by the relationship between variables derived from the 176 lactations (Fig. 5):

where s.e. is standard error of the estimate.
Relationship between the relative rate of decline midway between peak lactation and the end of lactation (r d) and the cell death rate parameter λ from the mechanistic model (Eqn 2) for each of the 176 cow lactation curves, with the λ=−r d shown as dashed line and linear fit with intercept=−0·0002 (s.e. 0·0005), slope=1·06 (s.e. 0·02), R 2=0·925 (s.e. is standard error of the estimate).

The reason is that the calculated value of r d is approximately equal to the negative value of the specific rate of cell death parameter λ, except when the decay parameter k is very small (k<0·1) (Tables 5, 6 and 7 and Fig. 5). As this occurs so infrequently, it is sufficient to use the magnitude of λ as a general measure of the persistency of lactation in all cases.
In conclusion, the mechanistic model of Dijkstra et al. (Reference Dijkstra, France, Dhanoa, Maas, Hanigan, Rook and Beever1997) provided feasible lactation parameter estimates on application to recorded data, enabling variation in these parameters to be identified and lactation performance across species and lactations within species to be examined. The model was found to provide a better fit to cow data than the widely used model of Wood (Reference Wood1967) with residuals demonstrating more randomness, although a restrictive number of pre-peak observations will limit the accuracy of fit of the mechanistic model compared with Wood's equation. Conversely, with an adequate number of data points or for the average milk curve of a group of animals, the mechanistic model resulted in a significantly better fit. Plausible biological interpretation of the parameters of the mechanistic model makes them of value in constructing mechanistic whole animal models that predict the partitioning of nutrients between body components and milk production and the composition of the milk.
The work was funded, in part, by the Canada Research Chairs Program.