INTRODUCTION
Croplands are potential sinks of atmospheric CO2 through sequestration of soil organic carbon (SOC), which can both enhance crop production (Fan et al. Reference Fan, Stewart, Wang, Luo and Zhou2005) and mitigate greenhouse gas emissions (Post & Kwon Reference Post and Kwon2000). With rising atmospheric levels of carbon dioxide (CO2) and global warming, SOC sequestration is gaining increasing attention (Melillo et al. Reference Melillo, Setudler, Aber, Newkirk, Lux, Bowles, Catricala, Magill, Ahrens and Morrisseau2002; Lal Reference Lal2004a ; Trumbore & Czimczik Reference Trumbore and Czimczik2008). It has been estimated that global soil carbon (C) is 3·3 times the size of the atmospheric C pool and 4·5 times the size of the biotic C pool (Lal Reference Lal2004a ). As a main component of the terrestrial ecosystem, agro-ecosystems play an important role in controlling atmospheric CO2 concentration through C exchange between croplands and atmosphere (Lal Reference Lal2004b ). Therefore, quantifying the potential of cropland soils to accumulate and sequester SOC will help to evaluate the contribution of cropland soils as a source or sink in the global C balance (Liang et al. Reference Liang, Yang, Zhang, McLaughlin, Shen and Li2009).
Previous observations have shown that agricultural management regimes, such as tillage (Clapp et al. Reference Clapp, Allmaras, Layese, Linden and Dowdy2000; Six et al. Reference Six, Elliott and Paustian2000a ), fertilization (Rudrappa et al. Reference Rudrappa, Purakayastha, Singh and Bhadraray2006; Huang et al. Reference Huang, Rui, Peng, Huang and Zhang2010; Li et al. Reference Li, Liu, Wu, Han and Zhang2010), crop residue recycling (Allmaras et al. Reference Allmaras, Linden and Clapp2004; Blair et al. Reference Blair, Faulkner, Till, Korschens and Schulz2006), crop rotation (Madari et al. Reference Madari, Machado, Torres, De Andrade and Valencia2005; Kou et al. Reference Kou, Zhu, Huang, Peng, Song, Deng, Gao, Peng and Zhang2012) and land fallowing (Huggins et al. Reference Huggins, Buyanovsky, Wagner, Brown, Darmody, Peck, Lesoing, Vanotti and Bundy1998; Nair et al. Reference Nair, Kumar and Nair2009) have significant impacts on SOC storage. Among these management practices, fertilizer application has a big impact on SOC sequestration and cycling. For example, Li et al. (Reference Li, Liu, Wu, Han and Zhang2010) found that SOC sequestration rate was highly correlated with input of organic C such as straw and manure. Fertilizer application also increases dry matter production, which enhances crop residue return to the soil and subsequently increases soil organic matter levels (Liang et al. Reference Liang, MacKenzie, Schnitzer, Monreal, Voroney and Beyaert1998). Furthermore, fertilization practices affect soil biological properties that may control SOC decomposition and transformation. For example, Kanchikerimath & Singh (Reference Kanchikerimath and Singh2001) observed that balancing inorganic and manure application increased soil microbial activities and consequently enhanced SOC sequestration by promoting C turnover.
Fertilizer application greatly influences soil aggregation, which may exert physical protection for SOC, thus controlling its decomposition and transformation (Six et al. Reference Six, Paustian, Elliott and Combrink2000b ; Jastrow et al. Reference Jastrow, Amonette and Bailey2007). For example, Hassink (Reference Hassink1997) reported that SOC associated with aggregates from the smaller-sized fraction improves protection against decomposition. Huang et al. (Reference Huang, Rui, Peng, Huang and Zhang2010) also found that long-term fertilizer application could increase soil aggregate stability and SOC sequestration under a continuous rice cropping system. Thus, examining the impacts of fertilization practices on soil aggregates and associated C dynamics will enhance understanding of the mechanisms underlying SOC sequestration and protection. Many studies have been conducted on the effects of fertilization practices on organic C fractions in the paddy fields of subtropical areas (Yuan et al. Reference Yuan, Li, Huang, Hu and Pan2004; Yan et al. Reference Yan, Wang and Yang2007; Huang et al. Reference Huang, Rui, Peng, Huang and Zhang2010; Sun et al. Reference Sun, Huang, Yu and Zhang2013), but little attention was paid to the responses and dynamics of aggregate-associated C to the fertilizer application in cool high-latitude rainfed areas.
Northeast China, a typical cool high-latitude rainfed cropping area, is one of the most important grain production regions in China. The crop sown area and production in Northeast China account for 12 and 16% of the total cropping area and production in China, respectively (Liu et al. Reference Liu, Wang, Zhang, Song, Li, Li, Li and Duan2006). The black soil (Mollisol) of the region, composing one of the three largest Mollisol areas in the world, is characterized by high organic matter content and fertility (Liu et al. Reference Liu, Han, Song, Herbert and Xing2003). However, long-term continuous maize cropping in combination with improper fertilization management has resulted in a loss of C and associated yield suppression in this region (Liu et al. Reference Liu, Han, Song, Herbert and Xing2003). Liang et al. (Reference Liang, Yang, Zhang, McLaughlin, Shen and Li2009) reported that the SOC content in cultivated soils was 39·9% lower than uncultivated soils within the region. This gap in C concentrations suggests a large potential for using best agricultural management practices to increase soil C sequestration (Huggins et al. Reference Huggins, Buyanovsky, Wagner, Brown, Darmody, Peck, Lesoing, Vanotti and Bundy1998). Long-term fertilization experiments provide a good opportunity for investigating soil C storage and distribution among different aggregate fractions. Therefore, the main objective of the present study was to assess the impact of long-term fertilization on SOC content, soil aggregation and responses of SOC fractions in the black soil of Northeast China.
MATERIALS AND METHODS
Experimental site
The fertilization experiment with monoculture maize was initiated in 1989 at the National Long-term Location Monitoring Base on Black Soil Fertility and Fertilizer Efficiency, Gongzhuling (43°30′N, 124°48′E, 220 m asl), Jilin Province, China. This region is in the North temperate zone with a continental monsoon climate (cold and arid in winter, hot and rainy in summer). Annual precipitation is 562 mm with almost 80% occurring in June–September, and annual average temperature and sunshine duration are 5·6 °C and 2710 h, respectively. Prior to the experiment, the field was under cereal production for at least 50 years with relatively uniform soil fertility. The soil is classified as Thermo Black Soil in Chinese classification, Haplic Phaeozem in FAO–UNESCO classification, and Cumulic Hapludoll (Mollisol) according to the US classification (Kou et al. Reference Kou, Zhu, Huang, Peng, Song, Deng, Gao, Peng and Zhang2012). Soil sampled in 1989 contained 13·2 g SOC/kg, 1·4 g total N/kg, 0·6 g total P/kg, 18·4 g total K/kg, 114·0 mg available N/kg, 11·8 mg available P/kg and 158·3 mg available K/kg, with an initial pH of 7·6.
Experimental design
The experiment included five treatments: (1) fallow system as a natural succession field without any fertilizer or pesticide application (FAL), (2) unfertilized control, (3) balanced inorganic fertilizers at the rate of 165 kg N/ha, 82·5 kg P2O5/ha and 82·5 kg K2O/ha, respectively (NPK), (4) balanced inorganic fertilizers at the rate of 112 kg N/ha, 82·5 kg P2O5/ha and 82·5 kg K2O/ha plus maize straw residue on the soil surface at the rate of 7·5×103 kg/ha (SNPK) and (5) balanced inorganic fertilizers at the rate of 50 kg N/ha, 82·5 kg P2O5/ha and 82·5 kg K2O/ha plus farmyard manure at the rate of 23 t/ha (MNPK).
The C : N ratio of maize straw and farmyard manure in dry matter was c. 66 : 1 and 26 : 1, respectively. In addition, the N concentrations in maize straw and farmyard manure were c. 7·0 and 5·0 g/kg, respectively. Hence, the total N application for NPK, SNPK and MNPK was at the rate of 165 kg/ha each. The treatments were arranged in a randomized complete block design with three replicates. The area of each plot was 130 m2. Maize was planted in early May and harvested in late September. Seeds were sown at a density of 5·05×104 plant/ha maintaining a spacing of 0·60 m×0·33 m. Seeding was done manually in the ridge at 0·05 m depth of soil after land preparation followed by basal application of fertilizers. The source of inorganic N, P and K fertilizers were urea, triple super phosphate and muriate of potash, respectively. One-third of urea and all of the triple super phosphate and muriate of potash were applied as a basal dose during final land preparation. The remaining two-thirds of urea was used as a top-dressing at the maize jointing (V6) stage (Hanway Reference Hanway1963) and the chopped maize straw was also applied on the surface in the SNPK plots each year at that time. The farmyard manure was applied in the autumn each year, after the maize was harvested. The land was manually weeded at 15-day intervals during the maize growing season. Pesticides were sprayed to control pests and diseases in all the plots when required.
Soil sampling and analysis
Soils were sampled using a soil auger after the maize harvest in early October 2011. The samples were collected from six randomly selected sampling points at 0·2 m intervals from 0–1·0 m depth for each plot. The six sub-samples at each plot and depth class were combined to obtain one composite sample for each depth per plot. Field-moist soil samples were passed through an 8-mm sieve by gently breaking up the soil; samples were then air-dried and mixed thoroughly. All samples were stored at room temperature before analysis. Four aggregate-size classes, i.e. large- (>2000), macro- (250–2000), micro- (53–250) and silt+clay sized fraction (<53 μm) were separated according to Six et al. (Reference Six, Callewaert, Lenders, De Gryze, Morris, Gregorich, Paul and Paustian2002a ) by wet-sieving the soil through a series of three sieves as adopted by Huang et al. (Reference Huang, Rui, Peng, Huang and Zhang2010) and Kou et al. (Reference Kou, Zhu, Huang, Peng, Song, Deng, Gao, Peng and Zhang2012). The overall procedure yielded water-stable, large-, macro-, micro- and silt+clay sized fraction aggregates. Concentrations of C and total N in different aggregate-size class samples were measured with an elemental analyser (Elementar, Vario Max, Germany). Soil bulk density in the 0–0·2 m soil depth was determined on an oven-dry basis by the core method (Blake & Hartge Reference Blake, Hartge and Klute1986). Six soil cores were taken randomly between rows from 0·05 to 0·15 m soil depth for each plot. Then undisturbed soil samples were obtained to measure the soil bulk density.
Calculations
The C concentration for different soil layers was calculated as:
 $$C = \sum\limits_{n = 1}^i {(AC_i \times FW_i} )$$
where C refers to the total C concentration for a given depth within the soil profile (g/kg), AC is the aggregate-associated C for different size classes (g/kg), FW is the fraction weight of each aggregate-size, and n is the number of size fractions. The total N concentration for different soil layers was calculated as:
 $$TN = \sum\limits_{n = 1}^i {(AN_i \times FW_i} )$$
where TN refers to the total N concentration for a given depth within the soil profile (g/kg) and AN is the aggregate associated total N for different size classes (g/kg). The C sequestration in each size class in the topsoil (i.e. 0–0·2 m soil depth) was calculated as:
 $$C_{{\rm sequestration}} = AC \times BD \times d \times FW$$
where C sequestration refers to C sequestration in each size class (Mg/ha), BD is the soil bulk density (Mg/m3) and d is the depth of soil profile (i.e. 0·2 m). The total C sequestration in the topsoil (i.e. 0–0·2 m soil depth) is the sum of the C stored in different sizes of aggregates.
Statistical analysis
Linear regression analysis was used to test relationships between SOC content and soil profile depth. Statistically significant differences were identified by one-way ANOVA and the least significant difference (LSD) at a significance level of P<0·05 was used to identify differences between treatment means. All statistical analyses were conducted using SPSS software 13.0 (SPSS Inc, Chicago, IL, USA).
RESULTS
Distribution of soil organic carbon and total nitrogen in the soil profile
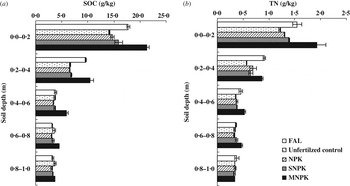
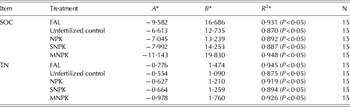
The distribution of SOC concentrations within 0–1·0 m soil depth showed a similar trend for all treatments (Fig. 1 a). Soil organic C content was highest in the topsoil (0–0·2 m), and then decreased rapidly with soil depth. The relationship between SOC and soil depth followed a logarithmic equation (Table 1). In the topsoil layer, SOC content in MNPK, FAL and SNPK was significantly (P<0·05) higher than that in the unfertilized control by 50·7, 25·6 and 12·4%, respectively, whereas no significant difference was found between the unfertilized control and NPK. In the subsoil (0·2–0·4 m) layer, SOC contents in MNPK and FAL were significantly (P<0·05) higher than for the unfertilized control, NPK and SNPK, but no significant differences were observed among the unfertilized control, NPK and SNPK treatments. In the 0·4–0·6 m and 0·6–0·8 m layers, MNPK had the highest SOC content among the treatments. In the 0·8–1·0 m layer, there were no significant differences in SOC concentration among the treatments. The SOC concentrations in MNPK, FAL and SNPK treatments increased significantly (P<0·05) by 61·0, 34·1 and 20·1%, respectively, compared to their initial level (i.e. 13·2 g/kg) in 1989 in the topsoil. However, no significant increasing trends in SOC concentrations were found in the unfertilized control and NPK treatments over the period of 1989–2011.
Soil organic carbon (SOC) and total nitrogen (TN) contents in top 1·0 m soil under different fertilization treatments. (a) SOC; (b) TN. FAL, fallow system; NPK, balanced inorganic N, P, K fertilizers; SNPK, balanced inorganic fertilizers plus maize straw residues; MNPK, balanced inorganic fertilizers plus farmyard manure. Bars represent mean ±1 S.E.

Parameters of logarithm–linear relationship between SOC and TN with soil depth under different treatments

* A and B are the parameters of logarithm–linear regression, R 2 is the coefficient of determination.
FAL, Fallow system; NPK, balanced inorganic N, P, K fertilizers; SNPK, balanced inorganic fertilizers plus maize straw residues; MNPK, balanced inorganic fertilizers plus farmyard manure.
The distribution of total nitrogen (TN) content also showed a similar trend within the 0–1·0 m soil profile for all treatments (Fig. 1 b and Table 1). However, TN concentrations showed higher increments in the same soil depth compared to SOC increases among treatments. For example, TN content in MNPK, FAL and SNPK was significantly (P<0·05) higher than that in the unfertilized control, by 59·0, 27·7 and 14·9%, respectively, in the 0–0·2 m soil profile. Moreover, the contents of TN in FAL, MNPK and SNPK in the 0·2–0·4 m soil profile were also higher than those in the unfertilized control, by 60·6, 53·0 and 14·1%, respectively. In the topsoil layer, TN concentrations in MNPK and FAL increased significantly (P<0·05) by 37·4 and 10·4% compared to their initial level (i.e. 1·4 g/kg) in 1989, whereas no significant increasing trends were found in the unfertilized control, NPK or SNPK treatments.
Distribution of soil aggregates in the topsoil
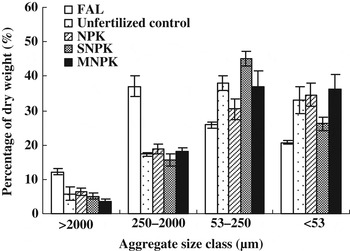
The distribution of soil aggregate fraction-size classes in the topsoil was significantly different among treatments (Fig. 2). The fractions of large- and macro-aggregates in FAL were significantly (P<0·05) higher than in the unfertilized control, NPK, SNPK and MNPK, whereas the fractions of micro- and silt+clay aggregates (<53 μm) in FAL were significantly (P<0·05) lower than in other treatments. There were no significant differences in aggregate-size distribution among the unfertilized control, NPK, SNPK and MNPK treatments, except for the higher fraction of micro-aggregates and lower fraction of silt+clay aggregates in SNPK. The proportion of aggregates >250 μm was similar and not significantly different to the proportion of aggregates<250 μm in the FAL treatment. However, the proportion of aggregates <250 μm in the unfertilized control, NPK, SNPK and MNPK treatments, ranging from 65·0 to 71·3%, was significantly (P<0·05) higher than the proportion of aggregates >250 μm.
Soil aggregate distribution in the topsoil (0–0·2 m) under different treatments. FAL, fallow system; NPK, balanced inorganic N, P, K fertilizers; SNPK, balanced inorganic fertilizers plus maize straw residues; MNPK, balanced inorganic fertilizers plus farmyard manure. Bars represent mean ±1 S.E.

Aggregate-associated soil organic carbon
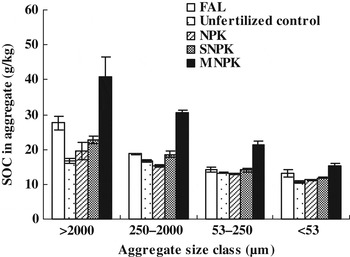
Among all size classes, the MNPK treatment had the highest (P<0·05) SOC concentration of all treatments in the topsoil, followed by FAL and SNPK (Fig. 3). There were no significant differences in SOC concentration between the unfertilized control and NPK in any of the aggregate classes. Generally, as the aggregate size decreased, the associated C concentration decreased correspondingly in all the treatments.
Distributions of aggregate associated SOC in topsoil (0–0·2 m) under different treatments. FAL, fallow system; NPK, balanced inorganic N, P, K fertilizers; SNPK, balanced inorganic fertilizers plus maize straw residues; MNPK, balanced inorganic fertilizers plus farmyard manure. Bars represent mean ±1 S.E.

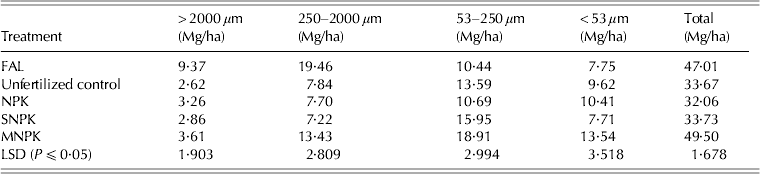
The SOC stock allocation in different aggregate size classes was different among treatments (Table 2). The associated C in FAL was concentrated mainly on the macro-aggregate fraction, which accounted for 41·4% of total SOC stock, followed by micro-, large- and silt+clay aggregate associated SOC with the values of 22·2, 19·9 and 16·5%, respectively. However, the SOC stock in the unfertilized control, NPK, SNPK and MNPK treatments were higher in the micro-aggregate fraction, which accounted for 33·4–47·3% of total SOC sequestration, followed by silt+clay- and macro-aggregate associated SOC with the values of 22·8–37·5% and 21·4–27·1%, respectively. Moreover, SOC stock associated with large-sized aggregate was significantly (P<0·05) lower compared to other size classes in the unfertilized control, NPK, SNPK and MNPK treatments. Consequently, the SOC stock in large- and macro-aggregate size classes was significantly (P<0·05) higher in FAL than in the unfertilized control, NPK, SNPK and MNPK treatments. Furthermore, the MNPK treatment had higher C stock associated with macro-, micro- and silt+clay aggregate compared to the unfertilized control, NPK and SNPK treatments. In addition, aggregate associated C sequestration was not significantly different among the unfertilized control, NPK and SNPK for all aggregate classes.
Aggregate soil organic carbon sequestration in the topsoil (0–0·2 m) under different fertilization treatments

FAL, fallow system; NPK, balanced inorganic N, P, K fertilizers; SNPK, balanced inorganic fertilizers plus maize straw residues; MNPK, balanced inorganic fertilizers plus farmyard manure.
DISCUSSION
After 23 years of cropping, significant increases in SOC levels were found in the FAL, MNPK and SNPK treatments as compared with their original SOC levels, whereas no significant increase was found in the unfertilized control and NPK treatments. This suggests that good practices of fertilizer application can significantly enhance SOC concentration in Northeast China. Before starting the experiment, the area was cultivated for several decades, which resulted in an initial rapid loss of SOC before reaching a relatively steady-state (Yang et al. Reference Yang, Zhang, Fang, Zhu, Ren and Wang2003). Furthermore, the removal of ground biomass and reliance only on the native soil fertility, or using only inorganic fertilizers, lead to lower annual C input compared to that in the FAL treatment (Huggins et al. Reference Huggins, Buyanovsky, Wagner, Brown, Darmody, Peck, Lesoing, Vanotti and Bundy1998). Consequently, under these circumstances the balance between C input and decomposition rate maintained the consistent SOC content in the unfertilized control and NPK treatments (Saggar et al. Reference Saggar, Yeates and Shepherd2001). In contrast, organic manure amendments or straw incorporation with inorganic fertilizers (e.g. MNPK and SNPK treatments) had a positive effect on organic C that significantly increased SOC content. Similar results have been observed in continuous maize cropping with organic manure application in rainfed areas (Fan et al. Reference Fan, Stewart, Wang, Luo and Zhou2005; Zhu et al. Reference Zhu, Ren, Wang, Zhang, Yang and MacTavish2007). The increasing trend of C content in soils could be explained by the amount of C input. Firstly, soil mineralization rate is usually stable, thus the rate of SOC change is directly related to C input from organic amendments (Hassink Reference Hassink1995; Jastrow et al. Reference Jastrow, Amonette and Bailey2007). The higher amount of organic matter input in MNPK and SNPK treatments promoted SOC concentration in the soil (Li et al. Reference Li, Liu, Wu, Han and Zhang2010). Secondly, the average maize yields over the experimental duration in MNPK and SNPK treatments (9180 and 9050 kg/ha, respectively) were significantly higher than in the unfertilized control (3584 kg/ha), consequently providing higher amounts of root residues and exudates in the soil (Gregorich et al. Reference Gregorich, Monreal and Ellert1995; Yang et al. Reference Yang, Zhang, Fang, Zhu, Ren and Wang2003; Fan et al. Reference Fan, Stewart, Wang, Luo and Zhou2005). Therefore, higher organic matter and root biomass and exudation input in MNPK and SNPK treatments contributed to the increases in C content in the soil (Gregorich et al. Reference Gregorich, Monreal and Ellert1995). In addition, straw incorporation concentrated less C in the soil compared to the MNPK treatment, which might have resulted from low soil temperature and moisture in this region, which restricted straw mineralization (Guo & Lin Reference Guo and Lin2001; Ogle et al. Reference Ogle, Breidt and Paustian2005). Generally, soil organic C and total N cycling are linked (Huang et al. Reference Huang, Rui, Peng, Huang and Zhang2010), thus, similar effects of fertilization on total soil N content and distribution were found in this long-term experiment. This supports the findings in the present study. Furthermore, the SOC content logarithmically decreased with soil depth in all treatments, which suggests that SOC was concentrated mainly in the upper soil layer.
Soil aggregates are the basis for forming good soil structure as well as for providing physical protection for SOC (Six et al. Reference Six, Elliott and Paustian2000a ; Whalen & Chang Reference Whalen and Chang2002; Kou et al. Reference Kou, Zhu, Huang, Peng, Song, Deng, Gao, Peng and Zhang2012). In the present study, large- (>2000 μm) and macro-aggregates (250–2000 μm) were dominant in the FAL treatment whereas micro- (53–250 μm) and silt+clay aggregates (<53 μm) were dominant in the cultivated treatments at 0–0·2 m soil depth. This suggests that the soil structure was disturbed by continuous maize monoculture. Cropping practices lead to larger aggregate breakdown into smaller aggregates (Plante & McGill Reference Plante and McGill2002); thus, micro- and silt+clay aggregates are dominant in cropland soils (Six et al. Reference Six, Elliott and Paustian2000a ; Liang et al. Reference Liang, Yang, Zhang, McLaughlin, Shen and Li2009). This was confirmed in the present study. However, higher organic C contents that were noticed in the smaller aggregates in a Kaokinitic soil (Beare et al. Reference Beare, Hendrix and Coleman1994) and Lexington soil (Six et al. Reference Six, Paustian, Elliott and Combrink2000b ) suggest that cultivation leads a loss of C-rich macro-aggregates and a gain of C-rich micro-aggregates.
Moreover, the SOC storage in smaller-sized aggregates has a slower turnover rate than in the larger-sized aggregates, which helps to explain the higher stability of SOC in properly managed cropping systems (Hassink Reference Hassink1997; Liang et al. Reference Liang, Yang, Zhang, McLaughlin, Shen and Li2009). Furthermore, the present study showed that the application of manure increased C stock associated with macro-, micro- and silt+clay aggregates compared to other treatments. This result was consistent with Huang et al. (Reference Huang, Rui, Peng, Huang and Zhang2010), who found that organic amendments increased the C stock in micro-aggregates in paddy soils. The higher SOC sequestration in small-sized aggregates in the MNPK treatment indicates that SOC can be physically protected and reduces the turnover rate (Six et al. Reference Six, Conant, Paul and Paustian2002b ). Therefore, the MNPK treatment not only increased the SOC sequestration but also promoted the stable SOC storage due to organic manure application (Six et al. Reference Six, Elliott and Paustian2000a ; Kou et al. Reference Kou, Zhu, Huang, Peng, Song, Deng, Gao, Peng and Zhang2012).
In general, though long-term farmland FAL could enhance topsoil SOC sequestration, fertility management under continuous maize cropping also had a positive effect on SOC accumulation in a black soil in Northeast China. The present study demonstrates that maize monoculture with balanced inorganic fertilizers plus farmyard manure application can enhance the total SOC sequestration due to higher aggregate-associated C in the macro-, micro- and silt+clay aggregate. Furthermore, the enhancement of SOC depends on both improvement of soil physical structure and the increment of organic matter input caused by fertilization practices. Therefore continuous maize cropping with farmyard manure amendment is beneficial in increasing SOC sequestration and reducing C turnover rate in the black soil of Northeast China.
This research was supported by Chinese National Basic Research Programme (2009CB118601), National Natural Science Foundation of China (31000693), the National Key Technology Support Programme of China (2011BAD16B14) and the Innovation Project of Chinese Academy of Agricultural Sciences. We also thank Dr. Richard L Snyder from University of California, Davis, who helped to improve the manuscript.