Implications
Dairy production has an impact on global warming. Clinical mastitis, an intramammary infection, reduces productivity of dairy cows. Improvements in the health of cows may benefit production efficiency, and therefore reduce greenhouse gas emissions per unit of product. Greenhouse gas emissions of cows with clinical mastitis increase on average by 6.2% compared with cows without clinical mastitis. This increase is caused by removal of cows (39%), discarded milk (38%), reduced milk production (17%) and prolonged calving interval (6%). Preventing clinical mastitis can reduce greenhouse gas emissions and contribute to sustainable development of the dairy sector.
Introduction
One of the most urgent environmental issues is global warming, induced by greenhouse gas (GHG) emissions (Steffen et al., Reference Steffen, Richardson, Rockström, Cornell, Fetzer, Bennett, Biggs, Carpenter, de Vries, de Wit, Folke, Gerten, Heinke, Mace, Persson, Ramanathan, Reyers and Sörlin2015). The livestock sector is responsible for about 14.5% of the anthropogenic GHG emissions globally (Gerber et al., Reference Gerber, Steinfeld, Henderson, Mottet, Opio, Dijkman, Falcucci and Tempio2013), of which 30% is emitted by the dairy sector. Important GHGs related to milk production are carbon dioxide (CO2), methane (CH4) and nitrous oxide (N2O). Emissions of GHGs are mainly emitted during feed production, enteric fermentation of feed and manure management. The increasing attention for global warming is likely to contribute to the introduction of policies or other incentives to reduce GHG emissions related to livestock production, including dairy. A common method to asses GHG emissions and the impact of mitigation options is life cycle assessment (LCA) that takes into account the entire life cycle of a product (Baumann and Tillmann, Reference Baumann and Tillmann2004). Many studies have used LCA to estimate GHG emissions of milk production, by summing emissions of GHGs along the production chain. Several studies investigated mitigation options (e.g. breeding or feeding) to reduce GHG emissions in the dairy sector (Van Middelaar et al., Reference Van Middelaar, Dijkstra, Berentsen and De Boer2014a and Reference Van Middelaar, Berentsen, Dijkstra, van Arendonk and de Boer2014b). Little attention, however, has been given to the impact of health of dairy cows on GHG emissions. Williams et al. (Reference Williams, Chatterton, Hateley, Curwen and Elliott2015) estimated the impact of 10 endemic cattle diseases, Özkan Gülzari et al. (Reference Özkan Gülzari, Vosough Ahmadi and Stott2018) the impact of subclinical mastitis (subCM), Mostert et al. (Reference Mostert, van Middelaar, Bokkers and de Boer2018b and Reference Mostert, van Middelaar, de Boer and Bokkers2018c) the impact of subclinical ketosis and foot lesions, and Chen et al. (Reference Chen, White and Holden2016) the impact of lameness on GHG emissions. Whereas some strategies to reduce GHG emissions can result in reduced income (Van Middelaar et al., Reference Van Middelaar, Dijkstra, Berentsen and De Boer2014a) or reduced welfare (Llonch et al., Reference Llonch, Haskell, Dewhurst and Turner2017), strategies to improve health of dairy cows might benefit the welfare of the animal, farm profitability (Hogeveen et al., Reference Hogeveen, Huijps and Lam2011) and the environment (Williams et al., Reference Williams, Chatterton, Hateley, Curwen and Elliott2015) simultaneously.
Clinical mastitis (CM), an inflammatory process in the mammary gland (IDF, 1987), is one of the most frequent diseases in dairy cows (Seegers et al., Reference Seegers, Fourichon and Beaudeau2003). Clinical mastitis can reoccur in the same lactation and across lactations due to several pathogens, which can be classified as gram-positive bacteria (e.g. Streptococcus spp), gram-negative bacteria (e.g. E. coli) or other organisms (Schukken et al., Reference Schukken, Hertl, Bar, Bennett, González, Rauch, Santisteban, Schulte, Tauer, Welcome and Gröhn2009). Dairy cows with CM express illness behavior after an infection (Fogsgaard et al., Reference Fogsgaard, Røntved, Sørensen and Herskin2012) and, therefore, their welfare is considered to be impaired. In addition, CM has a negative impact on production. Clinical mastitis results in reduced milk production (Schukken et al., Reference Schukken, Hertl, Bar, Bennett, González, Rauch, Santisteban, Schulte, Tauer, Welcome and Gröhn2009), and fertility (Hertl et al., Reference Hertl, Schukken, Welcome, Tauer and Gröhn2014), impairs milk quality, and increases culling and mortality of cows (Hertl et al., Reference Hertl, Schukken, Bar, Bennett, González, Rauch, Welcome, Tauer and Gröhn2011). These effects depend on the severity and pathogen type causing CM. The impact of CM on production affects farm profitability. Additional costs because of CM are estimated between €61 and €97 on average per cow per year (Hogeveen et al., Reference Hogeveen, Huijps and Lam2011) and $134, $211 and $95 per case of, respectively, gram-positive, gram-negative and other organisms (Cha et al., Reference Cha, Bar, Hertl, Tauer, Bennett, González, Schukken, Welcome and Gröhn2011).
Besides the negative impact of CM on farm profitability and on the welfare of cows, CM could also affect GHG emissions of milk production. The negative impact of CM on production reduces, for example, the feed efficiency (kg milk/kg feed intake) of the cow and therefore will increase the GHG emissions per unit of product produced. Hospido and Sonesson (Reference Hospido and Sonesson2005) estimated the impact of CM on GHG emissions in Galician dairy herds. This scenario study of Hospido and Sonesson (Reference Hospido and Sonesson2005), however, did not simulate the dynamics of CM per parity (e.g. pathogen type, recurrent case of CM and related losses) and did not show the variation in production losses of CM and in emissions of GHGs. Including these aspects will provide a better understanding of the impact of CM on GHG emissions.
Our objective was to estimate the impact of CM on GHG emissions per unit of product, including all processes from cradle to farm gate for the Dutch situation. By using a dynamic stochastic simulation model on cow level that includes several parities, different pathogens and frequency of occurrence of CM in one lactation, and by performing sensitivity analyses, our study can give new insights in the impact of CM on GHG emissions for Dutch dairy farmers.
Material and methods
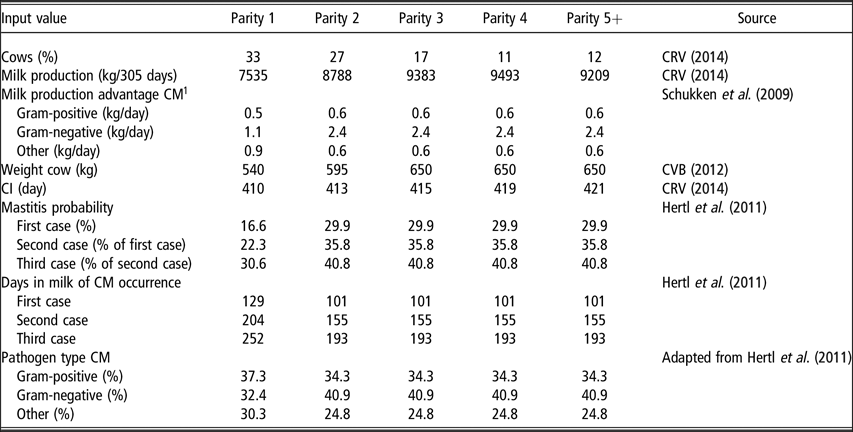
A dynamic stochastic simulation model was developed in R (R_Core_Team, 2016) and combined with LCA to estimate the impact of CM on GHG emissions per unit of product. First, the model simulated the dynamics and losses of CM for one lactation. Second, GHG emissions were calculated by using an LCA. Input of general production parameters in the first part and the estimation of GHG emissions in the second part were the same as in Mostert et al. (Reference Mostert, van Middelaar, Bokkers and de Boer2018b and Reference Mostert, van Middelaar, de Boer and Bokkers2018c) that estimated the impact of subclinical ketosis and foot lesions on GHG emissions. The analysis was performed for a predefined Dutch dairy farm (100 dairy cows) applying limited grazing (8 h/day, 170 days/year), which is a common strategy on commercial dairy farms in the Netherlands (Centraal Bureau voor de Statistiek (CBS), 2014). All input values in the model were based on literature (Tables 1 and 2). The model was run with 100 000 iterations.
Milk production, weight, CI and probabilities of CM of dairy cows per parity

CM=clinical mastitis; CI=calving interval.
Part of the table reprinted from Mostert et al. (Reference Mostert, Bokkers, Van Middelaar, Hogeveen and De Boer2018a and Reference Mostert, van Middelaar, de Boer and Bokkers2018c) with permission from Elsevier and Cambridge University Press.
1 Cows with CM had a higher potential milk production. The potential milk production of cows with CM was estimated by including the milk advantage which depended on the type of pathogen of CM at the first case to the milk production.
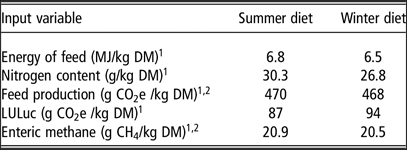
Greenhouse gas emissions of feed production and LULuc, enteric methane emissions, and energy and nitrogen content of summer and winter diet of dairy cows

LULuc=land use and land use change.
Table reprinted from Mostert et al. (Reference Mostert, van Middelaar, de Boer and Bokkers2018c) with permission from Elsevier.
1 Vellinga et al. (Reference Vellinga, Blonk, Marinussen, Van Zeist and De Boer2013).
2 CO2e=carbon dioxide equivalent; CH4=methane.
Dynamics and losses of clinical mastitis
Each cow received a parity (1 to 5+), based on the average herd composition in the Netherlands (International Dutch cattle improvement co-operative (CRV), 2014). Based on the parity, cows received a milk production, BW and a calving interval (CI) (Centraal Veevoederbureau (CVB), 2012; CRV, 2014). The CI consisted of a lactation period (350 to 361 days) and a dry period (60 days) (Table 1).
Based on the parity, cows had a risk of CM. After a first case of CM, cows had a risk of a second case, and a risk of a third case in the same lactation (Table 1). Pathogens causing CM were classified as gram-positive, gram-negative or other to estimate the impact of different pathogens (Hertl et al., Reference Hertl, Schukken, Bar, Bennett, González, Rauch, Welcome, Tauer and Gröhn2011). In total, 39 combinations of pathogen types after one, two and three cases of CM per parity were possible. A case of a specific CM pathogen was assumed to be not protective for a recurrent case of the same pathogen (Cha et al., Reference Cha, Hertl, Schukken, Tauer, Welcome and Gröhn2016). The day of occurrence of the three cases of CM was fixed in the model and was based on the median of the days of occurrence of CM as found by Hertl et al. (Reference Hertl, Schukken, Bar, Bennett, González, Rauch, Welcome, Tauer and Gröhn2011) (Table 1). A lactation curve was utilized to estimate the average daily milk production per cow based on weekly milk records (Wood, Reference Wood1967). To estimate the impact of CM on milk production, we estimated the difference between the potential and actual milk production of a cow with CM. Potential milk production per cow per lactation was based on average milk production of Dutch dairy cows (CRV, 2014). Cows with CM were assumed to have a higher potential milk production (Schukken et al., Reference Schukken, Hertl, Bar, Bennett, González, Rauch, Santisteban, Schulte, Tauer, Welcome and Gröhn2009). Their production, therefore, was adapted by adding the daily higher milk production found by Schukken et al. (Reference Schukken, Hertl, Bar, Bennett, González, Rauch, Santisteban, Schulte, Tauer, Welcome and Gröhn2009) to the average milk production (Table 1). Reduced milk production resulting from CM was based on the study of Schukken et al. (Reference Schukken, Hertl, Bar, Bennett, González, Rauch, Santisteban, Schulte, Tauer, Welcome and Gröhn2009) and depended on parity, type of pathogen and number of cases of CM. Reduced milk production and type of pathogen causing CM were based on data from studies of the USA (Schukken et al., Reference Schukken, Hertl, Bar, Bennett, González, Rauch, Santisteban, Schulte, Tauer, Welcome and Gröhn2009; Hertl et al., Reference Hertl, Schukken, Bar, Bennett, González, Rauch, Welcome, Tauer and Gröhn2011), because no detailed data about this were available for a Dutch situation. Cows affected by any pathogen type were treated for 3 days with antibiotic, and milk was discarded for 6 days (van Soest et al., Reference van Soest, Santman-Berends, Lam and Hogeveen2016). It was assumed that pathogen identification was not performed by the farmer and that the cows received a broad spectrum antibiotic.
Cows with CM and without CM could be culled or could die (Hertl et al., Reference Hertl, Schukken, Bar, Bennett, González, Rauch, Welcome, Tauer and Gröhn2011). When a cow is culled, the cow is shipped off the farm and can be slaughtered (the cow has a rest value due to the meat). When a cow dies, the cow dies or is euthanized on the farm (the meat has no rest value). Based on parity and type of pathogen, cows with CM had a monthly increased risk of culling and dying, together called removal, compared to cows without CM (Hertl et al., Reference Hertl, Schukken, Bar, Bennett, González, Rauch, Welcome, Tauer and Gröhn2011). Cows removed because of this increased risk were assumed to be removed because of CM, whereas other removals were for other reasons than CM. No differentiations were made between voluntary and involuntary culling, and for other reasons of removal. To avoid a confounding effect of pregnancy status on the culling decision, there was no risk of removal after month 10 (Bar et al., Reference Bar, Gröhn, Bennett, González, Hertl, Schulte, Tauer, Welcome and Schukken2008). Removed cows were replaced by an average healthy heifer. To account for the impact on fertility, cows with CM had a prolonged CI of 4 weeks, based on the average impact found by Santos et al. (Reference Santos, Cerri, Ballou, Higginbotham and Kirk2004) and Wilson et al. (Reference Wilson, Grohn, Bennett, González, Schukken and Spatz2008). Because of data limitations, milk production losses and removal were assumed to be not affected by the severity of CM. The discrete events on getting CM and removal were simulated by drawing random numbers from uniform distributions. The uniform distributions make it possible to assign cows to different categories (e.g. gram-positive, gram-negative, other, or no CM).
Calculation of greenhouse gas emissions
An LCA was performed to estimate the impact of CM on GHG emissions as described in Mostert et al. (Reference Mostert, van Middelaar, Bokkers and de Boer2018b and Reference Mostert, van Middelaar, de Boer and Bokkers2018c). Emissions of CO2, CH4 and N2O were estimated from cradle to farm gate for processes along the milk production chain that are affected by CM. Processes included were feed production, enteric fermentation and manure management. Emissions related to the production of antibiotics were assumed to be minor and, therefore, were excluded. Emissions of GHGs were estimated for cows with and without CM, and were expressed as kg CO2 equivalents (CO2e) per ton of fat-and-protein-corrected milk (FPCM). Different GHGs were summed up based on their equivalent factor: 1 for CO2, 28 for biogenic CH4, 30 for fossil CH4 and 265 for N2O (100-year time horizon) (Myhre et al., Reference Myhre, Shindell, Bréon, Collins, Fuglestvedt, Huang, Lamarque, Lee, Mendoza, Nakajima, Robock, Stephens, Takemura, Zhang, Stocker, Qin, Plattner, Tignor, Allen, Boschung, Nauels, Xia, Bex and Midgley2013). The impact of CM on GHG emissions was the difference in emissions per kg FPCM between a cow without (potential production) and with (actual production) CM. To gain insight in the largest contributors, the impact of CM on GHG emissions was analyzed per process (feed production, enteric fermentation, manure management), per parity, per production contributor (reduced milk production, discarded milk, prolonged CI, removal) and per pathogen combination. The last analysis was based on 100 000 cows with CM to increase the number of cows with multiple cases of CM. This reduced the uncertainty to less than 1% on total emissions per combination of pathogens. The estimation of GHG emissions is described in detail in Mostert et al. (Reference Mostert, van Middelaar, Bokkers and de Boer2018b) and, therefore, only briefly described below.
Based on national statistics of the Netherlands, a summer (170 days/year) and winter diet (195 days/year) were composed (CBS, 2014). Feed ingredients included concentrates and roughage (grass, grass silage, maize silage) (Supplementary Tables S1 and S2). Feed intake (kg DM/ cow) was estimated based on the energy content of the diet and the energy requirements of the cow. These energy requirements for maintenance, milk production and pregnancy, and energy requirements for growth (in case of parity 1 and 2) were estimated per day (CVB, 2012). Energy requirement for maintenance was assumed to be 6.7% higher in summer than in winter because of grazing (CVB, 2012). The energy requirements for maintenance were assumed to be the same for cows with or without a disease, while the energy requirement for milk production changed with a change in milk yield. As a result, cows with CM were found to have a lower feed efficiency and a higher energy requirement per ton of FPCM produced.
Emissions of GHGs related to feed production were based on Vellinga et al. (Reference Vellinga, Blonk, Marinussen, Van Zeist and De Boer2013) (Table 2). Processes included were the production of inputs (e.g. fertilizers, pesticides, machinery, energy), cultivation and harvesting of the crops (including fertilizer application), processing and drying of feed ingredients and transport between processing steps up to the farm gate (Supplementary Tables S2 and S3). In addition to the processes described above, emissions related to land use (Lu) and land use change (Luc) also were included (Vellinga et al., Reference Vellinga, Blonk, Marinussen, Van Zeist and De Boer2013). Emissions from enteric fermentation were based on Vellinga et al. (Reference Vellinga, Blonk, Marinussen, Van Zeist and De Boer2013). Emissions from manure were estimated according to IPCC (Reference Eggleston, Buendia, Miwa, Ngara and Tanabe2006) and emissions factors were based on national inventory reports. Nitrogen (N) excretion, which was used to calculate N emissions from manure management, was estimated based on N intake of the cow, N retention in milk and in growth of the cow and calf. Direct N2O emissions (De Vries et al., Reference De Vries, Hoeksma and Groenestein2011; Vonk et al., Reference Vonk, Bannink, van Bruggen, Groenestein, Huijsmans, van der Kolk, Luesink, Oude Voshaar, van der Sluis and Velthof2016), indirect N2O emissions (i.e. N2O derived from volatilization of ammonia (NH3) and nitrogen oxides (NOx) and from leaching of nitrate (NO3−)) (De Vries et al., Reference De Vries, Hoeksma and Groenestein2011; Velthof and Mosquera, Reference Velthof and Mosquera2011; Vonk et al., Reference Vonk, Bannink, van Bruggen, Groenestein, Huijsmans, van der Kolk, Luesink, Oude Voshaar, van der Sluis and Velthof2016) and CH4 emissions (De Mol and Hilhorst, Reference De Mol and Hilhorst2003) from manure in stables and storage, and from manure deposited during grazing were included. More details about emission factors can be found in Supplementary Table S4.
System expansion was applied to account for the production of meat from calves and cows. Consequences of meat production in terms of GHG emissions were based on the so-called avoided-burden method (Guinée et al., Reference Guinée, Gorrée, Heijungs, Huppes, Kleijn, de Koning, van Oers, Wegener Sleeswijk, Suh, Udo de Haes, de Bruijn, van Duin, Huijbregts, Lindeijer, Roorda, van der Ven and Weidema2002). This method assumes that meat from cows replaces alternative products on the market, and therefore subtracts GHG emissions related to the production of those avoided products from the emissions related to dairy production. The impact of removal of cows and calves on GHG emissions was based on Mostert et al. (Reference Mostert, van Middelaar, Bokkers and de Boer2018b). Cows that were removed before the end of parity 5 were assumed to be removed too early, resulting in rearing extra heifers. This increases emissions related to non-productive animals. Additional emissions because of removal were estimated as the difference between the emissions of rearing a heifer and the avoided burden of the meat production from that cow. Subsequently, this difference was depreciated over the age of the cow, resulting in a lower impact of removal from older cows (Mostert et al., Reference Mostert, van Middelaar, Bokkers and de Boer2018b).
Sensitivity analysis
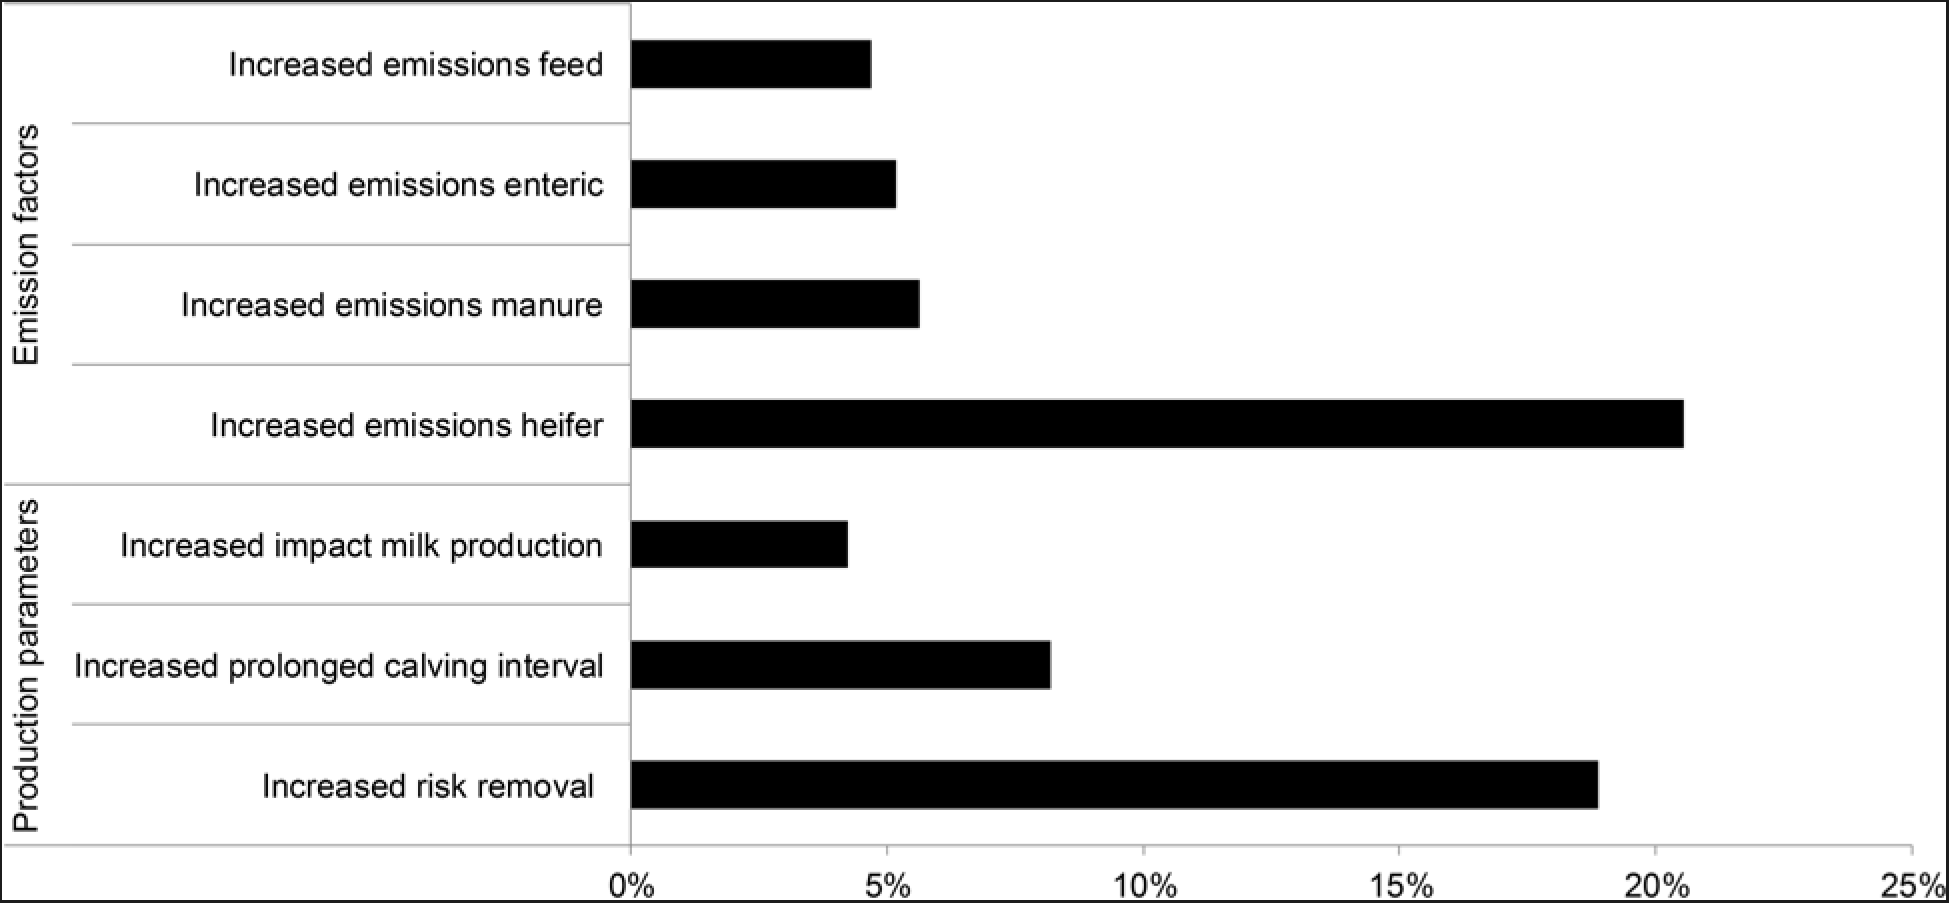
Sensitivity analyses were performed to analyze the impact of changes in production parameters and in GHG emission factors as described in Mostert et al. (Reference Mostert, van Middelaar, Bokkers and de Boer2018b and Reference Mostert, van Middelaar, de Boer and Bokkers2018c). Results of changes were compared with results of the reference situation (Tables 1 and 2). Input parameters were adjusted based on the variation found in literature and analyzed separately. The impact of CM on milk production was doubled (Increased impact milk production) (Seegers et al., Reference Seegers, Fourichon and Beaudeau2003). The risk of removal resulting from CM was increased by 50% (Increased risk removal) (Seegers et al., Reference Seegers, Fourichon and Beaudeau2003). The prolonged CI was increased from 28 days to 56 days (Increased prolonged CI) (Ahmadzadeh et al., Reference Ahmadzadeh, Frago, Shafii, Dalton, Price and McGuire2009).
The impact of changes in GHG emission factors were analyzed to assess the impact of the GHG emission factors that were used and to assess the potential impact of differences in feeding strategy, feed composition and manure management between farms. Based on variation found in literature, the most important emission factors were changed. Emissions related to the production of feed were changed by ± 25% (Emissions feed) (Van Middelaar et al., Reference Van Middelaar, Cederberg, Vellinga, Van Der Werf and De Boer2013). Emissions related to enteric fermentation were changed by ± 20% (Emissions enteric) (IPCC, Reference Eggleston, Buendia, Miwa, Ngara and Tanabe2006). Emissions related to rearing a heifer were changed by ± 25% (Emissions heifer). Emissions of CH4 and N2O related to manure storage and grazing were changed by ± 100% (Emissions manure) (Olivier et al., Reference Olivier, Brandes and te Molder2009).
Results
Impact of clinical mastitis on greenhouse gas emissions
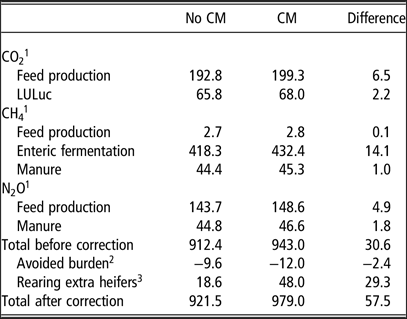
Emissions of cows with CM increased on average by 57.5 (6.2%) kg CO2e/t FPCM compared with cows without CM, with a range between 17.6 and 173.6 (5 to 95 percentiles) kg CO2e/t FPCM. Emissions related to feed production and enteric fermentation contributed most to the total emissions (Table 3). With regard to the production parameters, the increase in GHG emissions per case of CM was caused by removal (39%), discarded milk (38%), reduced milk production (17%) and prolonged CI (6%) (Table 4).
Average GHG emissions per ton fat-and-protein-corrected milk (kg CO2e/t FPCM) of dairy cows with no CM, and dairy cows with CM, and the average difference related to feed production, enteric methane, LULuc, manure, avoided burden and rearing extra heifers

GHG=greenhouse gas; CM=clinical mastitis; LULuc=land use and land use change.
1 CO2=carbon dioxide; CH4=methane; N2O=nitrous oxide.
2 Emissions are corrected for meat production of the cows based on system expansion. Meat from cows replaces alternative products on the market, and therefore the GHG emissions of meat from cows is equal to the GHG emissions of the alternative product.
3 Additional emissions because cows are removed too early resulting in additional GHG emissions for rearing extra replacement heifers.
Average increase of GHG emissions per ton fat-and-protein-corrected milk (kg CO2e/t FPCM) per parity due to CM (5 to 95 percentiles) in dairy cows related to reduced milk production, discarded milk, prolonged CI, removal and avoided burden

GHG=greenhouse gas; CM=clinical mastitis; CI=calving interval.
1 A weighted average for all parities was taken which was based on the composition of an average Dutch dairy herd.
2 Emissions are corrected for meat production of the cows based on system expansion. Meat from cows replaces alternative products on the market, and therefore the GHG emissions of meat from cows are equal to the GHG emissions of the alternative product.
The increase in GHG emissions of cows with CM compared with cows without CM varied from 75 (33 to 204) kg CO2e/t FPCM to 34 (15 to 60) kg CO2e/t FPCM in parities 1 and 5, respectively. In the months after the first case of CM, 40% of cows with CM were removed, whereas in the same period 17% of cows without CM were removed. Clinical mastitis reduced the milk production of cows that were not removed on average by 4.5%.
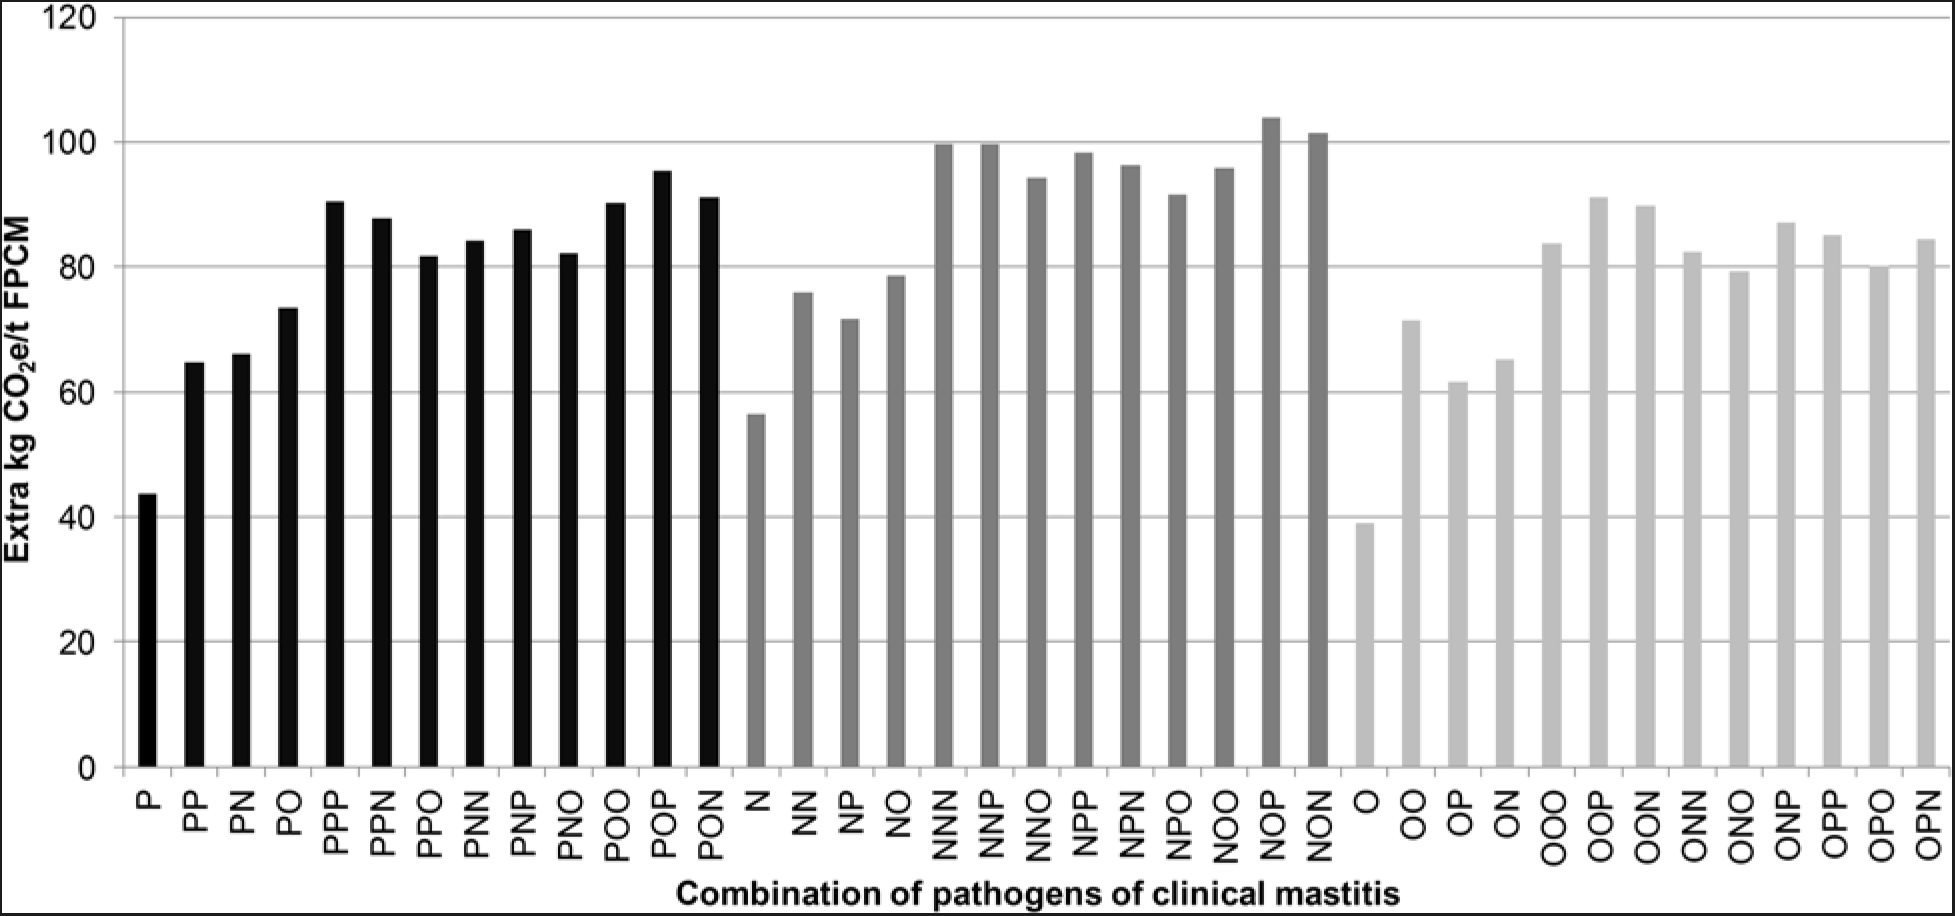
The increase in GHG emissions was 48 kg CO2e/t FPCM for cows with one case of CM, 69 kg CO2e/t FPCM for cows with two cases of CM and 92 kg CO2e/t FPCM for cows with three cases of CM compared with cows without CM (Figure 1). The increase in GHG emissions of cows with CM compared with cows without CM varied between the type of pathogens and was highest if the first case of CM was gram-negative (average of dark grey bars: 65 kg CO2e/t FPCM), followed by gram-positive (average of black bars: 54 kg CO2e/t FPCM) and other (average of light grey bars: 51 kg CO2e/t FPCM). The increase in GHG emissions of cows with CM compared with cows without CM was highest when cows died because of CM (322 kg CO2e/t FPCM) and when cows were culled because of CM (115 kg CO2e/t FPCM).
Average increase of GHG emissions per ton fat-and-protein-corrected milk (kg CO2e/t FPCM) of CM in dairy cows per type of pathogen; gram-positive (P), gram-negative (N) or other (O), and the combinations up to three cases. GHG=greenhouse gas; CM=clinical mastitis.

Sensitivity analysis
Results of the effect of a change in emission factors and production parameters on the impact of CM on CO2e/t FPCM are shown in Figure 2, relative to the reference situation (%). The two parameters related to removal had the highest impact. Increasing the removal risk of cows with CM increased the GHG emissions by 19%, whereas increasing the emissions of rearing a heifer increased the emissions by 21%. Increasing prolonged CI increased GHG emissions by 8%, whereas doubling the impact of CM on milk production increased GHG emissions by 4%. A decrease in emissions related to production of feed, enteric fermentation, and manure storage and grazing resulted in a similar but opposite effect.
Results from the sensitivity analyses showing the effect (%) of a change in input parameters of emission factors and production parameters on the impact of CM in dairy cows on GHG emissions per ton fat-and-protein-corrected milk (kg CO2e/t FPCM) compared to the reference situation. GHG=greenhouse gas; CM=clinical mastitis.

Discussion
The relationship between animal health and GHG emissions has been estimated only in a few studies. In the UK, two studies showed that reduced animal health increased the GHG emissions per unit of product (Williams et al., Reference Williams, Chatterton, Hateley, Curwen and Elliott2015; Bell and Wilson, Reference Bell and Wilson2018). Other studies analyzed the impact per type of disease. Mostert et al. (Reference Mostert, van Middelaar, Bokkers and de Boer2018b and Reference Mostert, van Middelaar, de Boer and Bokkers2018c) estimated that GHG emissions of dairy cows with subclinical ketosis increased by 2.3% and with foot lesions by 1.5% compared with cows without these diseases. Chen et al. (Reference Chen, White and Holden2016) showed that lameness in dairy cows can increase GHG emissions at the farm level up to 7.8%, and Özkan Gülzari et al. (Reference Özkan Gülzari, Vosough Ahmadi and Stott2018) showed that reducing somatic cell count from 800 000 cells/ml to 50 000 cells/ml potentially can reduce farm GHG emissions intensity by 3.7%. Using a scenario study, Hospido and Sonesson (Reference Hospido and Sonesson2005) showed that reducing subCM by 18% and CM by 7% reduced GHG emissions by 2.5% at herd level. In our study, we estimated that preventing a case of CM can reduce GHG emissions of a dairy cow by 6.2%. On herd level in our study, with an incidence of 27% of one case of CM, GHG emissions increased by 1.7% (16 kg CO2e/t FPCM). Several differences in input and type of model to estimate the impact of (clinical) mastitis on GHG emissions exist between our study and the study of Hospido and Sonesson (Reference Hospido and Sonesson2005). We discuss two major differences. First, we did not include subCM, because no data were available about the relation between CM and subCM. We, therefore, found a lower GHG impact than Hospido and Sonesson (Reference Hospido and Sonesson2005). Second, the reduction of subCM and CM in the study of Hospido and Sonesson (Reference Hospido and Sonesson2005) resulted in a high increase in milk production. In our study, mastitis resulted in an average milk production loss of 4.5%. Literature showed that CM results in an average milk production loss of 5% (375 kg) over a full lactation (Seegers et al., Reference Seegers, Fourichon and Beaudeau2003), whereas in the improved situation (14 cows less affected by CM or subCM) in the study of Hospido and Sonesson (Reference Hospido and Sonesson2005) milk production losses were reduced by more than 30 000 kg. The higher milk production losses in the study of Hospido and Sonesson resulted in a higher impact of mastitis on GHG emissions than in our study.
Literature shows differences in losses in milk production, removal and fertility as a result of CM (Seegers et al., Reference Seegers, Fourichon and Beaudeau2003). Milk production losses and type of pathogen causing CM were based on data from studies of the USA (Schukken et al., Reference Schukken, Hertl, Bar, Bennett, González, Rauch, Santisteban, Schulte, Tauer, Welcome and Gröhn2009; Hertl et al., Reference Hertl, Schukken, Bar, Bennett, González, Rauch, Welcome, Tauer and Gröhn2011). In our model, we assumed that a recurrent case of a pathogen and related milk production losses were the same for the Dutch situation, although these cows have a lower potential milk production. It is unknown if the magnitude of loss depends on the production level of the cow (Seegers et al., Reference Seegers, Fourichon and Beaudeau2003). Milk production losses in our study were similar compared with milk production losses (5%) of other modeling studies of CM (Raboisson et al., Reference Raboisson, Mounié and Maigné2014; van Soest et al., Reference van Soest, Santman-Berends, Lam and Hogeveen2016). These studies based their milk production losses of CM on Seegers et al. (Reference Seegers, Fourichon and Beaudeau2003). Therefore, using USA data about milk production losses for the Dutch situation might have had a minor impact on the results.
Removal of cows is farm specific and has varied between literature studies. Removal was the most important contributor (39%) to the impact of CM on GHG emissions. Rearing heifers has a relatively high environmental impact as those animals contribute to GHG emissions for 2 years without producing milk. So far, however, no specific removal models exist to estimate the impact of removal per cow on GHG emissions. Therefore we applied a method to estimate the impact of removal on GHG emissions that is also used in economic estimations. This method of removal and related assumptions are described in Mostert et al. (Reference Mostert, van Middelaar, Bokkers and de Boer2018b). Sensitivity analyses showed that GHG emissions for rearing a new heifer and removal risk had an important impact on the results. These two aspects can result in high variation between farms.
Prolonged CI was used to estimate the impact of fertility on GHG emissions and this had the lowest contribution to the total impact of CM. In our model, the impact of CM on fertility was simplified, because we did not have the data to include a detailed fertility model. The impact of fertility on, for example, removal was excluded because of lack of data. Including these removals will increase GHG emissions. Garnsworthy (Reference Garnsworthy2004) showed that improving UK fertility levels to ideal levels could reduce the proportion of total methane emissions from replacement heifers by 15%. It was assumed that type of pathogen did not influence fertility. Type of pathogen, parity and time of CM occurrence before or after artificial insemination, however, can have an impact on the probability of conception (Hertl et al., Reference Hertl, Gröhn, Leach, Bar, Bennett, González, Rauch, Welcome, Tauer and Schukken2010). Gram-negative bacteria have in general a higher effect on probability of conception than gram-positive bacteria or other pathogens. The impact of gram-negative combinations, therefore, might have been underestimated. Including a more detailed fertility model can improve the estimation of GHG emissions for specific pathogen combinations.
High variation was found between the impact of different pathogens on GHG emissions. The impact on milk production and removal for different combinations of pathogens was included. Treatment, however, was equal for all pathogens, because it was assumed that farmers, in general, are not aware of the type of pathogen and therefore use a broad spectrum antibiotic. Including a specific treatment per pathogen might reduce disease duration and production losses, and therefore reduce the impact of CM on GHG emissions. Moreover, CM can increase the risk of other diseases and vice versa (Gröhn et al., Reference Gröhn, Rajala-Schultz, Allore, DeLorenzo, Hertl and Galligan2003). No data were available to include the interactions of other diseases with recurrent cases of CM per parity and the impact of this on milk production, removal and fertility. Not being able to include these interactions with other diseases might have led to an over- or underestimation of the results.
Current incentives to reduce CM in dairy cows aim to increase the income of the farmer and to improve animal welfare and will become even more relevant when policies to reduce GHG emissions are implemented for the livestock sector. Targets of maximum GHG emissions can be set per type of dairy farming system (e.g. conventional, organic) for getting a premium. Reducing CM can contribute to a reduction of GHG emissions in the livestock sector. Preventive measures to reduce CM can be management practices (e.g. washing dirty udders and the use of milkers’ gloves), treatment of subCM, or vaccination. These preventive measures can be cost-effective (Hogeveen et al., Reference Hogeveen, Huijps and Lam2011; Kessels et al., Reference Kessels, Cha, Johnson, Welcome, Kristensen and Gröhn2016), but the impact of these strategies on GHG emissions and other environmental impact categories has not been estimated. Therefore, strategies to reduce CM should also be analyzed from an environmental perspective. Incidence of CM ranges from 2% to 82% on dairy farms in the Netherlands (van Soest et al., Reference van Soest, Santman-Berends, Lam and Hogeveen2016). Therefore, results from our study show that farms with a high incidence of CM have a high potential to reduce GHG emissions by reducing CM.
Several other strategies have been investigated to reduce GHG emissions in the dairy sector. Dietary supplements or drugs can reduce enteric CH4 emissions of dairy cows, but some might have a negative impact on cow welfare (Llonch et al., Reference Llonch, Haskell, Dewhurst and Turner2017). Preventing CM, however, can also improve the health and consequently welfare of dairy cows.
Meul et al. (Reference Meul, Van Middelaar, de Boer, Van Passel, Fremaut and Haesaert2014) showed that the most important contributors (in units per kg FPCM) to GHG emissions of milk production were DM intake of the dairy cow and heifer, application of N from mineral fertilizer and manure, and amount (kg DM) of purchased concentrates and soybean meal. Preventing CM improves all these three aspects, because the efficiency of milk production increases. Moreover, preventing CM might be more effective for reducing GHG emissions than adopting a feeding strategy, such as dietary supplementation of extruded linseed or nitrate (9 to 32 kg CO2e/t FPCM) (Van Middelaar et al., Reference Van Middelaar, Dijkstra, Berentsen and De Boer2014a) or increasing milk yield by 698 kg/year per cow and longevity by 270 days per cow (27 and 23 kg CO2e/t FPCM) (Van Middelaar et al., Reference Van Middelaar, Berentsen, Dijkstra, van Arendonk and de Boer2014b). In addition, changing the feeding strategy can reduce GHG emissions of a dairy farm but does not always increase the income of the farmer (Van Middelaar et al., Reference Van Middelaar, Dijkstra, Berentsen and De Boer2014a). Whereas other strategies to reduce GHG emissions might result in a trade-off with another sustainability aspect (i.e. welfare, economics), preventing CM can increase the income of the farmer, can improve the welfare and longevity of the dairy cow and can reduce GHG emissions. Preventing CM, therefore, can be an effective strategy that can contribute to sustainable development of the dairy sector. The impact of CM on GHG emissions and other environmental aspects, however, will vary between farms due to environmental conditions (e.g. climate) and management practices (e.g. milk production, removal, feed and manure management). Therefore, specific farm analyses are needed to estimate the impact of that farm on GHG emissions. Measuring GHG emissions per farm might be difficult, but emission calculations in the model can be improved by using detailed information on farm management practices, including diet and herd composition. Model estimations could be further improved by more detailed data about milk losses, disease incidence, cause of removal, fertility, and the interactions between these factors.
Acknowledgements
None.
Declaration of interest
None.
Ethics statement
None.
Software and data repository resources
None of the data were deposited in an official repository.
Supplementary material
To view supplementary material for this article, please visit https://doi.org/10.1017/S1751731119001393.