In this paper, we investigate the plausibility of using surveys to assess one particularly important piece of political knowledge—the relative sizes of the parties in democratic legislatures. This knowledge is a crucial input into heuristics that allow voters to attribute responsibility for policy outputs, to estimate the likely policy consequences of different electoral outcomes and cabinet coalitions, and to anticipate which cabinets are likely to form (e.g., Fortunato and Stevenson Reference Fortunato and Stevenson2013; Duch, Przepiorka and Stevenson Reference Duch, Przepiorka and Stevenson2015; Fortunato and Stevenson Reference Fortunato and Stevenson2015). Knowledge of party sizes is essential to voters trying to make sense of the most important aspects of politics in modern democracies.
Despite its importance, there have been few previous efforts to produce survey questions tapping this knowledge. We have little accumulated knowledge of how to ask questions about what voters think the sizes of the parties are (or will be after an election). A search of 40 years of national election studies and cross-national survey projects in western democracies reveals only a handful of questions about perceptions of the sizes of the parties in the legislature. Further, all of these efforts focus on only a subset of parties and do not ask about exact sizes but only size orderings.Footnote 1
The almost complete lack of evidence about the typical respondent’s ability to answer detailed questions about party sizes has not, however, tempered many survey researchers’ strong opinions on the issue. Indeed, in several cases in which we tried to include detailed questions about voters’ perceptions of party sizes on election surveys managed by other scholars, the proposed questions were met with considerable skepticism. Respondents, the argument went, would not be able to answer the questions, would be frustrated by them, would answer haphazardly, and might simply drop out of the survey if forced to do so.Footnote 2 Given that such questions have essentially never been asked—despite the vast number of election surveys that have been conducted in the last 50 years—the conviction with which these views are held is surprising; but also intriguing. Are the skeptics correct? Is it possible to ask respondents in an election survey about the sizes (or the expected sizes) of a potentially large number of parties without frustrating them, taking too much survey time, causing them to drop out or to simply offer random responses? If they will answer, what are the formats that best minimize question difficulty and encourage thoughtful responses? In this paper, we use data from two original surveys to examine these questions.
METHODS
We rely on data from two original surveys we conducted before the most recent elections (2015) in Denmark and the United Kingdom.Footnote 3 These surveys asked respondents questions about their political interest, knowledge of current events, party positions, the identity of incumbent parties, and their expectations about the outcomes of the election—including the likely sizes of the parties. The last questions were asked in four different formats and respondents were randomized to each condition. The first condition varied whether or not the respondent was asked to provide legislative seat percentages or the actual number of seats. Specifically, the two question formats that captured this treatment were as follows (for the UK example):
Version 1 (seat number):
In the general election on May 7, voters will choose who will fill the 650 seats in the House of Commons. How many seats in the House of Commons do you think each of the following parties will win?
Your answer for each party must be a number between 0 and 650 and the sum of your answers must sum to 650. If you are uncertain please guess.
The total number of seats displayed will adjust automatically as you add or subtract seats to parties, so feel free to adjust your answers until you are happy with them (and they sum to 650).
Version 2 (seat percentage):
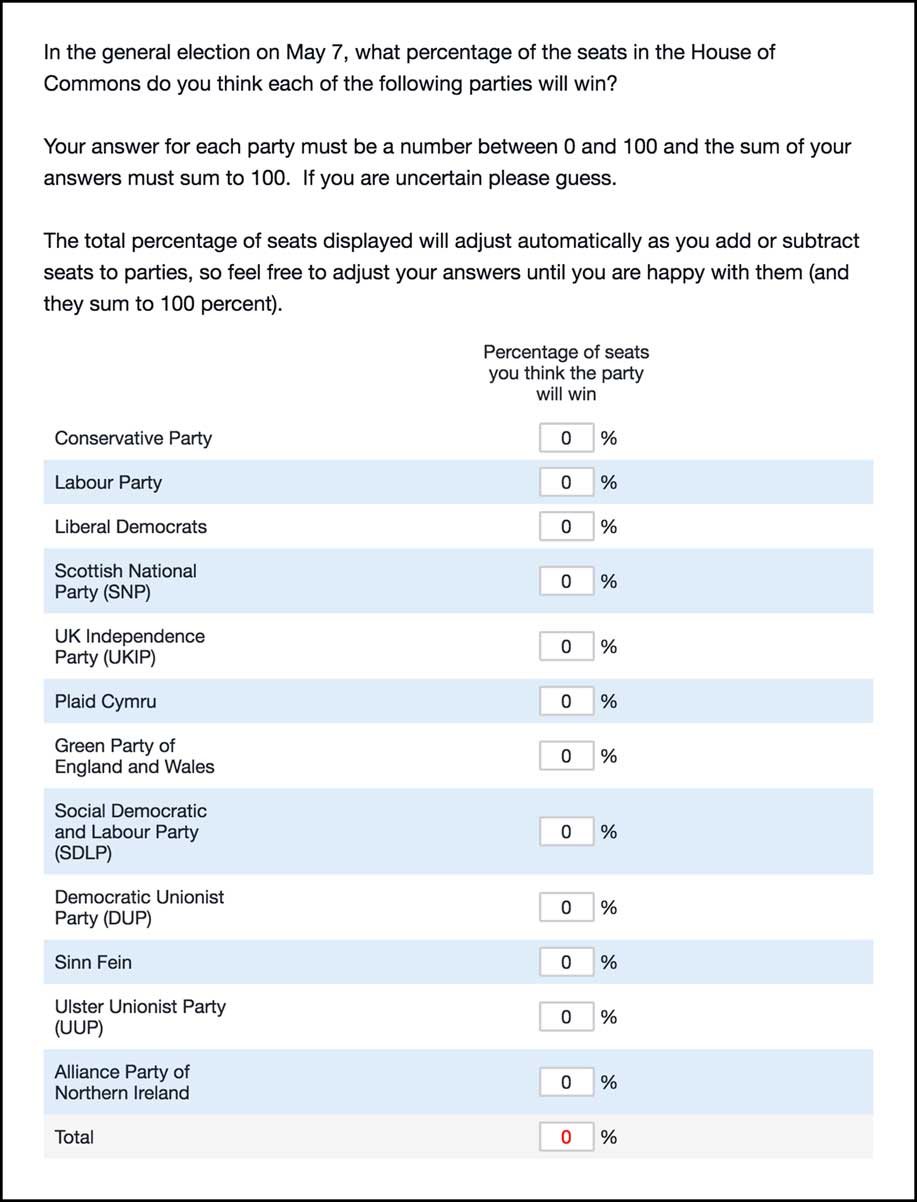
In the general election on May 7, what percentage of the seats in the House of Commons do you think each of the following parties will win?
Your answer for each party must be a number between 0 and 100 and the sum of your answers must sum to 100. If you are uncertain please guess.
The total percentage of seats displayed will adjust automatically as you add or subtract seats to parties, so feel free to adjust your answers until you are happy with them (and they sum to 100 percent).
Each of these questions was then followed by a list of parties as illustrated in Figure 1. In one condition, the order of the parties was fixed and in the other it was random. In the British case, the fixed order was as pictured in Figure 1, with the larger parties listed first. In the Danish case, the order listed the largest party (which was also the current PM) first, but altered the subsequent order so that government parties came first.
Example of the question for United Kingdom (percentage, fixed order)

RESULTS
We divide the rest of the paper into two sections, corresponding to the two main empirical questions. First, we ask whether the skeptics are right or wrong: Are respondents willing to answer this question? Do they do so thoughtfully? And, does the context (United Kingdom or Denmark) and/or the format of the question impact this at all?
Second, we ask to what extent our respondents’ perceptions of party sizes are accurate and whether question format matters to accuracy. To preview, we find that respondents have little trouble answering this question and do not seem to find it more difficult than other, more often used, questions. Further, we identify a very important effect of question format on accuracy that should be well understood if such questions are to be more widely applied.
Question 1: Are Respondents Willing to Answer the Questions?
As mentioned above, we have encountered considerable skepticism about the willingness of respondents to answer questions like those illustrated in Figure 1—a skepticism that appears to be reflected in the almost complete lack of such questions in the corpus of existing election surveys. Hence, the first questions we address are whether respondents are willing to answer the questions, and whether, when forced to do so, they become frustrated and either abandon the survey or downgrade their subsequent efforts (perhaps taking subsequent questions less seriously).
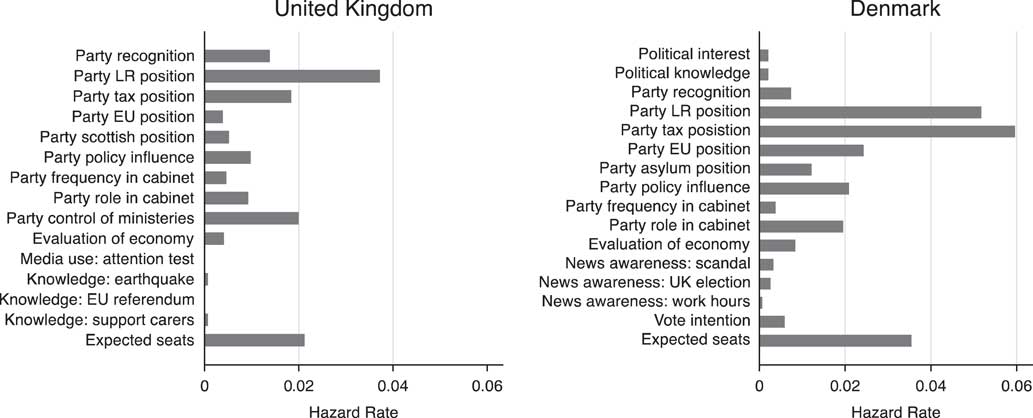
The most straightforward way to examine whether respondents were frustrated by the question is to ask how many abandoned the survey when confronted with it compared to other questions. This is slightly more complicated than just comparing raw numbers because different numbers of individuals saw each question—since at each question (other than the first) some individuals had previously dropped out. To handle this, we compare empirical hazard rates for each question, where the empirical hazard rate for a given question is simply the number of respondents who reached that question but did not answer it (and dropped out at that point).Footnote 4
Figure 2 gives the hazard rates for all the questions from the first until the question about party size in the Danish and UK surveys (see Online Appendix A for question wordings). First, in both surveys the question about expected seats is only the third highest hazard rate among the questions we asked. In both surveys, some of the highest hazard rates are for questions about each parties’ positions on specific policy issues and on a general left-right dimension—questions which have been asked in hundreds of election studies. Further, though the hazard rate for expected seat sizes is larger than for some other questions, the overall size of its hazard rates (and those for all the other questions) are quite low in absolute terms (about 4 percent of the Danish respondents who reached the seat size questions dropped out at that point).
Hazard rate for attrition by question: percent of respondents who reached the question but dropped out of the survey at that point Note: Questions are placed in order from first asked (top) to last asked (bottom). Hazard rates for questions shown after expected seats are not reported (this includes standard demographic questions). LR=left-right.

Of course, abandoning the survey is not the only way that a respondent who is frustrated by the question might choose not to cooperate with it. It could also be that respondents simply refused to engage with the question, while not abandoning the survey entirely. In our survey, however, we did not allow respondents to simply skip the question. We required respondents to answer the party size questions to continue with the survey and constrained the answers to their proper ranges and to sum to the correct amount (e.g., in the percentage condition, we required that respondents assign each party a number between 0 and 100 and that all their answers sum to 100).Footnote 5 Further, we explicitly encouraged respondents to guess if they had no idea.Footnote 6
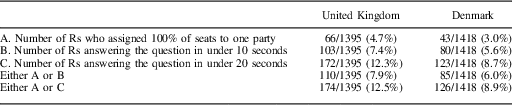
Consequently, the data do not provide an explicit answer for what percentage of respondents would have chosen to simply skip the question or that would have chosen “Don’t Know” (DK) for any individual party. That said, a respondent could still choose not to cooperate with the question either by abandoning the survey entirely or by providing non-serious answers. For example, the simplest such non-cooperative strategy (and requiring the fewest mouse clicks) would be to leave all parties at their default value of 0, except one—giving a single party 100 percent. Table 1 demonstrates how frequently our respondents appeared to resort to such strategies.
Apparent Non-Cooperation With the Question

While there are theoretically a large number of ways that respondents might not cooperate with the question—other than the one we have already noted (giving one party 100 percent)—there is little evidence of the widespread use of such strategies (see Online Appendix B). Further, the general pattern of responses is also our first indication of the overall reasonableness of our respondents’ answers (as being apparent in Online Appendix B, and explored more thoroughly in the next section). Especially in the UK case, we see that most respondents gave high shares to the two big parties and much smaller shares (and often 0) to others.Footnote 7
It is also the case that some of the individuals may appear to be non-cooperators because they answer very quickly or in a way that otherwise indicates a lack of engagement with the question. However, it is also possible that some of these respondents may fully understand the question and be willing to answer, but simply do not know the answer and so guess (as they were encouraged to do). These people should not “count” against the usefulness of the question in general. Indeed, part of the point of the question is to help identify the (proportion of) respondents who—even if they tried—simply could not answer accurately.
One way to get a sense of how many of our respondents fit into this category—the cooperative but unknowledgeable—is to identify whether the respondents who bailed out on the question are also generally unknowledgeable and unengaged in politics. If the question is simply a bad one (i.e., one that is too complicated or frustrating for the typical survey respondent), then we should see at least some individuals who bail out of the question despite performing well on other less complicated political knowledge questions. If instead, the individuals who bail out also know little about other aspects of politics, we will be more confident that it is because they really did not know the information rather than that they responded badly to the complexity or difficulty of the question.
To examine this, we utilize three “current events” questions. These questions asked about important events in the news that occurred in the days just before the survey was in the field (questions are in the Online Appendix A) and are shown previous to the party size questions. We use them to create a “habitual news reception” score for each respondent. The result, for example, is that of the 110 respondents who we identified as “non-cooperators” above (based on the criteria either A or B), only 14 respondents (12.7 percent of the non-cooperators and 1 percent of the overall sample) are in the top quarter of our habitual news reception scale.Footnote 8 This suggests that most of the 7.9 percent of non-cooperators who we identified are perhaps better classified as simply unknowledgeable in general than as being unwilling to answer the question because of its form.Footnote 9
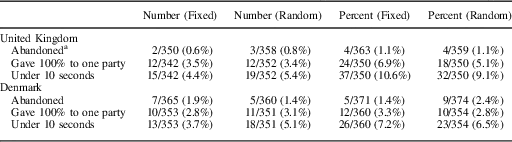
It is also of interest to examine whether the results above change when we ask the party size question in different ways (i.e., whether we asked about number or percentage of seats and whether we used a random or a fixed order of parties). This information is provided in Table 2.
Number of “Non-Cooperators” by Treatment

Note: Non-cooperators refer to those who assigned 100% of seats to one party or answering the question in less than 10 seconds (either A or B in Table 1). The difference in proportions for the number versus percentage cases is statistically significant at p<0.05 for those under 10 seconds (for both the United Kingdom and Denmark) and for those assigning 100% to one party for the United Kingdom.
a The denominator on this question (and similarly for Denmark) includes only individuals who started the survey and persisted long enough to be assigned to a treatment (and so see the seat question).
The proportion of respondents who appear not to cooperate with the question is somewhat smaller for the treatments that asked about numbers than percentages. While the differences are not large, they may reflect the often-noted difficulty that some individuals have interpreting information presented in percentage terms (Converse and Presser Reference Converse and Presser1986).
While the analysis so far has been concerned with identifying individuals who did not cooperate with the question in some way, we can also ask the more general question of whether the format of the question encouraged different levels of engagement for those who did appear to cooperate. We have two pieces of interrelated information that can shed light on this: timing data on how long it took each respondent to answer the question and data on the number of “clicks” he or she made while on the page. In our analysis, respondents were much more likely to adjust their initial answers when they answered the question with seat numbers than with percentages (see Online Appendix C and D). This may suggest more cognitive engagement in the activity when presented with the task of assigning seat numbers rather than percentages. This pattern is also consistent with the difference in the time it took respondents to complete the questions (see Online Appendix E). The median time to complete the question was 65 seconds in the percentage conditions and 100 seconds in the seat number conditions.Footnote 10 Likewise, these durations are highly correlated with the number of clicks (r=0.59), suggesting that the longer time was plausibly due to more active engagement with the question.
Question 2: Are Respondents Accurate?
Given that a large number of respondents seem willing to attempt a serious answer to the question and even to spend a significant amount of time honing their answers, we now turn to the question of how accurate they are. To assess accuracy, we compare our respondents’ expectations about each party’s legislative seat share to the average forecast of these shares during the same week that the surveys were in the field.Footnote 11
Instead of examining all the parties, it will be useful to initially focus on the largest parties in our two cases because these cases quite clearly illustrate a previously unknown measurement issue that appears to be critically important to the way such questions should be asked.
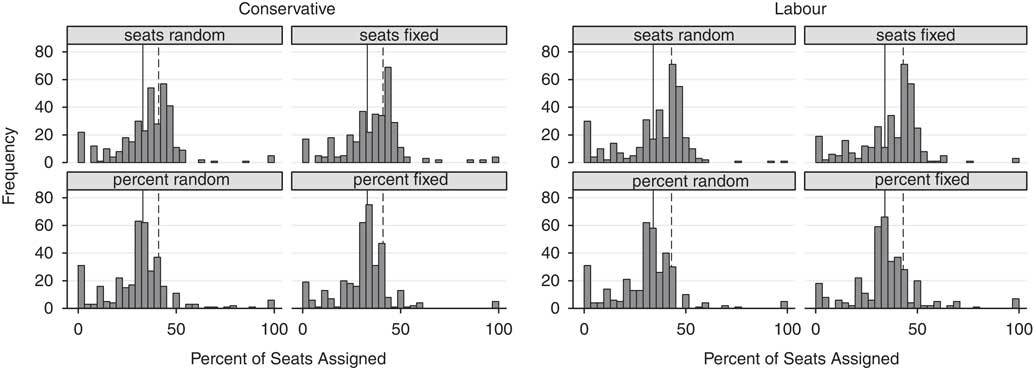
Figure 3 provides the relevant data for the Conservative and Labour parties in Britain for each of our four treatment conditions, with the dotted line indicating the correct seat share according to the average forecast available at the time of the survey. While respondents in the “seat numbers” condition provided answers as numbers of seats, to facilitate direct comparisons with the “seat percentages” condition, we have deterministically converted seat numbers to implied seat shares in these graphs.
Distribution of responses for Labour and Conservative Parties Note: Dashed line: polling average seat percentage; solid line: polling average vote percentage.Footnote 12

It is immediately apparent that the typical respondent reports very different party sizes between these two conditions. Specifically, the typical response of the respondents asked about expected numbers of seats is very close to the expected number of seats reported in the forecasts. In contrast, the response of the typical respondent asked about percentages of seats is shifted (incorrectly) to the left by almost 10 percentage points.
The likely source of this difference becomes clear when one adds to the graph the average forecasts from polls for vote shares (the solid lines) as well as those for seat shares. Specifically, the typical respondent who was asked about percentages of the parties’ seat shares clearly reported the values of the current polling about parties’ vote shares, while those asked about numbers of seats reported, on average, numbers of seats that translated to the correct seat shares.Footnote
Given the pervasiveness of information about parties’ likely shares of vote support in the weeks and days leading up to the election, it is not particularly surprising that respondents make this mistake. The typical respondent would have heard or read many reports of such percentages and thus such information may well have been readily available to them—and easily primed by our language of vote shares and percentages—when confronted with our question.Footnote 13
An even more intriguing result is that this mistake does not extend to those respondents who were asked to provide their expectations in terms of numbers of seats instead of percentages. First, it obviously suggests that these respondents did not form their expectations by starting from the same mistaken perception of seats shares as the other respondents. Had they done that, we would get the same leftward shift that we observed in the percentage condition. Consequently, it must be that these respondents were either calculating seat numbers from accurate information about seat shares or directly accessing information about seat numbers. Consider the plausibility of each possibility in turn.
Perhaps respondents had accurate information about likely seat percentages and then used that information to calculate and report seat numbers. We are skeptical of this possibility mainly because it does not explain why respondents in the “seat numbers” condition could accurately retrieve seat percentages from memory (previous to converting them to seat numbers) while not mixing them up with (the likely much more readily available) vote shares, while those in the “seat percentages” condition could not do so (instead substituting available information about vote shares for seat shares).Footnote 14
The second possibility is simply that voters have direct information about the expected seat numbers parties will obtain and report this directly when asked (completely avoiding the danger of the kind of mistaken substitution of vote support we see in the other condition). Our review of the reporting of poll information in the British press supports the idea that information about likely numbers of seats won by each party was readily available to voters, if not as easily as vote shares. Specifically, we found that in reporting the state of the horse race, stories tended to provide either no information about seat distributions or to report both vote shares and the implications of these shares for the number of seats the parties were likely to obtain. For example, the day before the election in the United Kingdom, The Guardian newspaper reported on its latest poll which “showed Labour holding steady on 35% while the Conservatives slipped to 34%.” However, the report goes on to include specific information about the likely number of seats the major parties would gain: “The Guardian’s final poll projection, […], suggests that Labour and the Tories could be perfectly balanced in the new House of Commons, with 273 seats each.”Footnote 15 Further, this example illustrates another common theme in the reporting of predicted legislative seat shares: They were often only reported for the leading two parties or were provided only as the qualitative conclusion that these two parties were likely to be close to parity in seats, with no specific numbers given.
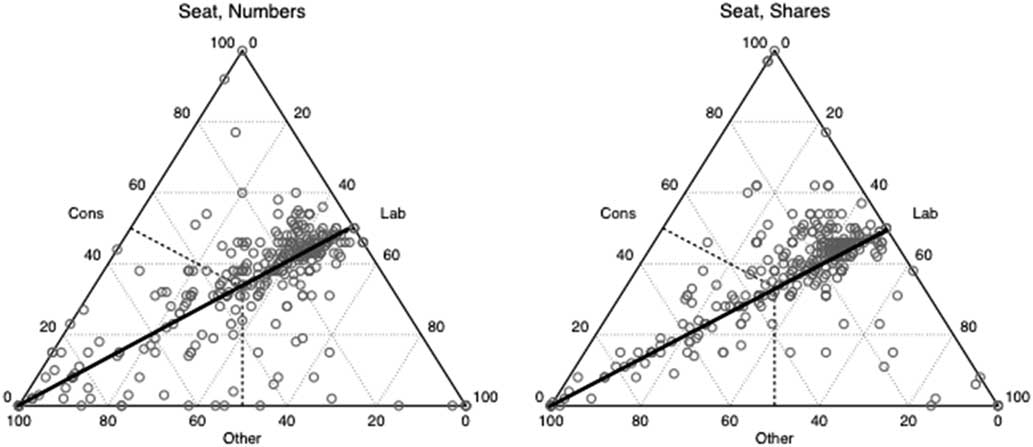
Indeed, we can look at the data in another way that lends some additional support to an interpretation in which we see these specific forms of media reporting of information reflected directly in respondent expectations. Specifically, Figure 4 provides a set of ternary diagrams that plot each respondent’s implied or reported seat shares for Labour, the Conservatives, and all other parties combined (which necessarily sum to 100 percent). As noted, media reporting about the election was dominated by the idea that the two large parties were likely to gain similar shares of votes and seats. Thus, the key result in the diagram is the marked prevalence of response along the black lines in each figure, which indicate cases in which the respondent assigned equal seat shares (or numbers) to Labour and the Conservatives.
Expectations about seat shares: labor, conservatives, and combined other parties

What is clear here is that there is a strong tendency to equate the shares of the two large parties, even when the total share of seats assigned to these two parties relative to others is much larger or smaller than it should be. This is thus consistent with the idea that even when voters were unsure of the exact sizes of the two big parties, they nevertheless understood that they were likely to be the same size.
Finally, if our explanation for the striking difference in the distribution of responses across treatments is correct, we should see (1) a similar difference in the responses for the smaller British parties (but shifted right rather than left), and (2) no such difference in the highly proportional Danish system in which there is a close correspondence between votes and seats. Our analysis in the Online Appendix F confirms the first expectation for the other British parties. For example, the median expected seat share for the Liberal Democrats in the “seat percentage” condition was 8 percent, but in the “seat numbers” condition was 5 percent (the average forecast for seat share was 4 percent and for vote share was ~9 percent).
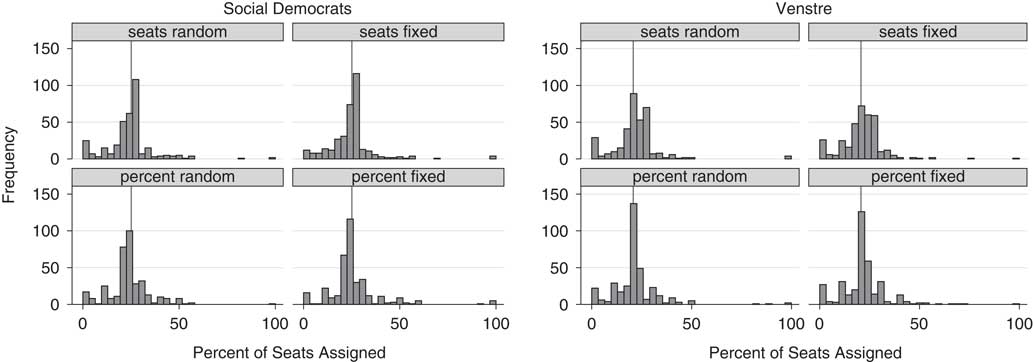
The second expectation is confirmed in Figure 5, which provides the expected seat distribution by condition for the two largest Danish parties, the Social Democrats and Venstre (Danish Liberal Party). As we expected, we do not see the same striking difference across conditions in this case.
Distribution of responses for Danish Social Democrats and Venstre Note: Solid line: polling average vote percentage.

This result suggests that researchers trying to tap voters’ knowledge of legislative seat shares should be careful about asking respondents to answer in terms of seat shares when these could be quite different from vote shares. Apparently, when asked about percentages, the typical respondent just quickly provides the percentage of “votes” at the top of their head (which happens to be wrong) and moves on. In contrast, when vote and seat shares are likely to be the same, then the choice may be less consequential.
CONCLUSIONS
In this paper we examined survey measures of an often-overlooked aspect of political knowledge: knowledge of party sizes. This effort was motivated by recent work highlighting the importance of a number of quite specific informational inputs (like party sizes and incumbency status) to heuristic rules that may allow otherwise uninformed individuals to leverage this information into reasonable inferences about more complicated (and less observable) aspects of politics (e.g., which policy-making coalitions have formed or will form, how parties are changing their policy positions, and the distribution of policy making influence in collective decision-making environments).
Given widespread skepticism of both the feasibility of asking such questions and their added value over and above standard batteries of less complicated questions tapping other political facts and current events, such questions have seldom been asked on previous surveys. Consequently, there is little existing evidence to substantiate or refute their assumed infeasibility or to explore the best forms in which to present them. In this paper, we remedy this lack using original data from two surveys (and survey experiments) fielded just before the 2015 elections in Denmark and the United Kingdom. This effort yields two very clear conclusions:
1. Earlier (evidence free) skepticism about the willingness and ability of respondents to answer such questions is unfounded.Footnote 16
Few respondents refuse to attempt the questions or adopt avoidance strategies and the vast majority of responses are quite generally sensible, though there is clear variation across respondents in accuracy.
2. In polities in which there is disproportionality between votes and seats, questions aimed at tapping knowledge about legislative seat shares should ask directly about numbers of seats and not percentages of seats.
Our data from the United Kingdom shows quiet clearly that the typical respondent who was asked about seat shares responded with information about vote shares. However, the typical respondent who was asked about numbers of seats (somewhat remarkably) provided accurate seat numbers (which when converted deterministically to shares resulted in accurate seat shares). This result makes sense when one investigates how the media in the United Kingdom tends to report parties’ electoral strength and the consequent implications for the distribution of legislative seats. While we do not as yet have evidence from other disproportional systems, it is not implausible that a similar phenomenon applies to other cases. If so, this is a critically important result for the future design (and interpretation) of such knowledge questions.