INTRODUCTION
Seasonal changes in climate, such as temperature seasonality (temperature contrast between summer and winter) and extreme seasonal climate events, have important impacts on natural and human systems (Andreasson and Schmitz, Reference Andreasson and Schmitz2000; Wanamaker et al., Reference Wanamaker, Kreutz, Schöne and Introne2011; Yan et al., Reference Yan, Sun, Shao and Wang2015; Winter et al., Reference Winter, Vellekoop, Clark, Stassen, Speijer and Claeys2020). Therefore, understanding the dynamics of the seasonal climate changes and predicting its future trends under expected future global warming should be one of the most important priorities in the climate sciences. However, the time span of high-resolution modern instrumental data is usually less than two hundred years, limiting our understanding of seasonal climate variations within the long-term climate background.
Paleoclimate proxy records, such as ice cores (Dansgaard et al., Reference Dansgaard, Johnsen, Clausen, Dahl-Jensen, Gundestrup, Hammer and Hvidberg1993; Petit et al., Reference Petit, Jouzel, Raynaud, Barkov, Barnola, Basile and Bender1999), stalagmites (Polyak et al., Reference Polyak, Cokendolpher, Norton and Asmerom2001; Cheng et al., Reference Cheng, Edwards, Southon, Matsumoto, Feinberg, Sinha and Zhou2018), loess (An et al., Reference An, Kukla, Porter and Xiao1991), lake sediments (Eawag et al., Reference Eawag, Eicher, Siegenthaler and Birks1992; Chen et al., Reference Chen, McGee, Woods, Pérez, Hatfield, Edwards and Cheng2020), and tree rings (Fritts et al., Reference Fritts, Lofgren and Gordon1979; Roig et al., Reference Roig, Le-Quesne, Boninsegna, Briffa, Lara, Grudd, Jones and Villagrán2001; Tian et al., Reference Tian, Gou, Zhang, Peng, Wang and Chen2007; Zaw et al., Reference Zaw, Fan, Bräuning, Xu, Liu, Gaire, Panthi and Than2020), are important supplements for modern instrumental data, but most of these proxies cannot be used to study past seasonal climate changes because of their relatively low temporal resolution. Thus, developing high-resolution paleoclimate records, which can capture full seasonal cycles, are essential for us to reconstruct and understand past seasonal climate changes at a level that we need for mitigation and adaptability.
Marine biogenic carbonates, such as those found in corals and some bivalves (e.g., Tridacnidae spp., Arctic islandica, Patella vulgata, Spisula solidissima), have proven capable for reconstructing past seasonal climate variability because of their rapid growth rates and clear annual growth bands (e.g., Arthur et al., Reference Arthur, Williams and Jones1983; Schöne et al., Reference Schöne, Pfeiffer, Pohlmann and Siegismund2005; Yu et al., Reference Yu, Zhao, Wei, Cheng and Wang2005a; García-Escárzaga et al., Reference García-Escárzaga, Clarke, Gutiérrez-Zugasti, González-Morales, López-Higuera and Cobo2018; Deng et al., Reference Deng, Wei, Zhao and Zeng2019; Yan et al., Reference Yan, Liu, An, Yang, Yang, Huang and Qiu2020). Proxies that have been applied to reconstruct past sea surface temperatures (SST), sea surface salinity (SSS) and precipitation at a monthly resolution include geochemistry using elemental ratios and isotopes (e.g., Sr/Ca, Mg/Ca, δ18O, δ13C) (e.g., Yu et al., Reference Yu, Zhao, Wei, Cheng, Chen, Felis, Wang and Liu2005b; Versteegh et al., Reference Versteegh, Vonhof, Troelstra, Kaandorp and Kroon2010; Butler et al., Reference Butler, Wanamaker, Scourse, Richardson and Reynolds2011; Gorman et al., Reference Gorman, Quinn, Taylor, Partin, Cabioch, Austin, Pelletier, Ballu, Maes and Saustrup2012; Bolton et al., Reference Bolton, Goodkin, Hughen, Ostermann, Vo and Phan2014; Brocas et al., Reference Brocas, Felis, Gierz, Lohmann, Werner, Obert, Scholz, Kölling and Scheffers2018).
Tridacna spp. may live over 100 years, and their shells are the largest bivalve shells in the world, measuring up to 1 m in diameter. Since the Eocene (ca. 50 million years ago), Tridacna spp. has been a key component of coral reefs in the tropical Indian-Pacific Ocean (Rosewater, Reference Rosewater1964). Tridacna shells are sedentary, record environments at a fixed point in space, and their fast-growing shells usually have clear and visible annual growth bands. Powder samples that record monthly growth can be obtained from the annual bands of Tridacna by using a micro mill. Therefore, Tridacna spp. can be used as an ideal material to reconstruct past seasonal climate changes (Aharon and Chappell, Reference Aharon and Chappell1986; Watanabe et al., Reference Watanabe, Suzuki, Kawahata, Kan and Ogawa2004; Yan et al., Reference Yan, Sun, Shao and Wang2015; Liu et al., Reference Liu, Yan, Fei, Ma, Zhang, Shi, Soon, Dodson and An2019; Shao et al., Reference Shao, Mei, Yang, Wang, Yang, Gao, Yang and Sun2020; Yan et al., Reference Yan, Liu, An, Yang, Yang, Huang and Qiu2020).
Oxygen isotopes have been used extensively to reconstruct the ambient paleotemperature from Tridacna shell carbonates (Welsh et al., Reference Welsh, Elliot, Tudhope, Ayling and Chappell2011; Driscoll et al., Reference Driscoll, Elliot, Russon, Welsh, Yokoyama and Tudhope2014; Ayling et al., Reference Ayling, Chappell, Gagan and McCulloch2015; Yan et al., Reference Yan, Liu, Zhang, Li, Zheng, Wei, Xie, Deng and Sun2017; Hu et al., Reference Hu, Sun, Cheng and Yan2020; Shao et al., Reference Shao, Mei, Yang, Wang, Yang, Gao, Yang and Sun2020). However, due to the simultaneous influence of SST and oxygen isotope composition of the surrounding seawater, there can be a relatively large uncertainty factor in reconstructing the past SST if the δ18O content of ancient seawater is unknown (Aharon, Reference Aharon1983, Reference Aharon1991; Aharon and Chappell, Reference Aharon and Chappell1986; Watanabe and Oba, Reference Watanabe and Oba1999).
Because of the successful application of Sr/Ca thermometers in corals (Beck et al., Reference Beck, Edwards, Ito, Taylor, Recy, Rougerie, Joannot and Henin1992; McCulloch et al., Reference McCulloch, Mortimer, Esat, Li, Pillans and Chappell1996; Alibert and McCulloch, Reference Alibert and McCulloch1997), the Sr/Ca in Tridacna spp. has also been studied in recent years (Elliot et al., Reference Elliot, Welsh, Chilcott, McCulloch, Chappell and Ayling2009; Batenburg et al., Reference Batenburg, Reichart, Jilbert, Janse, Wesselingh and Renema2011; Yan et al., Reference Yan, Shao, Wang and Sun2013, Reference Yan, Shao, Wang and Sun2014a, Reference Yan, Sun, Shao, Wang and Wei2014b, Reference Yan, Sun, Shao and Wang2015). Based on the results of laser-ablation inductively coupled plasma mass-spectrometry (LA-ICP-MS; Elliot et al., Reference Elliot, Welsh, Chilcott, McCulloch, Chappell and Ayling2009; Batenburg et al., Reference Batenburg, Reichart, Jilbert, Janse, Wesselingh and Renema2011), early studies did not identify any significant correlation between monthly Sr/Ca of Tridacna spp. and SST. Subsequently, Yan et al. (Reference Yan, Shao, Wang and Sun2013, Reference Yan, Shao, Wang and Sun2014a) determined the Sr/Ca of Tridacna spp. using inductively coupled plasma optical-emission spectrometry (ICP-OES), and found that the Sr/Ca profiles of Tridacna shells from the South China Sea (SCS) had obvious seasonal cycles and were significantly correlated with local SST. Thus, these studies showed that the Sr/Ca of Tridacna spp. had the potential to be used to reconstruct seasonal changes in SST.
The South China Sea is located at ~110°E to ~120°E, and ~5°N to ~20°N, between the eastern Indian Ocean and the western Pacific Ocean. As the largest semi-enclosed marginal sea in the northwest Pacific Ocean, climate in the SCS is controlled by the Asian monsoon on seasonal timescales and by El Niño-Southern Oscillation (ENSO) variability on inter-annual timescale (Sun et al., Reference Sun, Gagan, Cheng, Scott-Gagan, Dykoski, Edwards and Sua2005; Wei et al., Reference Wei, Deng, Yu, Li, Sun and Zhao2007; Wang and He., Reference Wang and He2012; Kim et al., Reference Kim, An, Jun, Park and Yeh2017). Therefore, high-resolution climate records derived from Tridacna spp. in the SCS have the potential to provide perspectives on the climate interactions between the mid-high latitudes and the tropics.
The middle Holocene (8000 to 3000 yr BP) has been proposed as a natural warm period in the history of Earth's climate by many studies (e.g., Chen et al., Reference Chen, Wu, Holmes, Madsen, Zhu, Jin and Oviatt2003; Ma et al., Reference Ma, Zhang, Pachur, Wünnemann, Li and Feng2004; Ren et al., Reference Ren, Sha, Shi and Liu2021). High-resolution climate records during the middle Holocene can help us understand the dynamics of seasonal climate changes and aid in predicting future climate trends under expected global warming. In this study, monthly Sr/Ca ratios from three middle Holocene Tridacna squamosa specimens from the North Reef of the northern SCS, with life spans of 34, 36, and 53 years, respectively, were determined. These high-resolution Sr/Ca data were used to reconstruct the middle Holocene SST seasonality changes in the northern SCS, and we discussed their relationship with regional and global climate changes below.
MATERIALS AND METHODS
Regional setting
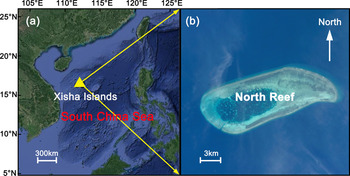
The South China Sea, one of the three major marginal seas of China, is a semi-enclosed sea with a northeast-southwest directional trend, encompassing an area of ~3.5 million km2 (Fig. 1a). The SCS is connected with the Pacific Ocean to the east and the Indian Ocean to the west. The Xisha Islands (aka Paracel Islands; located ~111°E to ~113°E, ~15°40′N to ~17°10′N; Fig. 1a), are a SCS island group, and are located in the northwest SCS. North Reef (111°30′E, 17°05′N; Fig. 1b) is located in the northern part of Xisha Islands and is a tropical elliptic coral reef.
(a) Map of the South China Sea with location of the Xisha Islands marked by a yellow triangle. Yellow arrows represent that map b is an inset from map a. (b) Satellite photo of North Reef in the Xisha Islands.

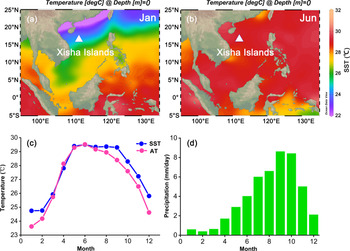
The climate of the Xisha Islands, which is strongly influenced by the Asian monsoon, has obvious seasonal climate changes. Figure 2 shows the mean SST distribution map in January and June from the SCS from AD 1955–2012 (Fig. 2a, b) and the average monthly time-series of air temperature (AT), SST, and precipitation from AD 2000–2016 (Fig. 2c, d). From AD 2000–2016 the lowest monthly SST in the Xisha Islands occurred in January (24.75°C) and the highest monthly SST occurred in June (29.51°C) (Fig. 2c). Due to the influence of the southwest Asian monsoon, rain in the Xisha Islands mainly falls from June to November, and rarely from December to May (Fig. 2d). Thus, the climate of Xisha Islands has distinct dry and wet seasons. The monthly SST and precipitation data in Xisha Islands used in this study were obtained from the Asia-Pacific Data-Research Center with a spatial resolution of 1°×1° (http://apdrc.soest.hawaii.edu/data/data.php?discipline_index=2, accessed October 15, 2020). For SST and precipitation data, we chose the HadlSST and CPC databases. The AT data in Xisha Islands was obtained from meteorological observations from the China greenhouse data-sharing platform (http://data.sheshiyuanyi.com/WeatherData/, accessed July 18, 2020).
Mean sea-surface temperature (SST) distribution map of the South China Sea in (a) January [Jan] and (b) June [Jun] from AD 1955 to AD 2012. Location of Xisha Islands is marked by a white triangle. (c) Monthly mean air temperature (AT) and SST from AD 2000 to AD 2016, and (d) monthly mean precipitation from AD 2000 to AD 2016.

Shell collection and sample preparation
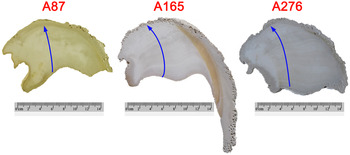
For this study, four Tridacna spp. specimens were used in our analyses. One modern specimen (YX1; published in Yan et al., Reference Yan, Shao, Wang and Sun2013), was collected alive from Yongxing Island, Xisha Islands, SCS, in March 2005. The other three subfossil Tridacna squamosa (specimens A87, A165 and A276; Fig. 3), were collected from North Reef, Xisha Islands, SCS, in April 2015. By cutting along the maximum growth axis, longitudinal sections of shells were obtained. Clear growth laminae were visible in the sections (Fig. 3).
Longitudinal sections of Tridacna squamosa specimens A87, A165, and A276 used in this study. Blue lines indicate the track of the sampling lines used for Sr/Ca determination.

Consistent with previous studies (Watanabe et al., Reference Watanabe, Suzuki, Kawahata, Kan and Ogawa2004; Yan et al., Reference Yan, Shao, Wang and Sun2013, Reference Yan, Sun, Shao, Wang and Wei2014b, Reference Yan, Wang and Sun2014c, Reference Yan, Sun, Shao and Wang2015), X-ray diffraction analysis showed that the Tridacna squamosa shells studied herein were mainly aragonitic. To remove organic matter from the surface of the sample slices, the slices were soaked in 30% hydrogen peroxide, then cleaned with deionized water using ultrasonic agitation, then air-dried (Yu et al., Reference Yu, Zhao, Wei, Cheng and Wang2005a; Goodkin et al., Reference Goodkin, Hughen, Cohen and Smith2005).
AMS 14C dating and Sr/Ca analysis
Accelerator-based mass spectroscopic (AMS) 14C measurements and Sr/Ca analysis were completed at the Institute of Earth Environment, Chinese Academy of Sciences (IEECAS). Powder samples collected from the middle of the sections of the three subfossil Tridacna squamosa specimens (A87, A165, and A276) were used for AMS 14C measurements. Each subsample required ~ 0.1 g for CO2 generation. The powder samples were placed in a mass spec, then pumped down to achieve a vacuum and the 85% orthophosphoric acid added to generate CO2 (Griffin and Druffel., Reference Griffin and Druffel1985). The resulting CO2 was purified through a vacuum line. We used a zinc reduction method to convert the CO2 to graphite (Xu et al., Reference Xu, Trumbore, Zheng, Southon, McDuffee, Luttgen and Liu2007), then the graphite was analyzed by AMS 14C measurements.
The powder samples used for Sr/Ca analysis were obtained along the maximum growth axis and perpendicular to the annual lamina using a micro mill to create powder along a groove (Yan et al., Reference Yan, Shao, Wang and Sun2013, Reference Yan, Sun, Shao, Wang and Wei2014b, Reference Yan, Sun, Shao and Wang2015). Groove cross-section lengths were 2 mm and widths were 0.15 mm, then 12–30 powder samples were obtained from each annual layer for Sr/Ca determination. A total of 2452 samples were obtained for Sr/Ca analysis: 622 for A87, 810 for A165, and 1020 for A276. Approximately 0.5–1.5 mg of each powder sample was dissolved in 2 ml 5% HNO3, and 1.5 ml of this solution was then used for the Sr/Ca measurements. The Sr/Ca ratios were determined by ICP-OES with radial plasma observation (identified spectral lines for Ca: 317.933 nm, and for Sr: 407.711 nm). In order to ensure the stability of the measurements, we inserted a laboratory standard sample after every five subsamples to check accuracy of the measurements. The external precision of a laboratory standard was ± 0.79% for Sr/Ca.
Establishing chronologies of Sr/Ca profiles
Chronological frameworks for the Sr/Ca profiles of Tridacna squamosa specimens A87, A165, and A276 were established using the method described by Yan et al. (Reference Yan, Shao, Wang and Sun2013). A recent study by Arias-Ruiz et al. (Reference Arias-Ruiz, Elliot, Bézos, Pedoja, Husson, Cahyarini, Cariou, Michel, La and Manssouri2017) showed that the Sr/Ca profiles of Tridacna squamosa shells have a significant positive correlation with the local SST and that the lowest Sr/Ca ratios correspond to the coldest season of a year. Chronologies for high-resolution Sr/Ca profiles of Tridacna squamosa shells A87, A165, and A276 were established using annual arrival times of the winter SST minima in Xisha Islands (which was then assigned as January), then the time between the Sr/Ca minima was assigned using linear interpolation with an equal timespan (Sun et al., Reference Sun, Gagan, Cheng, Scott-Gagan, Dykoski, Edwards and Sua2005; Yan et al., Reference Yan, Shao, Wang and Sun2013).
Data resampling
Because the number of sampling intervals between each layer differed, in order to assess the past seasonal climate changes from the Sr/Ca ratios of Tridacna squamosa specimens, Sr/Ca data were resampled with a 12-point cubic spline model (Wanamaker et al., Reference Wanamaker, Kreutz, Schöne and Introne2011), using AnalySeries (Paillard et al., Reference Paillard, Labeyrie and Yiou1996; http://www.lsce.ipsl.fr/en/softwares/index.php).
Calculating SST seasonality
Seasonality was generally defined as the difference between summer and winter values in any given year. The Sr/Ca profiles of the Tridacna specimens used in this study showed clear annual cycles, and we defined the Sr/Ca seasonality (ΔSr/Ca) as the difference between the average of three maximum Sr/Ca ratios (mean of June, July and August = summer) and the average of two minimum Sr/Ca ratios (mean of January and February = winter) for each year. Previous studies have demonstrated that seasonal variations of Tridacna Sr/Ca in the northern SCS were primarily controlled by seasonal oscillations of the SST, and Sr/Ca-SST slopes were similar among species and individuals of Tridacna shells (Yan et al., Reference Yan, Shao, Wang and Sun2014a). Thus, the SST seasonality ΔT (°C) in the northern SCS can be calculated from the Sr/Ca seasonality (ΔSr/Ca) of Tridacna shells using the following equation by Yan et al. (Reference Yan, Shao, Wang and Sun2013):
SST seasonality ΔT (°C) = proxy seasonality ΔSr/Ca × 16.60 (Eq. 1)
RESULTS
AMS 14C dating
Results from age-dating the studied Tridacna specimens are shown in Table 1. The modern Tridacna gigas specimen YX1, collected live in March 2005, had a growth period from AD 1994–2005. The AMS 14C dating results of three sub-fossil Tridacna squamosa specimens were: A87, 3304 ± 80 14C yr BP; A165, 4063 ± 60 14C yr BP; and A276, 4653 ± 60 14C yr BP. The AMS 14C ages were calibrated by the marine 14C yield model using Marine13 of Calib Rev. 7.0.4 (http://www.calib.org, accessed August 12, 2020) with a regional ΔR = 18 and σ = 37 (Southon et al., Reference Southon, Kashgarian, Fontugne, Metivier and W-S Yim2002), resulting in calibrated ages of: A87, 3118 ± 80 cal yr BP; A165, 4069 ± 60 cal yr BP; and A276, 4860 ± 60 cal yr BP.
Results from AMS 14C dating and Sr/Ca ratios.

Sr/Ca ratios for specimens A87, A165 and A276
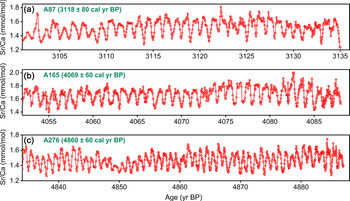
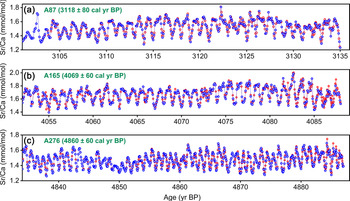
The Sr/Ca ratios for specimens A87, A165, and A276 were: 1.23–1.81 mmol/mol, 1.39–2.00 mmol/mol and 1.26–1.75 mmol/mol; the means were 1.52 ± 0.10 mmol/mol (n = 622), 1.66 ± 0.11 mmol/mol (n = 810) and 1.48 ± 0.09 mmol/mol (n = 1020), respectively (Fig. 4, Table. 1). 34, 36, and 53 annual cycles were identified from the Sr/Ca profiles of A87, A165, and A276, respectively.
Sr/Ca profiles plotted against calibrated ages of Tridacna squamosa specimens: (a) A87, (b) A165, and (c) A276.

Data resampling and calculated proxy SST seasonality
For the three subfossil Tridacna squamosa specimens, 12 to 42 Sr/Ca samples were obtained from each annual layer. To assess changes in the seasonal SST cycle, the number of Sr/Ca samples per year was adjusted to 12 points using a 12-point cubic spline model resampling (Wanamaker et al., Reference Wanamaker, Kreutz, Schöne and Introne2011). The results of 12-point resampling for Sr/Ca profiles of Tridacna squamosa specimens A87, A165, and A276 are shown in Figure 5.
Profiles from the 12-point resampling for Sr/Ca profiles plotted against calibrated ages of Tridacna specimens (a) A87, (b) A165, and (c) A276. Original Sr/Ca data are shown in red and resamples data are in blue.

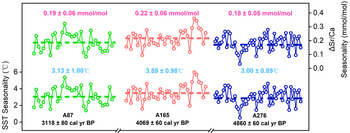
The ΔSr/Ca and calculated SST seasonality of Tridacna squamosa specimens A87, A165, and A276 are plotted in Figure 6. The mean SST seasonality of specimens A87, A165, and A276 were 3.13 ± 1.00°C (mean ΔSr/Ca = 0.19 ± 0.06 mmol/mol), 3.59 ± 0.98°C (mean ΔSr/Ca = 0.22 ± 0.06 mmol/mol), 3.00 ± 0.89°C (mean ΔSr/Ca = 0.18 ± 0.05 mmol/mol), respectively.
Seasonality reconstruction inferred using ΔSr/Ca from Tridacna squamosa specimens A87, A165, and A276. SST = sea surface temperature.

In order to test the SST seasonality differences between the middle Holocene and present, the SST seasonality from AD 1994–2004 was calculated using the published Sr/Ca data from a modern Tridacna gigas specimen (YX1, Yan et al., Reference Yan, Shao, Wang and Sun2013) and instrumental data. The averaged SST seasonality from AD 1994–2004 derived from YX1 and instrumental data were 4.05 ± 0.69°C and 4.32 ± 0.59°C, respectively. The averaged SST seasonality during the middle Holocene derived from the three Tridacna squamosa specimens in this study was 3.21 ± 0.98°C, indicating a smaller SST seasonality during the middle Holocene than that during AD 1994–2004 (Fig. 7).
Sequence of sea surface temperature (SST) seasonality reconstructions for the three Tridacna squamosa samples used in this study (A276, A165, A87), Tridacna gigas YX1 (Yan et al., Reference Yan, Shao, Wang and Sun2013), and modern instrumental data. The mean SST seasonality of the three Tridacna squamosa in this study, the Tridacna gigas YX1, and modern instrumental data from Xisha Islands of the north SCS are marked by blue, red and green squares, respectively. Error bar (1σ) is the standard deviation of the SST seasonality.

DISCUSSION
Reconstructing SST seasonality using Sr/Ca ratios from Tridacna shells
The Sr/Ca ratios of coral skeletons have long been known to yield a high-resolution proxy for SST, and thus have been extensively utilized in high-resolution paleotemperature reconstructions in tropical oceans (Beck et al., Reference Beck, Edwards, Ito, Taylor, Recy, Rougerie, Joannot and Henin1992; McCulloch et al., Reference McCulloch, Gagan, Mortimer, Chivas and Isdale1994; de Villiers et al., Reference de Villiers, Nelson and Chivas1995; McCulloch et al., Reference McCulloch, Mortimer, Esat, Li, Pillans and Chappell1996; Alibert and McCulloch, Reference Alibert and McCulloch1997; de Villiers, Reference de Villiers1999). Coral Sr/Ca ratios in the northern SCS have been widely studied, and the calibration between modern coral and instrumental data shows that the coral Sr/Ca ratio in the northern SCS is highly correlated with local SST and can be used as a monthly resolution SST proxy (Wei et al., Reference Wei, Sun, Li and Nie2000, Reference Wei, Yu and Zhao2004; Yu et al., Reference Yu, Zhao, Wei, Cheng and Wang2005a; Chen et al., Reference Chen, Yu and Chen2013). An early study suggested that the monthly resolution Sr/Ca profile of Tridacna squamosa from the SCS showed clear annual cycles and had a significant correlation with the local instrumental SST record, indicating that the Sr/Ca ratio from Tridacna squamosa had potential to become an indicator of SST variations (Shao et al., Reference Shao, Yan, Wang and Sun2012). Subsequent studies have shown that the Sr/Ca ratios of Tridacna gigas and Tridacna derasa also indicated clear annual cycles and were significantly correlated with the local SST (Yan et al., Reference Yan, Shao, Wang and Sun2014a, Reference Yan, Sun, Shao and Wang2015). Several recent studies showed that the high-resolution Sr/Ca ratios of Tridacna shells in the northern SCS also can capture a full annual cycle (Yan et al., Reference Yan, Shao, Wang and Sun2013, Reference Yan, Shao, Wang and Sun2014a, Reference Yan, Sun, Shao and Wang2015). Although substantial differences of mean Sr/Ca values were observed among Tridacna species in the northern SCS, Yan et al. (Reference Yan, Shao, Wang and Sun2014a) found that the slopes of SST to Sr/Ca among Tridacna species were relatively similar, indicating that the Sr/Ca in Tridacna shells can be used to reconstruct SST seasonality in the northern SCS, and is not affected by species (Yan et al., Reference Yan, Shao, Wang and Sun2014a).
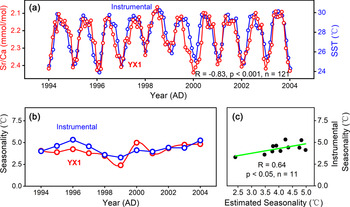
In order to test the reliability of SST seasonality reconstruction from Tridacna shells, the Sr/Ca data of a modern Tridacna gigas specimen (YX1, Yan et al., Reference Yan, Shao, Wang and Sun2013) were repeated in this study. Figure 8a shows the significant correlation between high-resolution Sr/Ca data of YX1 and modern instrumental SST data at Xisha Islands from AD 1994–2004 (R = −0.83, P < 0.001, n = 121). Based on Equation 1, the mean proxy-SST seasonality calculated from ΔSr/Ca of YX1 was 4.05 ± 0.69°C, which showed a significant correlation (R = 0.64, P < 0.05, n = 11) with modern instrumental SST seasonality (4.32 ± 0.59°C) from AD 1994–2004 from the Xisha Islands (Fig. 8b, c). This finding also supports that the Tridacna shell Sr/Ca has the potential to be used as an SST seasonality proxy.
(a) Instrumental sea surface temperature (SST; blue) and Sr/Ca data from sample YX1 (red) during AD 1994–2004. (b) Instrumental seasonality (blue) and estimated seasonality (red) based on Sr/Ca data from sample YX1 during AD 1994–2004. (c) Linear regression (green solid line) between the estimated seasonality and the instrumental seasonality. This figure is reproduced from Yan et al., Reference Yan, Sun, Shao and Wang2015.

Recent decadal variations and dynamics of SST seasonality in the northern SCS
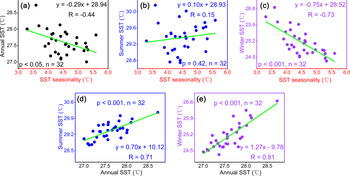
In order to understand changes of SST seasonality in the middle Holocene, the variations and dynamics of high-resolution instrumental SST seasonality in the northern SCS were investigated. The relationship between the SST seasonality and the SST in summer, winter, and annually were also calculated to test the contribution of summer, winter, and annual SST to changes in SST seasonality. The results revealed a negative correlation between SST seasonality and annual SST (R = −0.44, P < 0.05; Fig. 9a), which indicated that the SST seasonality decreased in response to warmer mean climate conditions. The SST seasonality showed no significant correlation with summer SST (R = 0.15, P = 0.42; Fig. 9b), but was highly correlated with winter SST (R = −0.73, P < 0.001; Fig. 9c), indicating that the SST seasonality in the northern SCS probably depended on the variability of winter conditions. The instrumental SST data also suggested that the annual SST increase/decrease of 1°C could result from winter SST and summer SST increase/decrease of 1.27°C and 0.70°C, respectively (Fig. 9d, e). Therefore, the asynchronicity between SST in winter and summer could explain the negative correlation between SST seasonality and annual mean SST in the northern SCS. When the climate in the northern SCS warmed, the rising range of SST during summer was less than that during winter, resulting in a reduction of the amplitude of SST seasonality.
Estimated high-resolution instrumental sea surface temperature (SST) data AD 1983–2014. Relationship between instrumental SST seasonality and: (a) annual SST, (b) summer SST, and (c) winter SST from the Xisha Islands, northern South China Sea (SCS). Relationship between instrumental annual SST and: (d) summer SST, and (e) winter SST in the Xisha Islands, northern SCS. Correlation lines shown in green. Modern instrumental SST data from the Xisha Islands was obtained from meteorological observations of the China greenhouse data sharing platform (http://data.sheshiyuanyi.com/WeatherData/).

SST in summer and winter was probably influenced by different climate dynamics in the northern SCS. During the summer, the western Pacific warm pool (WPWP) expanded northward to include the SCS, so summer SST in the northern SCS was likely controlled by this shift. During the winter, the WPWP center shifted south towards the equator, and the SCS was ‘engulfed’ by mid-high latitude southward-moving cold water driven by the East Asian winter monsoon (EAWM). Thus, the intensity of EAWM probably had a significant influence on winter SST, which would further affect the SST seasonality in the northern SCS. This scenario was also evident in the instrumental records from AD 1961 to AD 1999 (Fig. 10), which suggested that winter SST in the northern SCS was negatively correlated with the EAWM strength (R = −0.58, P < 0.001, n = 38). The winter monsoon velocity (WMV; December-January-February) from Yongxing Island was used as a proxy of the EAWM strength of the northern SCS (Fig. 10).
Relationship between winter monsoon velocity (WMV; red) and instrumental winter sea surface temperature (SST; blue) from AD 1961–1999. WMV data (December–February) were obtained from an observation station in the Xisha Islands available at http://data.cma.cn/data.

In short, high-resolution modern instrumental data suggest that the SST seasonality in the northern SCS was negatively correlated with annual SST in the SCS. When annual SST increased, SST seasonality generally decreased, and vice versa. The negative correlation between annual SST and SST seasonality was mainly caused by asynchronicity of SST variations in winter and summer. When the northern SCS mean climate condition warmed, winter SST increased more than that in summer, resulting in a reduction of the amplitude of SST seasonality. When the northern SCS mean climate conditions cooled, the decreased amplitude of SST in winter was larger than that in summer, resulting in an increased SST seasonality. Therefore, the SST seasonality in the northern SCS was probably driven by winter SST. The variation of winter SST in the northern SCS was deeply influenced by the intensity of EAWM.
Reconstructed SST seasonality in the northern SCS during the middle Holocene
Based on the high-resolution monthly Sr/Ca from three middle Holocene Tridacna squamosa specimens (A87, A165, and A276) from North Reef, northern SCS, the SST seasonality of three time-windows from the middle Holocene was reconstructed. The results indicated that the SST seasonality in the northern SCS during the middle Holocene (3.21 ± 0.98°C) was smaller than that for recent decades (AD 1994–2004, 4.32 ± 0.59°C).
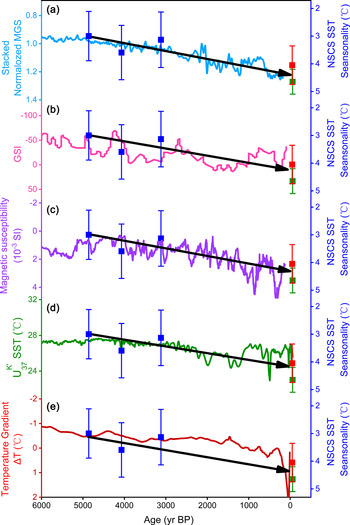
Instrumental data suggested that the SST seasonality in the northern SCS was dominated by the winter SST, which was deeply influenced by the EAWM. Thus, the small SST seasonality changes in the northern SCS during the middle Holocene probably indicated a warmer winter SST and a weaker EAWM in the northern SCS during the middle Holocene than that during AD 1994–2004. However, this hypothesis was difficult to test due to the limitation of the high-resolution seasonal SST records from the northern SCS. In contrast to the lack of the seasonal temperature records, the evolution of the EAWM during the Holocene has been widely investigated. Thus, we compared our Holocene SST seasonality data with the EAWM reconstructions derived from the mean grain size of Chinese loess sediment (Kang et al., Reference Kang, Du, Wang, Dong, Wang, Wang, Qiang and Song2020; Fig. 11a), grain-size index from core Oki02 in northwestern Pacific Ocean (Zheng et al., Reference Zheng, Li, Wan, Jiang, Kao and Johnson2014; Fig. 11b) and the magnetic susceptibility of a sediment core from Lake Huguang Maar (Yancheva et al., Reference Yancheva, Nowaczyk, Mingram, Dulski, Schettler, Negendank, Liu, Sigman, Peterson and Haug2007; Fig. 11c). All of these paleoclimate records showed that the EAWM strengthened from the middle Holocene to the present, which probably led to a decrease of the winter SST in the northern SCS and resulted in a larger SST seasonality. This may be the reason for the smaller SST seasonality changes during the middle Holocene recorded in our Tridacna specimen records. A recent reconstruction of the Holocene mean annual SST in the northern SCS derived from the long-chain unsaturated alkenones ${\rm U}_{37}^{{\rm {K}^{\prime}}}$ emphasized the more important role of winter temperatures, and indicated a warmer SST during the middle Holocene (Zhang et al., Reference Zhang, Zhu, Huang, Kong, He, Wang, Liu, Xie, Wei and Liu2019; Fig. 11d), also consistent with our deductions. We also calculated the temperature difference between the low and mid-high latitudes of the Northern Hemisphere (ΔT (°C) = T30°S - 30°N - T90°N - 30°N) (Marcott et al., Reference Marcott, Shakun, Clark and Mix2013) and found that the temperature gradient increased from the middle Holocene to present, also supporting an increased EAWM and enhanced SST seasonality in the northern SCS from the middle to late Holocene (Fig. 11e). The increased EAWM from the middle to late Holocene was probably associated with the continued increased temperature gradient between low and mid-high latitudes of the Northern Hemisphere. Compared with the slight temperature changes in low latitudes, the temperature gradient between low and mid-high latitudes in the Northern Hemisphere was primarily determined by mid-high latitudes in the Holocene (Marcott et al., Reference Marcott, Shakun, Clark and Mix2013). Therefore, decreases of temperature in mid-high latitudes of the Northern Hemisphere could strengthen the Siberian High, which in turn could increase the temperature gradient between the low and mid-high latitudes (Kang et al., Reference Kang, Du, Wang, Dong, Wang, Wang, Qiang and Song2020). In addition, because of the thermodynamic difference between land and sea, the gradient between the Aleutian Low and Siberian High accordingly changed, an important reason for increased intensity of the EAWM. In contrast, the increase in the temperatures of mid-high latitudes of the Northern Hemisphere weakened the EAWM. Therefore, the continued increased temperature gradient between the low and mid-high latitudes of the Northern Hemisphere during the middle to late Holocene may be the reason for the increase in EAWM intensity (Fig. 11e).
Comparing sea surface temperature (SST) seasonality records (squares) in the northern South China Sea (NSCS) during the middle to late Holocene with other published paleoclimate records. Holocene East Asian winter monsoon (EAWM) records derived from (a) mean grain size (MGS) of Chinese loess sediment (Kang et al., Reference Kang, Du, Wang, Dong, Wang, Wang, Qiang and Song2020), (b) grain-size index (GSI) from core Oki02 in the northwestern Pacific Ocean (Zheng et al., Reference Zheng, Li, Wan, Jiang, Kao and Johnson2014), and (c) magnetic susceptibility of a sediment core from Lake Huguang Maar (Yancheva et al., Reference Yancheva, Nowaczyk, Mingram, Dulski, Schettler, Negendank, Liu, Sigman, Peterson and Haug2007). (d) Reconstruction of Holocene mean annual SST in the northern SCS derived from long-chain unsaturated alkenones ${\rm U}_{37}^{{\rm {K}^{\prime}}}$ (Zhang et al., Reference Zhang, Zhu, Huang, Kong, He, Wang, Liu, Xie, Wei and Liu2019). (e) Temperature gradient between the low and high latitudes of Northern Hemisphere (Marcott et al., Reference Marcott, Shakun, Clark and Mix2013). Blue squares indicate the average SST seasonality derived from the Sr/Ca ratio of middle Holocene Tridacna squamosa specimens (A87, A165, and A276), red squares indicate the Sr/Ca ratio of a modern Tridacna gigas specimen (YX1), and green squares indicate modern instrumental SST data (AD 1994–2004).

It is worth noting that only three Tridacna high resolution time-windows with a total of 123 years were determined in our study, which limited a comprehensive understanding of the regional climate changes during the middle to late Holocene. In addition, it is almost impossible to produce continuous monthly resolution Tridacna records during the Holocene due to the relatively short lifespan of Tridacna (most live < 100 years), dating errors, and the huge workload of determinations. However, our study demonstrated that the combination of high- and low-resolution paleoclimate records can provide more details for past climate changes and greatly improve our understanding of the climate dynamics.
CONCLUSION
High-precision monthly resolution Sr/Ca ratios of three Tridacna squamosa specimens (A87, A165, A276) were determined to estimate SST seasonality during the middle Holocene. The results suggested that SST seasonality in the northern SCS during the middle Holocene was less pronounced than that during AD 1994–2004. We inferred that the less-pronounced SST seasonality during the middle Holocene was probably induced by higher winter SST, which was linked with a weaker EAWM and smaller high- to low-latitude temperature gradient in the Northern Hemisphere. Our study highlights that high-resolution Tridacna Sr/Ca records, together with other low-resolution paleoclimate records, can provide more evidence to help understand the variations and dynamics of past climate changes in the northern SCS.
Supplementary Material
The supplementary material for this article can be found at https://doi.org/10.1017/qua.2021.28.
Financial Support
Financial support for this research was provided by the National Natural Science Foundation of China (NSFC) (41877399, 42025304, 41991250), the Research Projects from Chinese Academy of Sciences (XDB40000000), the “Light of West China” Program of the Chinese Academy of Sciences, and the National Key R&D Program of China (2019YFC1509100).