In all vertebrate retinas, bipolar cells serve as the primary neurons linking the photoreceptor output to the ganglion cells that, in turn, provide the output of the retina to the brain. Insight into the function of bipolar cells is thus critical for understanding retinal organization and vision in general. Recent work has continued to underscore the anatomical diversity within the bipolar population. Some 10–20 anatomical subtypes have been identified (Wu et al., Reference Wu, Gao and Maple2000; Masland, Reference Masland2001; Connaughton et al., Reference Connaughton, Graham and Nelson2004; Sterling, Reference Sterling, Chalupa and Werner2004; Wassle, Reference Wassle2004; Wassle et al., Reference Wassle, Puller, Muller and Haverkamp2009; Wu, Reference Wu2010). Functionally, in what is probably the most fundamental and widely recognized finding, bipolar cells split information into two parallel channels of opposite response polarity via two broad classes of cells: OFF cells hyperpolarize to light, whereas ON cells depolarize and thereby invert the polarity of the photoreceptor input (Werblin & Dowling, Reference Werblin and Dowling1968; Nelson & Kolb, Reference Nelson, Kolb, Chalupa and Werner2004; Miller, Reference Miller2008; Wu, Reference Wu2010). Recently, the biophysics and pharmacology of bipolar cells and their synapses have been studied extensively to analyze the mechanisms responsible for the formation of the ON and OFF cell types (Slaughter & Miller, Reference Slaughter and Miller1981; Thoreson & Miller, Reference Thoreson and Miller1993; Grant & Dowling, Reference Grant and Dowling1996; Thoreson & Witkovsky, Reference Thoreson and Witkovsky1999; DeVries, Reference DeVries2000; Nawy, Reference Nawy2000; Zhang & Wu, Reference Zhang and Wu2003; Copenhagen, Reference Copenhagen, Chalupa and Werner2004; Thoreson, Reference Thoreson2007; Snellman et al., Reference Snellman, Kaur, Shen and Nawy2008; Koike et al., Reference Koike, Obara, Uriu, Numata, Sanuki, Miyata, Koyasu, Ueno, Tani, Ueda, Kondo, Mori, Tachibana and Furkawa2010).
In view of the array of recent studies at the anatomical and molecular levels, it becomes all the more important to reach a realistic and refined understanding of the nature of signal processing in bipolar cells. Progress on this front has been hampered by the technical difficulty in studying the light-evoked responses of bipolar cells. Of all vertebrates, the tiger salamander, with its somewhat larger cells, has proved most favorable for such studies. As a result, there is now a substantial body of information on the response of bipolar cells (for review, see Wu, Reference Wu2010). However, the vast majority of these results have been obtained from the isolated retina or retinal slice preparations, largely for rod-driven cells in the dark-adapted state. On the other hand, it is well established in human vision and most vertebrates that visual information processing and contrast processing, in particular, are greatly enhanced when the retina is in the light-adapted state and cones emerge as the dominant photoreceptors. In recent years, our laboratory has been engaged in a systematic program of research on intracellular studies of contrast processing. We have obtained quantitative measurements on over 400 cone-driven bipolar cells in the light-adapted salamander retina and also obtained recordings from cones and horizontal cells under identical conditions. Unlike most work in the salamander, we have used an intact eyecup preparation rather than isolated or slice preparations. As a result, the normal mechanisms of light adaptation are preserved and the retinal network and circuitry remain intact. This minireview provides an overview of our findings with limited citations of other reports since little directly comparable research has been reported. Inclusive references and details of our methods are given in our previous publications.
Luminance contrast provides a basic dimension for the detection of objects for most animals in natural environments. Some objects are brighter than their background (positive contrast), whereas others are darker (negative contrast), appearing as backlit objects, shadows, or the myriad of objects that reflect less light than their backgrounds. To understand contrast coding by bipolar cells, it is thus desirable to quantitatively and fully analyze responses to negative as well as positive contrasts, but surprisingly, this approach has rarely been pursued by others. In sum, the special nature of our work and the present minireview are based on quantitative analysis of contrast processing in cone-driven bipolar cells in the intact light-adapted retina. All bipolar cells described in this review received dominant input from the long wavelength sensitive 610-nm cones. Unless noted otherwise, stimuli were adjusted in both position and diameter to optimally activate the center of the receptive field.
Responses to contrast steps
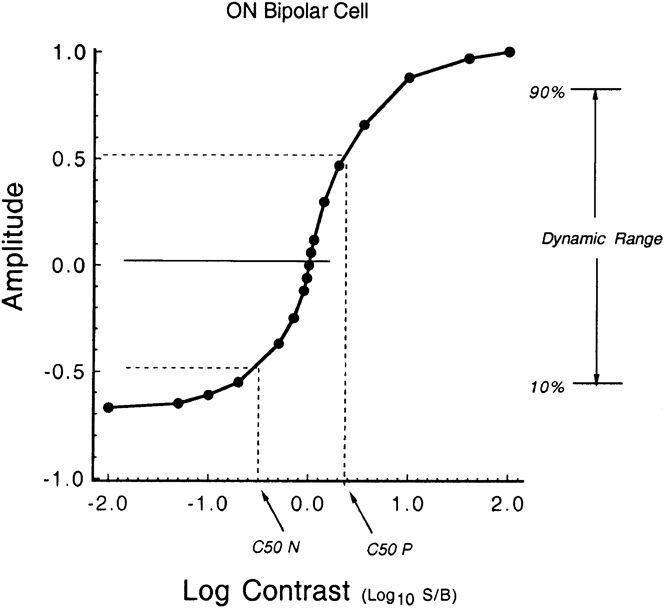
Contrast processing was studied in quantitative detail by the analysis of contrast–response curves, that is, a plot of response amplitude versus the contrast magnitude for steps of both polarities. To examine the properties of the contrast/response curve over the entire range of contrasts, the amplitude was plotted as a function of the logarithm of the contrast ratio, defined as log10(S/B), where S is the intensity during the step and B is the background intensity (Burkhardt et al., Reference Burkhardt, Fahey and Sikora2006). Thus, steps that increase or decrease the background light level by the same factor differ only in sign: for example, 10 times increases and 10 times decreases are specified as log contrasts of +1.0 and −1.0, respectively. A hypothetical contrast–response curve is shown in Fig. 1. Amplitude is normalized relative to the maximum response. This example represents an ON bipolar cell that gives a maximum depolarizing response to positive contrast and a hyperpolarizing response to negative contrast that is of about 65% of maximum. This example represents only one variant of four general types since, as emphasized later, in an individual cell of either the ON or OFF type, the maximum response may be evoked by either positive or negative contrast. The total response range of absolute amplitudes from maximum positive contrast (+2.0) to maximum negative contrast (−2.0) ranged from about 8–20 mV across our sample of cells. Differences in electrode seal from one cell to the next can lead to spurious and unknown differences in absolute amplitude in intracellular recordings. Moreover, no striking correlations between absolute amplitudes and the features of contrast processing highlighted in this review were apparent. Therefore, the results summarized in this review are based on analysis of amplitudes normalized with respect to the maximum response of each individual cell, whereas the sign of the response polarity is always preserved (see Fig. 1). Two quantitative indices of the contrast response of particular interest are illustrated in Fig. 1: 1) C50, the contrast of both polarities required to evoke a half-maximal response and 2) the dynamic range of contrast that encompasses 10–90% of the full range of response.
Hypothetical contrast–response curve for an ON bipolar cell showing two features used for quantitative analysis: C50 P and C50 N, the positive and negative contrasts that evoke 50% of the maximum response and the dynamic range for 10–90% of the total response range.

Contrast gain is calculated for the response to very small contrasts specified as Michelson contrast (Burkhardt & Fahey, Reference Burkhardt and Fahey1998). Thus, in this review, the contrast gain of bipolar cells is expressed as percent of the cell’s maximum response per % Michelson contrast as calculated from the initial slope of the contrast–response curve. As discussed in detail elsewhere (Burkhardt & Fahey, Reference Burkhardt and Fahey1998; Fahey & Burkhardt, Reference Fahey and Burkhardt2001), % Michelson contrast is calculated: [(S − B)/(S + B)] × 100, where S and B are as defined above.
Light adaptation and contrast gain
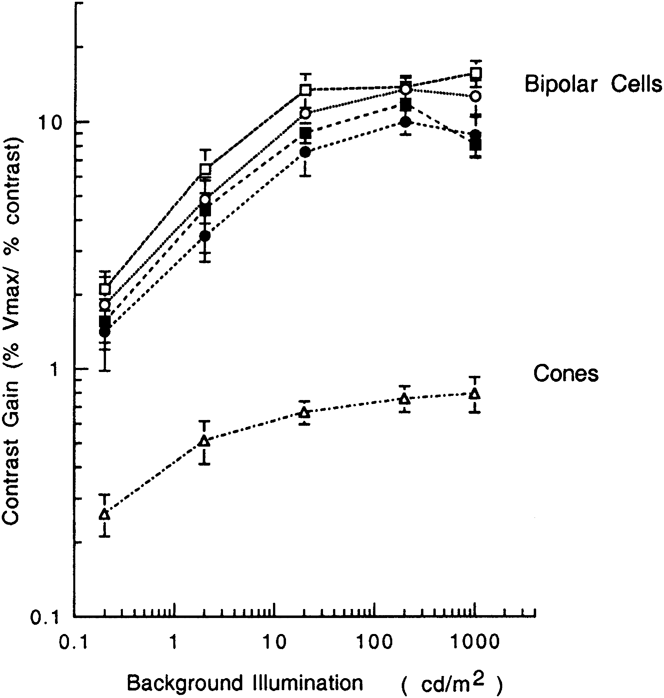
Light adaptation has striking effects on the contrast responses of bipolar cells (Fahey & Burkhardt, Reference Fahey and Burkhardt2001). Thus, contrast gain increases markedly with an increases in background illumination and then reaches remarkably high values at high levels of light adaptation as shown in Fig. 2. As may be seen in Fig. 2, for bipolar cells on average, the maximum contrast gain at high background illumination is about 10. Thus, about 10% of the maximum response is associated with a contrast step of 1%. The values for ON and OFF cells in Fig. 2 are similar. For both cell types, the gain for negative contrast is slightly lower than for positive contrast.
Effect of light adaptation on the contrast gain of bipolar cells and cones. Symbols for bipolar cells: open and filled squares: positive and negative contrasts, respectively, for ON cells. Open and filled circles: positive and negative contrasts, respectively, for OFF cells. Measurements for cones (triangles) are shown for positive contrast only for clarity since the results for negative contrast were very similar. Error bars show the s.e.m. The number of measurements per background intensity varied from 6 to 14 for cones, 24 to 63 for OFF cells, and 24 to 48 for ON cells. Adapted from fig. 6 of Fahey and Burkhardt (1998) with permission from Cambridge University Press.

The triangles in Fig. 2 show measurements for cones to positive contrast (Fahey & Burkhardt, Reference Fahey and Burkhardt2001). The contrast gain is much lower than that of bipolar cells. Results for negative contrast were virtually identical to those for positive contrast but are not shown in Fig. 2 for clarity. At high levels of background, the contrast gain is about 0.8 for cones and 10 or more for bipolars. Thus, relative to cones, contrast gain of bipolars is amplified by about 12.5, on average. For cones, the contrast gain increases from 0.26 to 0.79 with background illumination in Fig. 2, hence a factor of about 3. For bipolar cells, this factor ranged from 6.7 to 7.2 depending on cell type and contrast sign. Thus, on average, the amplification in contrast gain with light adaptation for bipolar cells is about 2.2–2.4 greater than that in cones. This difference suggests that there are two stages of adaptation-dependent mechanisms for regulating contrast gain. The first is detectable in the cone voltage. It is approximately linearly related to the cone steady-state hyperpolarization (Fahey & Burkhardt, Reference Fahey and Burkhardt2001, fig. 8, insert). The second stage arises between the voltage responses of the cones and bipolar cells.
According to the classic principle of light adaptation known as Weber’s law, contrast sensitivity should remain invariant with background illumination. However, as a rule, such invariance is restricted to moderate and high levels of background illumination (see Burkhardt, Reference Burkhardt1994, for review). This is also the case for the results of Fig. 2. In sum, the measurements of contrast gain in Fig. 2 show that Weber’s law holds to a good approximation for both cones and bipolar cells at backgrounds from 20 to 1000 cd/m2. Thus, the findings in Fig. 2 strongly suggest that the invariance reflected in Weber’s law behavior in bipolar cells is largely established at the level of the cone photoreceptors.
Light adaptation also induces marked changes in contrast processing for large signals: C50 values decrease substantially, the dynamic range narrows by about 50%, the response to negative contrast is enhanced, and the waveforms get somewhat more transient (Fahey & Burkhardt, Reference Fahey and Burkhardt2001; Burkhardt et al., Reference Burkhardt, Fahey and Sikora2006). Rapid contrast adaptation and gain control, not reviewed here, are strongly developed at the ganglion rather than the bipolar cell level (for review, see Gollisch & Meister, Reference Gollisch and Meister2010).
The overall form of the contrast–response curve for stimulation of the center of the receptive field of cone-driven bipolar cells is highly nonlinear (Fig. 1). The curve is very steep around zero contrast, which accounts for the very high contrast gain, but the response then approaches saturation at moderate contrasts that still lie within the linear range for cones. The contrast–response curve for cones is shallow and remains approximately linear for responses spanning ±20% of the maximum response (Burkhardt & Fahey, Reference Burkhardt and Fahey1998, fig. 8). Thus, the shape of the contrast–response curves for cones and bipolar cells is radically different (Burkhardt & Fahey, Reference Burkhardt and Fahey1998; Fahey & Burkhardt, Reference Fahey and Burkhardt2001). Contrast gain was not obviously related to the diameter of the bipolar cell receptive field center. Horizontal cells, although having large receptive fields, show much lower contrast gain than that of bipolars (Fahey & Burkhardt, Reference Fahey and Burkhardt2001). Virtually all the results in this review are based on voltage recordings with “sharp” electrodes. However, the contrast gain and responses to large contrasts were found to be similar under voltage and current clamp (r 2 = 0.86), suggesting that voltage-sensitive conductances do not play a major role in shaping the contrast response (Thoreson & Burkhardt, Reference Thoreson and Burkhardt2003).
On average, the contrast gain of amacrine and ganglion cells to contrast steps tends to be somewhat higher than bipolar cells but the difference is not great (Burkhardt et al., Reference Burkhardt, Fahey and Sikora1998; Burkhardt & Fahey, Reference Burkhardt and Fahey1999). In sum, our quantitative measurements clearly support the conclusion that, of all major classes of retinal neurons, bipolar cells are the dominant agents for contrast enhancement.
Sinusoidal modulation of contrast
Contrast steps have the important advantage that the responses to both negative and positive contrasts can be measured independently and thus compared. On the other hand, contrast steps are relatively complex stimuli in the time domain, so it is important to investigate the response to sinusoidal modulation of contrast. The center of the receptive field was stimulated at 3 Hz, which is near the optimum frequency for cone-driven bipolar cells in tiger salamander (Fig. 3). Responses were measured by signal averaging and by fast Fourier transform (FFT), while the retina was light adapted to a steady background of 20 cd/m2 (Burkhardt et al., Reference Burkhardt, Fahey and Sikora2004). ON and OFF bipolar cells showed similar behavior. Both responded with sinusoidal waveforms whose amplitude varied linearly with modulation depths ranging up to 7–8%. The slope of the modulation–response curve was very steep in this range. Thus, the average contrast gain was high, about a factor of 6 (mean of 6.0 ± 0.8 s.e.m., n = 18, for ON cells and 6.6 ± 0.9, n = 19, for OFF cells). The half-maximal response was typically reached at modulations of 9% or less. At higher modulations, the responses showed strong compressive nonlinearity, while higher harmonics of the FFT increased to constitute as much as 30% of the amplitude of the fundamental. In marked contrast to bipolar cells, the response of cones and horizontal cells was predominantly linear over the entire modulation range and showed low contrast gain. The average contrast gains were 1.02 (±0.07 s.e.m., n = 9) and 1.10 (±0.07 s.e.m., n = 7) for cones and horizontal cells, respectively. The observed difference in the response of horizontal cells and OFF bipolars suggests that the high contrast gain and strong nonlinearity of bipolar cells may arise, at least in part, by mechanisms that are proximal to cone transmitter release (Burkhardt et al., Reference Burkhardt, Fahey and Sikora2004).
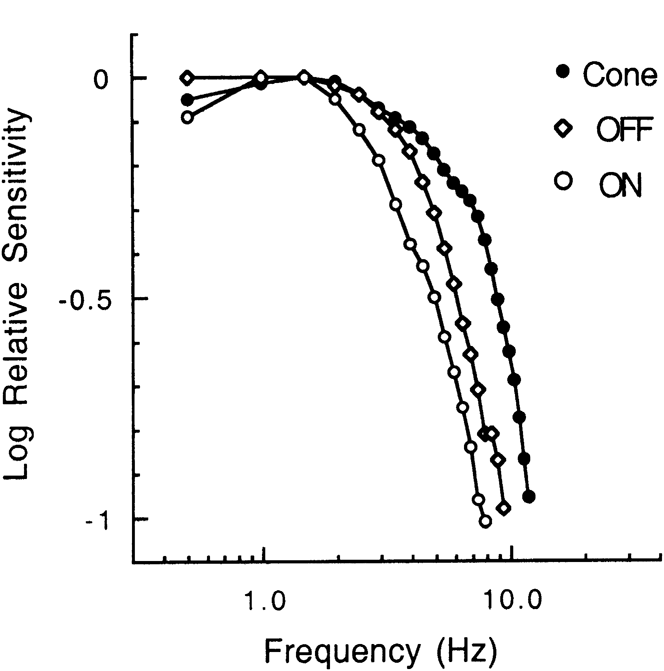
Average temporal transfer measurements in the light-adapted state (20 cd/m2) for 18 ON bipolar cells, 18 OFF bipolar cells, and 6 cones. Measurements have been normalized at 1.5 Hz. Without normalization, the curve for the cones would be about 6 times (0.78 log unit) below that for the bipolar cells, reflecting the relative contrast sensitivity of cones versus bipolar cells (Burkhardt et al., Reference Burkhardt, Fahey and Sikora2004).

Temporal contrast transfer functions of bipolar cells and cones
The temporal transfer for luminance contrast for small signals in the linear range was obtained for cones and ON and OFF bipolar cells (Burkhardt et al., Reference Burkhardt, Fahey and Sikora2007). The amplitude transfer functions for the light response of all three cell types showed an increase in high-frequency response with light adaptation in qualitative agreement with well-known results for other vertebrates and human vision. When light adapted to a background of 20 cd/m2, the phase delay of the ON bipolars was about 30 ms greater than that of the OFF bipolars. The slower time course of the ON bipolar response was clearly confirmed by both white noise analysis and measurements of the latency to flashes (Burkhardt et al., Reference Burkhardt, Fahey and Sikora2007, table 1). As shown in Fig. 3, the transfer functions at 20 cd/m2 were predominantly low pass with 10-fold attenuation falling at about 13, 9.1, and 7.7 Hz for cones and OFF and ON bipolar cells, respectively. The transfer function for transmission from the cone voltage to the ON and OFF bipolar voltage response was derived from these results. The derived functions were low pass with a broad peak around 2 Hz (Burkhardt et al., Reference Burkhardt, Fahey and Sikora2007, fig. 9) and closely approximated that expected for a cascade of three isolated low-pass RC filters (“leaky integrators”) with time constants of about 25 and 20 ms for ON and OFF cells, respectively. For qualitatively similar results in the turtle retina and differences in rapid contrast adaptation, see Copenhagen et al. (Reference Copenhagen, Ashmore and Schnapf1983), Rieke (Reference Rieke2001), and Copenhagen (Reference Copenhagen, Chalupa and Werner2004).
Distributed coding in bipolar cells and natural images
Our sample of more than 400 bipolar cells provides a basis to reach some insight into coding across the bipolar population. Thus, although the contrast response of the long-wave cones varied little from cone to cone (Burkhardt & Fahey, Reference Burkhardt and Fahey1998; Burkhardt et al., Reference Burkhardt, Fahey and Sikora2006), there was rather remarkable variation within both ON and OFF cells with respect to contrast gain, contrast dominance (i.e., whether the maximum response was evoked by negative or positive contrast), half-maximal contrasts (C50), and dynamic range. Moreover, these parameters were not highly correlated (Fahey & Burkhardt, Reference Fahey and Burkhardt2001), suggesting further diversity in coding among the underlying population. Some cells, in both the ON and OFF classes, have higher gain and give larger responses to negative contrast, whereas other cells favor positive contrast steps. Many cells have narrow dynamic ranges, while that of others range from moderate to large, independent of the cell type, that is, ON versus OFF. This apparent functional diversity across the bipolar population is of interest relative to models of downstream microcircuits (Gollisch & Meister, Reference Gollisch and Meister2010) and, more particularly, to the properties of contrast in natural environments.
We measured the magnitude of contrasts in a sample of 65 natural images. Contrast was quantified as the logarithm of the contrast ratio between a small central reference area and a surrounding area 8 times larger (Burkhardt et al., Reference Burkhardt, Fahey and Sikora2004). Thus, the metric was fundamentally similar to that used for the analysis of contrast–response curves. The results were not greatly affected by the variations in the size of the central and surrounding area. The contrast distributions resembled those reported previously by others (Burkhardt et al., Reference Burkhardt, Fahey and Sikora2004, fig. 6 and table 1), showing that the vast majority of contrasts in nature are very small and that negative contrasts are as frequent, or more so, than positive contrasts. A feature of efficient coding theory, called matched amplification (Laughlin, Reference Laughlin1987), was then examined by comparing the average contrast–response curves of bipolar cells with the cumulative probability distribution of contrasts in our natural image measurements. At a background of 20 cd/m2, the results were in approximate agreement with that expected for matched amplification (Burkhardt et al., Reference Burkhardt, Fahey and Sikora2004, fig. 7). On the other hand, at lower levels of light adaptation, the contrast–response curves were much too shallow (Burkhardt et al., Reference Burkhardt, Fahey and Sikora2004, fig. 8). In sum, our results suggest that two fundamental physiological factors—light adaptation and the nonlinear transfer across the cone-bipolar synapse, are essential for the emergence of matched amplification contrast coding. This evidence for matched amplification provides a new view for the function of light adaptation and the contribution of the cone-bipolar synapse in vertebrate vision. Work to date suggests that our results for contrast flashes also apply to image movement on the retina (Burkhardt et al., Reference Burkhardt, Fahey and Sikora2006).
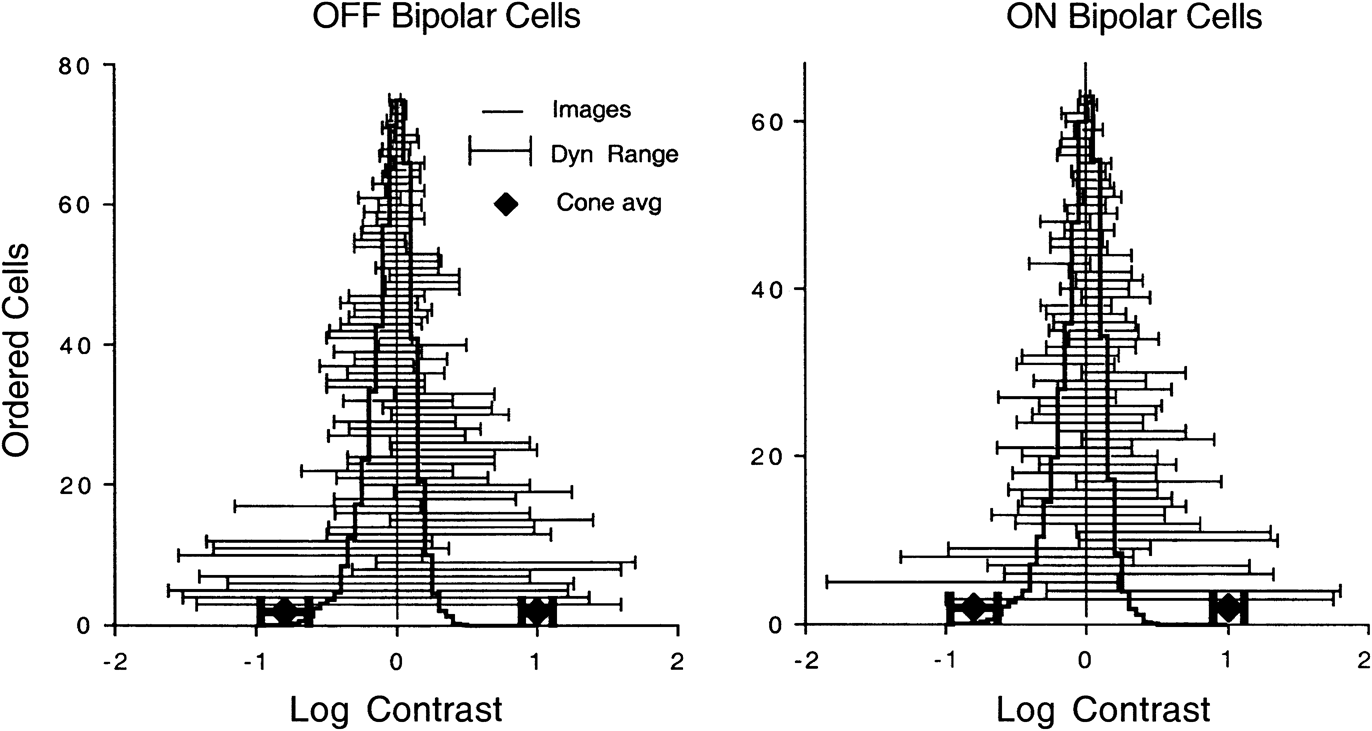
The extent and symmetry of the dynamic range of the contrast–response curves of both classes of bipolar cells varied greatly from cell to cell. On further analysis, we find that the dynamic range of the bipolar cell population brackets the distribution of contrasts found in natural images as shown in Fig. 4. This apparent substrate for distributed encoding is established at the bipolar cell level since it is not found in cones. The ability to selectively encompass the effective range of contrasts in nature may have been the evolutionary force behind the establishment of distributed encoding in bipolar cells.
The distribution of dynamic range of the contrast responses for a population of ON and OFF bipolar cells compared to the contrasts in natural images. The heavy lines show the average distribution of natural images. The thin horizontal lines show the dynamic range that encompasses 10–90% of the contrast response of bipolar cells (see Fig. 1). Cells are ordered in ascending order from those with the largest to smallest dynamic range. Diamonds show the average contrast range for cones. Error bars for cones are standard deviations. Adapted from fig. 10 of Burkhardt et al. (Reference Burkhardt, Fahey and Sikora2006) with permission from Cambridge University Press.

With respect to the natural environment and images, if is of particular interest that the tiger salamander goes through two life stages, an aquatic phase followed by the land phase. Although the retina of the aquatic-phase salamander has been studied extensively for some four decades by many investigators, no reports were known for land-phase animals. We found, on average, that the contrast–response curves of ON and OFF bipolar cells in the land-phase animals were remarkably similar to those of aquatic-phase animals (Burkhardt et al., Reference Burkhardt, Fahey and Sikora2006). Thus, the primary retinal mechanisms mediating contrast coding in the outer retina remain functionally stable as the salamander evolves from the aquatic to the land phase.
Center–surround organization
Center–surround organization, long recognized as fundamental to the design of vertebrate retinas since its discovery in ganglion cells in 1953 (Kuffler, Reference Kuffler1953), is established in bipolar cells (Werblin & Dowling, Reference Werblin and Dowling1968; Wunk & Werblin, Reference Wunk and Werblin1979; Witkovsky & Stone, Reference Witkovsky and Stone1987; Dacey et al., Reference Dacey, Packer, Diller, Brainard, Peterson and Lee2000). We believe that our work (Fahey & Burkhardt, Reference Fahey and Burkhardt2003) is the first to systematically investigate the full contrast–response curves for both negative and positive contrasts for both center and surround. In our sample, the size of the center ranged from about 100–500 μm in diameter across the bipolar population in both ON and OFF bipolars (see also Hare & Owen, Reference Hare and Owen1990; Zhang & Wu, Reference Zhang and Wu2009). The size of the receptive field center was not obviously correlated with the cell’s contrast gain. The response of the receptive field surround was evoked with a concentric annulus whose dimensions were adjusted to optimally isolate the surround mechanism. For both ON and OFF bipolar cells, remarkably similar responses were observed for the center and surround when comparisons were made between responses of the same response polarity and thus responses to opposite contrast polarity. As a rule, the form of the contrast–response curves for center and surround approximated symmetrical mirror images of each other. In short, the contrast gain and C50 were quantitatively similar for center and surround when comparisons were made for responses of the same response polarity. The similarity in contrast gain may be due to differential weighting of feedback from horizontal cells to cones as discussed in detail in Fahey and Burkhardt (Reference Fahey and Burkhardt2003). In very recent work, we have found that sinusoidal modulation of contrast in the center and the surround yields remarkably similar modulation–response curves. Both are well fit (r 2 = 0.96) by the single-site binding equation, R = M/(M + k), where R is the normalized response amplitude and M is the magnitude of modulation. The semisaturation constant, k, varies from cell to cell but in a given cell is virtually identical for the center and surround response.
For measurements based on the response of contrast steps to centered spots and concentric annuli of optimum dimensions, the strength of the surround ranged from about 50–155% of the center depending on the cell and response polarity. A similar range has been reported for primate bipolar cells (Dacey et al., Reference Dacey, Packer, Diller, Brainard, Peterson and Lee2000). We found that the response of the surround was delayed by about 50 ms with respect to that of the receptive field center, a finding consistent with the common view that the surround response is mediated by slower mechanisms than that of the center. The cone voltage showed no evidence for center–surround antagonism (Fahey & Burkhardt, Reference Fahey and Burkhardt2003) in agreement with Hare and Owen (Reference Hare and Owen1992). This finding is compatible with the view that surround antagonism is due to modulation of calcium currents in the cone pedicle due to feedback from horizontal cells and is not normally detectable in the cone photovoltage (Cadetti & Thoreson, Reference Cadetti and Thoreson2006; Thoreson et al., Reference Thoreson, Babai and Bartoletti2008) . In about one third of 28 ON bipolar cells, we found that AP-4 eliminated the response of both the center and the surround, as expected if feedback is the sole source of surround antagonism. In the other two thirds, the center response was eliminated, while the surround was either partially reduced or unaffected. We thus suggested that the relative contribution of the feedback pathway (horizontal cell to cones) to the bipolar surround may vary in a distributed manner across the ON bipolar cell population and that mechanisms other than feedback may be responsible for surround antagonism in some ON bipolar cells. This result with AP-4 has recently been confirmed, and it has been suggested that there may be as many as three mechanisms other than feedback that contribute to the surround (Zhang & Wu, Reference Zhang and Wu2009).
Luminance contrast versus color-opponent responses
Of all the bipolar cells that were screened for spectral response to 530- and 630-nm flashes in the light-adapted retina, none were found to generate color-opponent responses. Therefore, luminance contrast seems the overwhelmingly dominant factor for visual encoding by salamander bipolar cells. It is our working hypothesis that this probably holds generally for bipolar cells in other amphibians and in most mammals as well. To our knowledge, there are as yet no findings of color-opponent bipolar cells in primate or mammalian retinas (Li & DeVries, Reference Li and DeVries2006), although blue–yellow opponency has recently been found in blue-sensitive cones of Old World monkeys (Packer et al., Reference Packer, Verweij, Li, Schnapf and Dacey2010). On the other hand, it is well documented that color-opponent bipolar cells are present in fish and turtle retinas (for review, see Toyoda & Shimbo, Reference Toyoda, Shimbo, Toyoda, Murakami, Kaneko and Saito1999).
ON versus OFF bipolar cells
In sum, our measurements show rather striking similarity in the response of ON and OFF bipolar cells. In the main, this holds for both small (contrast gain) and large contrasts. The results of Fig. 2 imply that any differences in intrinsic mechanisms for light adaptation in ON and OFF bipolar cells, on balance, lead to functionally similar effects. Minor differences have been observed in the maximum response range, with OFF cells exceeding ON cells, and in the symmetry of the growth of the response range with light adaptation (Fahey & Burkhardt, Reference Fahey and Burkhardt2001). There is a very clear difference in response latency in the light-adapted retina (Burkhardt et al., Reference Burkhardt, Fahey and Sikora2007, fig. 3 and table 1). These measurements extend past findings for flashes in the dark-adapted retina (Nelson, Reference Nelson1973; Frumkes & Miller, Reference Frumkes and Miller1978; Copenhagen et al., Reference Copenhagen, Ashmore and Schnapf1983; Rieke, Reference Rieke2001) and are compatible with the view that the existence of a G-protein second messenger cascade in ON bipolar cells (Snellman et al., Reference Snellman, Kaur, Shen and Nawy2008; Koike et al., Reference Koike, Obara, Uriu, Numata, Sanuki, Miyata, Koyasu, Ueno, Tani, Ueda, Kondo, Mori, Tachibana and Furkawa2010) may be responsible for the longer latency along with differences in calcium flux kinetics in dendrites (Rieke, Reference Rieke2001). It has recently been suggested that the latency difference may provide the basis for a neural code based on first spike latency at the ganglion cell level in tiger salamander (Gollisch & Meister, Reference Gollisch and Meister2010).
To our knowledge, there are as yet no reports in mammalian preparations for a latency difference in ON versus OFF bipolar cells. Assuming a Q10 of about three, relative to the 30 ms difference, we have found in the salamander at 23°C, the latency difference in warm-blooded retinas would be expected to be about 8 ms and thus might be difficult to detect experimentally.
Our quantitative evidence for the similarity of contrast processing for ON and OFF bipolars is somewhat surprising but we submit well documented. As the first to examine the responses to both contrast polarities across the bipolar population, our results show that there are many ON cells that respond more strongly to negative than positive contrasts and many OFF cells that respond more strongly to positive than negative contrast. Thus, the optimal contrast polarity for driving bipolar cells may depend as much on the specific bipolar cell as the generic class to which it belongs. If the ON and OFF pathways are truly the substrate for selective processing of negative and positive contrasts, this dichotomy may depend primarily on selective connections and mechanisms beyond the bipolar cells.
Cones versus bipolar cells
Overall, our studies provide evidence for 11 transformations that occur between the level of the voltage response of cones and bipolar cells: 1) With light adaptation, the contrast gain of bipolars increases about 7 times, while the cones only increase by 3 times. 2) The contrast gain of bipolar cells for small signals is as much as 10–15 times greater than that of cones. 3) The contrast–response curve for bipolars is very steep around zero contrast, accounting for the very high contrast gain but the response then approaches saturation at moderate contrasts that still lie within the linear range for cones. The contrast–response curve for cones is shallow and remains approximately linear for responses spanning ±20% of the maximum response. 4) For sinusoidal modulation, the bipolar cell response is linear with high gain for small contrasts but then quickly approaches saturation and shows marked harmonic distortion, whereas the cones are low gain with a linear response over nearly the entire range of modulation. 5) Overall, the temporal transfer function of bipolars is predominantly low pass with somewhat greater high-frequency attenuation than that of cones. The derived transfer from cone to bipolar voltage approximates a cascade of three isolated low-pass filters resulting in corner frequencies of about 3.2 and 4 Hz for ON and OFF cells, respectively (Burkhardt et al., Reference Burkhardt, Fahey and Sikora2007, fig. 9). These results for cone → bipolar transmission are surprisingly similar to recent results for rod → bipolar transmission in salamander slice preparations (Armstrong-Gold & Rieke, Reference Armstrong-Gold and Rieke2003; W.B. Thoreson, personal communication). These and other findings suggest that the rate of vesicle replenishment rather than the rate of release may be a common factor limiting signal transmission from rods and cones to bipolar cells (Rabl et al., Reference Rabl, Cadetti and Thoreson2006; Burkhardt et al., Reference Burkhardt, Fahey and Sikora2007; Jackman et al., Reference Jackman, Choi, Thoreson, Rabl, Bartoletti and Kramer2009). 6) The transmission delay from cones to the bipolar response is about 30 ms for OFF bipolars and 60 ms for ON bipolars. 7) The contrast response of long-wave cones varies little from cone to cone (Burkhardt & Fahey, Reference Burkhardt and Fahey1998; Fahey & Burkhardt, Reference Fahey and Burkhardt2001), but there is a striking diversity within both ON and OFF classes of bipolar cells. However, there is no evidence for discrete cell subtypes for contrast processing and thus, the differences from cell to cell seem to fall along a continuum. 8) The dynamic contrast range of the bipolar cell population brackets the distribution of contrasts found in natural images in a manner consistent with distributed coding across the population, whereas the dynamic range of cones is broad with little variation from cone to cone. 9) For moderate and large contrasts, the responses of cones are invariably positive contrast dominant, whereas some bipolar cells are negative contrast dominant. Therefore, some bipolar cells act to enhance negative contrast. 10) Under optimal conditions of light adaptation, the response of bipolar cells approximates the matched amplification principle of efficient coding of contrast in natural images but cones do not. 11) The cone photovoltage shows no detectable center–surround antagonism unlike the voltage response of bipolar cells, whereas the strength of the surround ranges from about 50–150% of the center across the population.
The differences in contrast processing described above depend on transformations that occur between the recorded photovoltage of cones and the postsynaptic voltage of bipolar cells. The basis for these transformations could include 1) the relation between the cone voltage and transmitter release, 2) the rate of transmitter replenishment, 3) interactions between the cone transmitter and the synaptic receptors of bipolar cells, and 4) mechanisms intrinsic to bipolar cells. This list is not necessarily exhaustive or mutually exclusive (Thoreson, Reference Thoreson2007). For the present, it is sufficient to propose that multiple underlying mechanisms may shape the striking properties of contrast processing in bipolar cells highlighted in the present minireview. To identify, sort out, and quantify the contribution of the underlying mechanisms pose an important and challenging task for future research. There is also a need to obtain quantitative measurements of contrast processing by bipolar cells in light-adapted mammalian retinas to determine the generality of the findings summarized here for the tiger salamander retina.
Acknowledgments
I am deeply grateful to my longtime colleagues, Patrick K. Fahey and Michael A. Sikora, for their invaluable contributions. The research summarized in this review was supported by NIH grant EY00406.