


INTRODUCTION
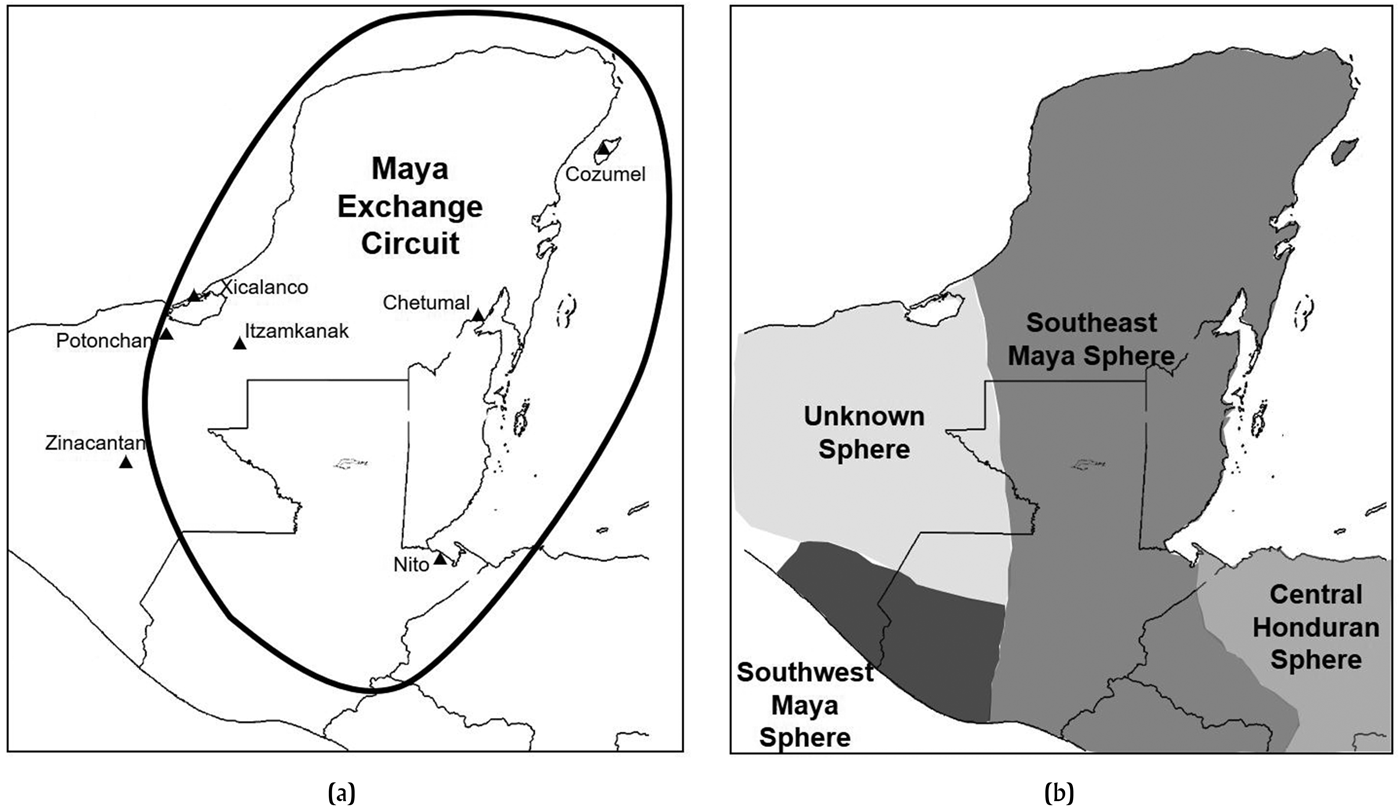
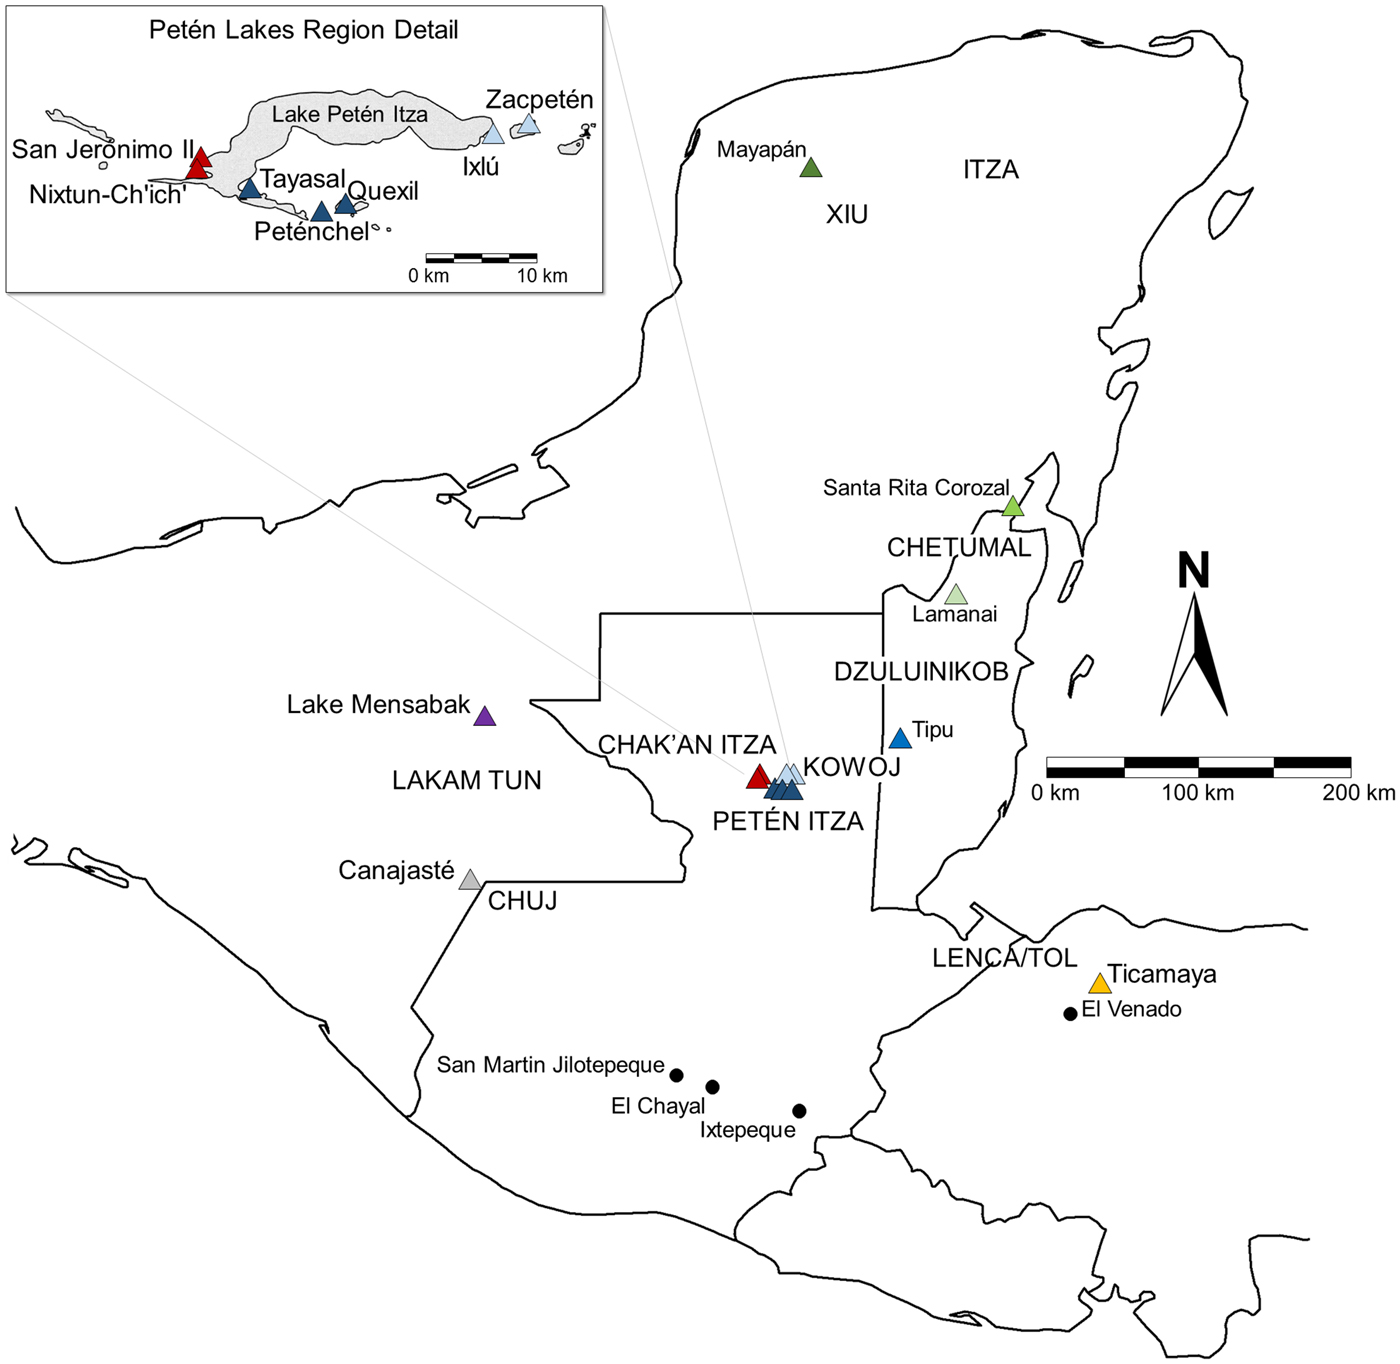
The presence of widespread material exchange in the archaeological record has prompted archaeologists to search for appropriate theoretical models to explain long distance commerce and interactions. In the last two decades, studies of Late Postclassic period (a.d. 1350–1525) political economies in the area known as Mesoamerica have been increasingly characterized by macroregional models of production and exchange that emphasize “international” relationships among polities (Blanton and Fargher Reference Blanton, Fargher, Babones and Chase-Dunn2012; Kepecs Reference Kepecs, Smith and Berdan2003, Reference Kepecs, Kepecs and Alexander2005, Reference Kepecs, Kowalski and Kristan-Graham2007; Kowalewski Reference Kowalewski, Matejowsky and Wood2012; Masson Reference Masson, Smith and Berdan2003; Paris Reference Paris2008; Simmons et al. Reference Simmons, Pendergast and Graham2009; Smith Reference Smith, Kedar and Wiesner-Hanks2015; Smith and Berdan Reference Smith, Berdan, Smith and Berdan2003a; Vail and Hernandez Reference Vail, Hernández, Vail and Hernandez2011). Researchers have previously characterized the Postclassic Maya lowlands as an exchange circuit: a subregion of the Mesoamerican “world” where intensified contacts took place (Figure 1). This includes the widespread horizontal distribution of raw materials and finished products across political boundaries, often through international trade centers (Smith and Berdan Reference Smith, Berdan, Smith and Berdan2003b:29–30). Despite numerous studies (Braswell Reference Braswell, Smith and Berdan2003; Golitko et al. Reference Golitko, Meierhoff, Feinman and Ryan Williams2012; Golitko and Feinman Reference Golitko and Feinman2015), current research has yet to focus on the production and circulation of finished stone tools in Postclassic Lowland economies. How uniform (or horizontally integrated) was the movement of finished goods and obsidian among the Postclassic Maya given their diverse political structures (Figure 2)
Previously proposed characterizations of lowland Maya exchange patterns: (a) Maya exchange circuit as segment of the Mesoamerican world-system (redrawn from Smith and Berdan Reference Smith, Berdan, Smith and Berdan2003b:Figure 3.5); (b) Late Postclassic obsidian exchange spheres (redrawn from Braswell Reference Braswell, Smith and Berdan2003:Figure 20.4).

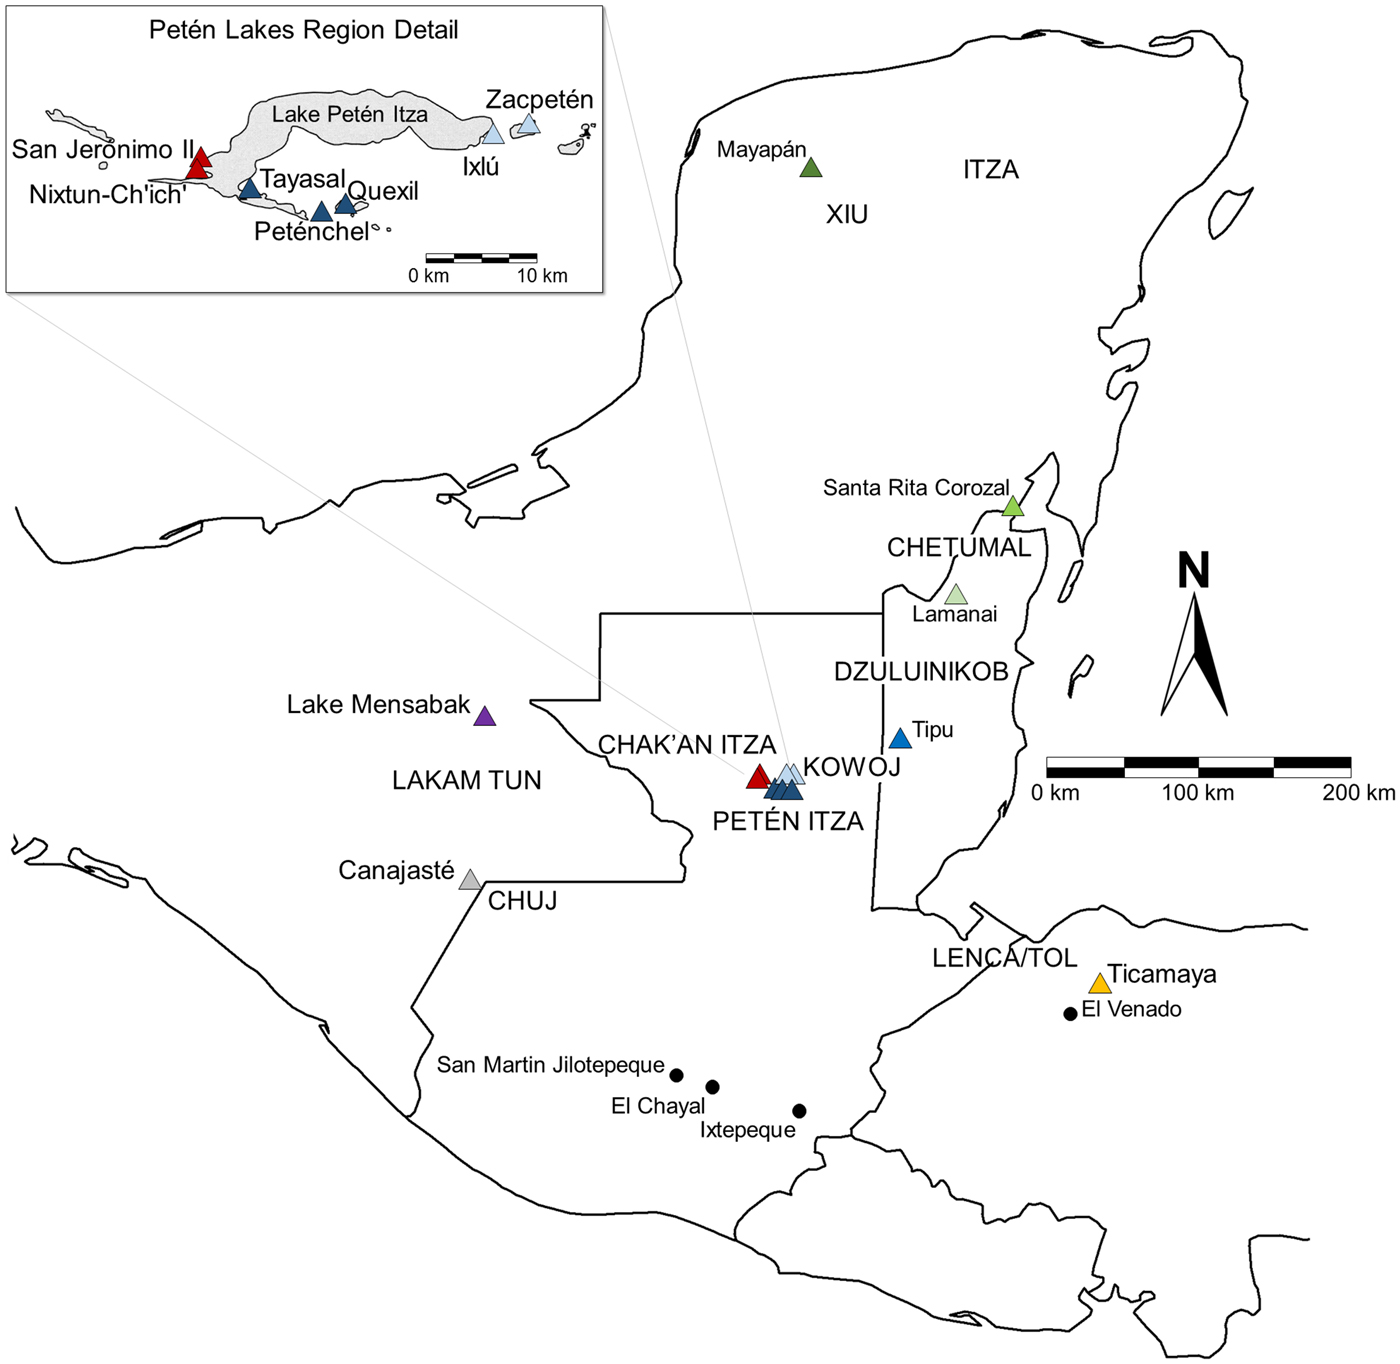
Detail of the Maya region with Late Postclassic sites (triangles), ethnopolitical affiliations (caps), and major obsidian flows (circles) mentioned in the text. Modified from base maps produced by Brown and Witschey (Reference Brown and Walter2008).
In this study, the proposed Maya exchange circuit is examined in light of recent data and new methods of obsidian analysis including social network analysis (SNA) applications. The organization is twofold, and includes: 1) using portable x-ray fluorescence (pXRF) and visual determination to assign volcanic sources to a large sample of small obsidian projectiles and debitage and manufacturing debris; and, 2) conducting one-mode and two-mode SNA by examining obsidian source differences among sites. Methods are derived and modified from a growing body of recent work that applies SNA to archaeological assemblages (Golitko et al. Reference Golitko, Meierhoff, Feinman and Ryan Williams2012; Golitko and Feinman Reference Golitko and Feinman2015; Mills et al. Reference Mills, Clark, Peeples, Haas, Roberts, Brett Hill, Huntley, Borck, Breiger, Clauset and Steven Shackley2013; Phillips Reference Phillips2011). Such applications reveal complex inter-polity patterns of production and circulation that have not been accounted for in current regional models, often relating to factions and alliances of Postclassic Maya groups.
Obsidian Exchange
As a material, obsidian has been characterized as a “necessity” for the Lowland Maya (Smith Reference Smith, Smith and Berdan2003:122) and played a significant role in the political economies of Mesoamerica. Because obsidian exists only in the volcanic highland regions of Guatemala and Mexico, it can provide direct information about imported materials and finished goods at a given site. Obsidian that was traded over long distances includes the Guatemalan sources of Ixtepeque, El Chayal, and San Martin Jilotepeque as well as Pachuca, Zaragoza, Guadalupe Victoria, Altotongo, Zinapecuaro, and Ucareo from central Mexico (Santley Reference Santley and Miller1983:91; see Braswell Reference Braswell, Smith and Berdan2003:Figure 20.1). Several smaller flows have been identified in the area of western Honduras, such as El Venado (Aoyama Reference Aoyama1999:19; Blaisdell-Sloan Reference Blaisdell-Sloan2006:241), but it is presumed that such source areas were not exploited for widespread exchange. Previous research suggests geopolitical and temporal differences in source exploitation. For example, a major source of Middle Preclassic period (1000–400 b.c.) obsidian in the lowlands was San Martin Jilotepeque (Braswell Reference Braswell, Masson and Freidel2002:293); several Middle Preclassic sites in the lowlands, however, procured obsidian from El Chayal such as Ceibal (Aoyama Reference Aoyama2008:46) and Cahal Pech (Awe and Healy Reference Awe and Healy1994:202). Later Classic period polities like Tikal, Palenque, Piedras Negras, and Calakmul relied heavily on the Chayal flow (Braswell Reference Braswell, Masson and Freidel2002; Hruby Reference Hruby2006:109; Moholy-Nagy et al. Reference Moholy-Nagy, James Meierhoff and Kestle2013; Santley Reference Santley and Miller1983:93), although inhabitants of the Copan valley procured mostly Ixtepeque obsidian due to its proximity to the source area (Aoyama et al. Reference Aoyama, Tashiro and Glascock1999:244).
In Petén, Guatemala, the onset of the Terminal Classic marked the beginning of increased use of Ixtepeque obsidian (Rice Reference Rice1984:193) and the appearance of Zaragoza and Ucareo obsidian from Mexico in greater quantities (Moholy-Nagy Reference Moholy-Nagy2003:302). Two distinct obsidian exchange spheres have been proposed during the Late Postclassic: the Southeast Maya sphere and the Southwest Maya sphere (see Figure 1b). Procurement patterns to the west (Chiapas and Tabasco) are unknown (Braswell Reference Braswell, Smith and Berdan2003:152–154). Of the two proposed spheres, the largest is the Southeast Maya sphere, which includes the entirety of northern Yucatan stretching through Petén, Belize, Honduras, and El Salvador (Braswell Reference Braswell, Smith and Berdan2003:152). The predominant source of the Southeast sphere is Ixtepeque and research suggests peninsular trade may have been controlled by Mayapan (Braswell Reference Braswell, Smith and Berdan2003:155). Recent network-based visualizations resemble such characterizations, with the exception of El Salvador (Golitko et al. Reference Golitko, Meierhoff, Feinman and Ryan Williams2012:Figure 10; Golitko and Feinman Reference Golitko and Feinman2015:Figures 13 and 14). The Southwest Maya sphere—located largely in southeastern Mexico and southwestern Guatemala—is defined by a heightened use of central Mexican sources, particularly Pachuca and Pico de Orizaba (Braswell Reference Braswell, Smith and Berdan2003:154; Clark et al. Reference Clark, Lee, Salcedo Romero and Voorhies1989). Guatemalan sources appear in this sphere as well and it is possible that this sphere is temporally sensitive to Aztec presence in the Xoconochco vicinity (Braswell Reference Braswell, Smith and Berdan2003:154).
Ethnopolities and the Postclassic Lowland Maya
The Lowland Maya region was not politically, linguistically, or culturally homogeneous, and contact-period accounts, indigenous Mayan texts, and archaeological studies suggest that complex social identities existed in adjacent territories (Figure 2). Throughout this study, the term “ethnopolity” is used to describe the various forms of Postclassic Maya social organization that were defined by combinations of political leadership, self-identified descent, and language. Spanish documents reveal emic distinctions among Maya ethnopolities that were frequently in conflict with one another, or struggling for regional power (Avendaño y Loyola Reference Avendaño y Loyola, Bowditch and Rivera1987[1696]; Cano Reference Cano1984; Jones Reference Jones1989, Reference Jones1998; Landa in Tozzer Reference Tozzer1941).
This study focuses on ethnopolities from four geographical areas: 1) Yucatan, Mexico, which includes the Mayas known as the Xiw and Itza, frequently at odds with each other; 2) central Petén, Guatemala, known to include the territories of the rivalrous Petén Itzá, Kowoj, and Chak'an Itza; 3) Belize, which encompasses the area of the Chetumal, the New River System or Dzuluinikob area, and Mopan speakers; 4) Chiapas, Mexico, which includes the Western Mayas known as the Lakam Tun (Lacandon) and the Chuj; and, 5) Department of Cortes, Honduras which includes an area thought to be occupied by Lenca/Tol speaking populations with strong connections to coastal Mayas (Figure 2). The culture histories of each of these political groups are too complex and lengthy to fully detail here (see Alexander Reference Alexander, Kepecs, Kepecs and Alexander2005; Blaisdell-Sloan Reference Blaisdell-Sloan2006; Blake Reference Blake2010; Cecil Reference Cecil2001; Chase and Chase Reference Chase and Chase1988; Edmonson Reference Edmonson1982; Graham Reference Graham2011; Graham et al. Reference Graham, Pendergast and Jones1989; Jones Reference Jones1989, Reference Jones1998; Masson Reference Masson2000; Masson and Peraza Lope Reference Masson and Peraza Lope2014; Meissner Reference Meissner2014; Milbrath and Peraza Lope Reference Milbrath and Peraza Lope2003; Okoshi Reference Okoshi2000; Palka Reference Palka2009; Pugh Reference Pugh2001; Rice and Rice Reference Rice, Rice, Kepecs and Alexander2005, Reference Rice and Rice2009; Scholes and Roys Reference Scholes and Roys1948; and Schwarz Reference Schwarz2009).
In spite of these political divisions, the Mesoamerican Postclassic period is seen as a time of heightened international economies, characterized as a world-system and defined by frequent interpolity interactions, information sharing, and intensified long distance exchange of raw materials across political boundaries (Smith and Berdan Reference Smith, Berdan, Smith and Berdan2003a:6–8). The Postclassic Maya exchange circuit is one sector of the larger macroregional model and represents a “mini-world” of exchange of finished goods and materials (see Figure 1a; Smith and Berdan Reference Smith, Berdan, Smith and Berdan2003a:29–30). Such goods may have included lithic raw materials, jade, ceramics, effigy incensarios, lacustrine products, cotton, textiles, animal pelts, honey, wax, feathers, dyes, paints, vanilla, achiote, cacao, copal, wooden canoes, and paddles (Caso Barrera and Aliphat Reference Caso Barrera and Aliphat2002, Reference Caso Barrera and Aliphat2006; Kepecs Reference Kepecs, Smith and Berdan2003:266–267; Rice and Cecil Reference Rice, Cecil, Rice and Rice2009a:328; Smith and Berdan Reference Smith, Berdan, Smith and Berdan2003b:28). In many respects, debates over regional and macroregional modeling are still relevant as new models have not been thoroughly investigated or proposed for the Postclassic Maya lowlands. Thus, this study serves to examine existing models through additional data and advanced methods of analysis.
MATERIALS
Sample
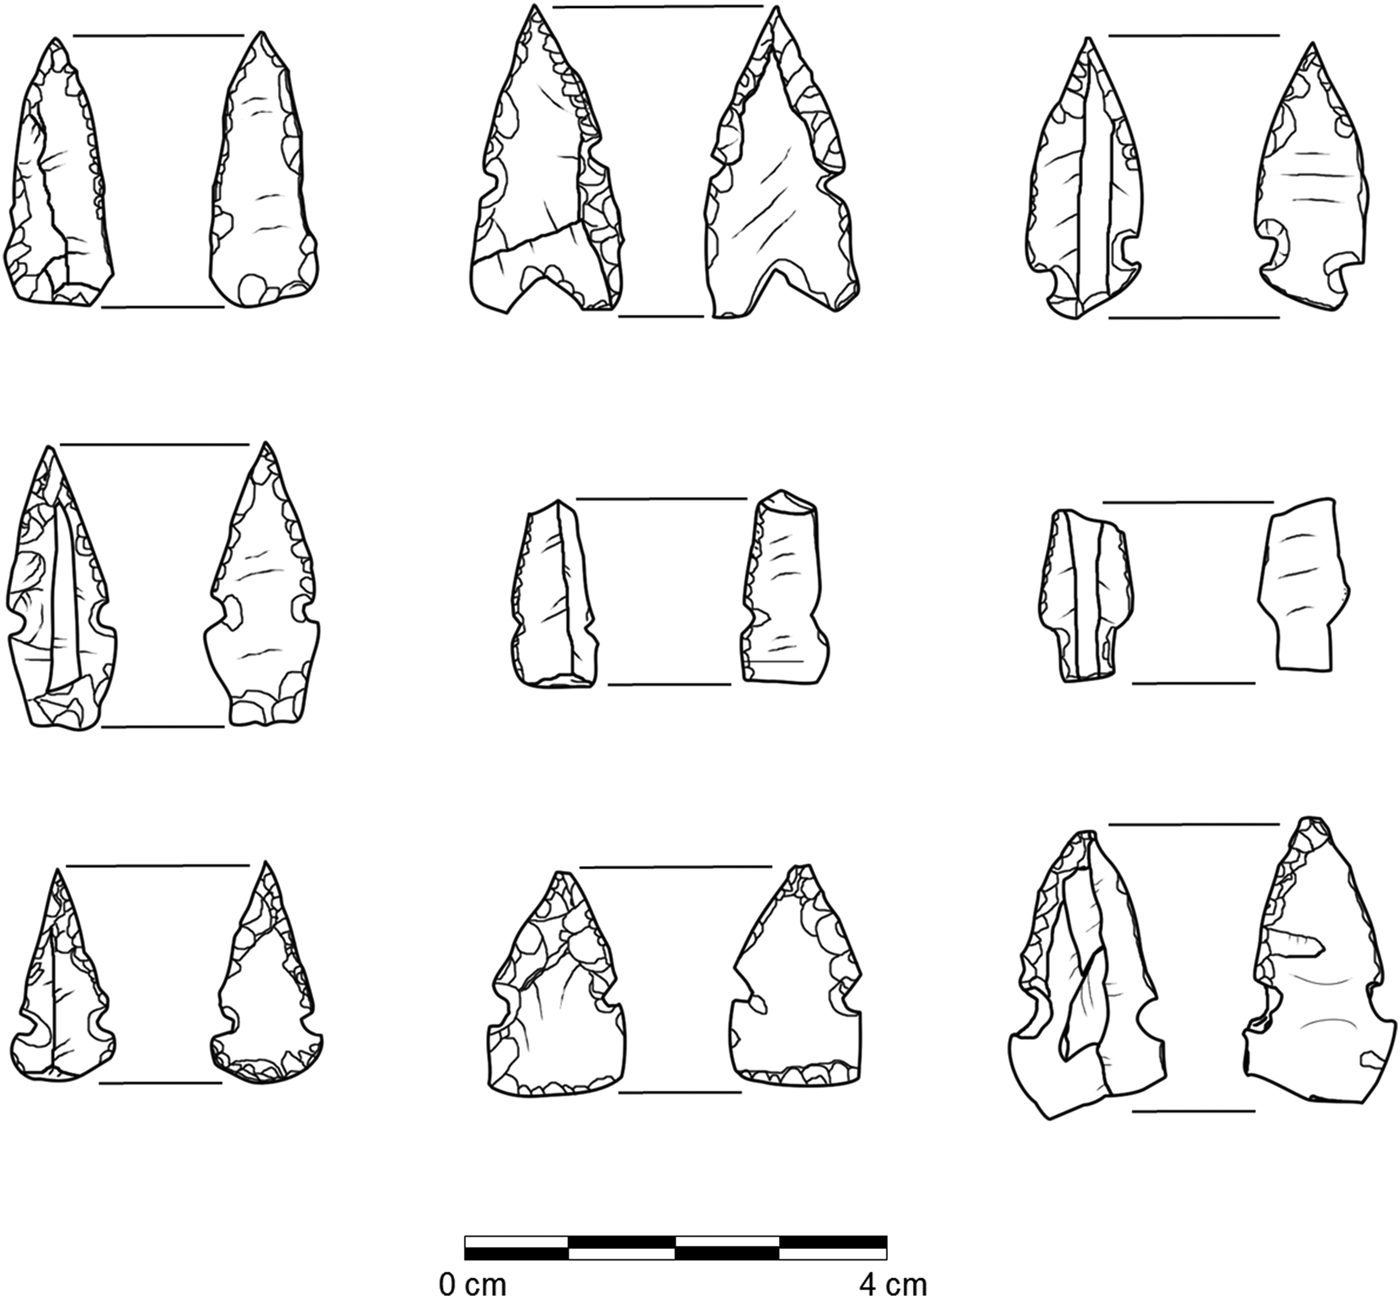
Small obsidian projectiles were typically used as arrow tips (Figure 3) and were specifically chosen for this study due to their widespread recovery in a range of non-elite to elite contexts. Ethnohistoric information suggests arrow point manufacture was often integrated with larger political processes that included tribute, exchange, or elite oversight (see Jones Reference Jones1989:166; Scholes and Roys Reference Scholes and Roys1948:344). Small points have been studied at many sites in the Maya region, often with respect to warfare (Aoyama Reference Aoyama2005; Blake Reference Blake2010; Graham Reference Graham and Thomas1991, Reference Graham2011; Simmons Reference Simmons1995), production variability (Masson Reference Masson2000; Meissner Reference Meissner2014, Reference Meissner, Rice and Rice2017; Paling Reference Paling2007; Proskouriakoff Reference Proskouriakoff and Pollock1962; Shafer and Hester Reference Shafer, Hester, Chase and Chase1988; Simmons Reference Simmons2002), and use (Meissner and Rice Reference Meissner and Rice2015). Recent research has examined related manufacturing debris and production locales of Postclassic points (Marino et al. Reference Marino, Martindale Johnson, Meissner and Walker2016; Oland Reference Oland2013). In terms of size and function, small points were almost certainly used as arrow tips, and macroscopic observation shows many have signs of impact damage (Meissner Reference Meissner2014:481–487). Most points measure between 1 to 3 centimeters long, weigh between 0.25 and 1.0 grams, and can be quantitatively distinguished from larger atlatl darts and spear points.
Dorsal (left side) and ventral (right side) views of small obsidian points from Nixtun-Ch'ich', Petén, Guatemala. Drawings by the author.

The precise dating of Late Postclassic projectile points is notoriously difficult due to a relative lack of stratified deposits in the lowland region and the uneven nature of Spanish contacts and Maya resistance throughout the area. The vast majority of points were recovered from residential contexts and are typically found within the uppermost levels of the final occupation of sites. A detailed discussion of the archaeological recovery of points can be found in Meissner (Reference Meissner2014:400–427).
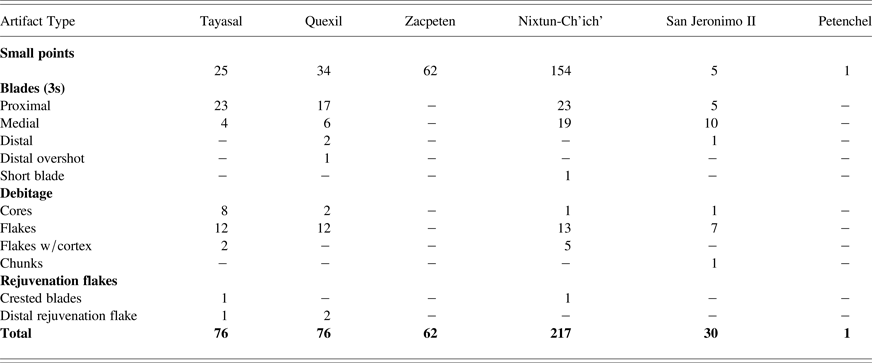
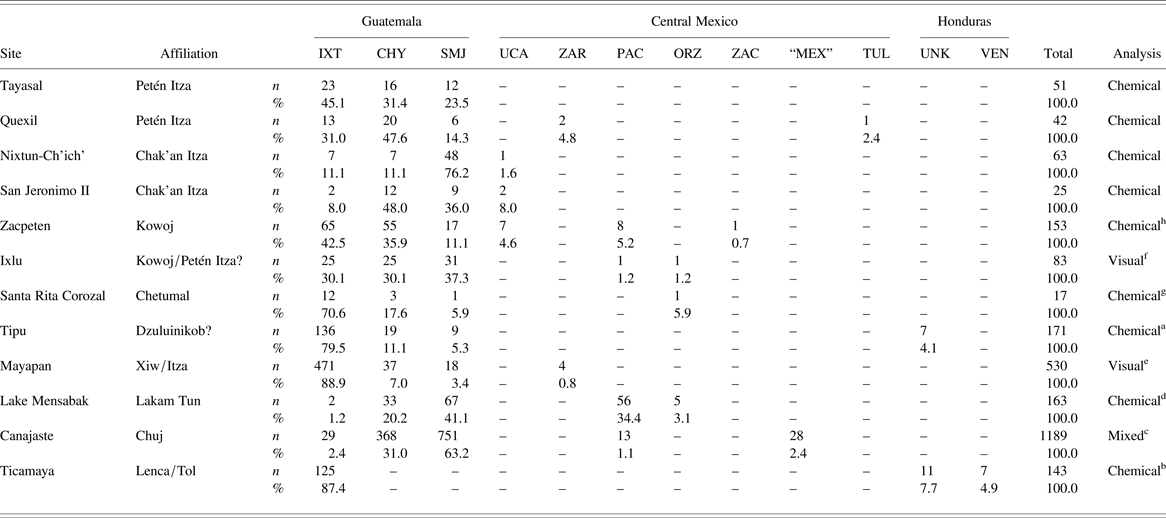
The total sample used for this study incorporates all known provenance data from lowland Maya Postclassic point assemblages, including 796 small points and 2,630 pieces of debitage/debris from 14 different sites (Meissner Reference Meissner2014). Of the total point sample, 281 points and 214 pieces of debris (total n = 495) from six contemporaneous Petén Lakes sites were subjected to pXRF analysis by the author. This sample includes obsidian from the sites of Tayasal, Quexil, Petenchel, Nixtun-Ch'ich', San Jeronimo II, and Zacpeten (Table 1, see Figure 2). Debitage and debris consisting of flakes, core maintenance debris, and 1s–3s blade fragments was almost exclusively from Postclassic contexts (n = 181), although a small sample (n = 33) was included from earlier test pits to establish a baseline chronology at Nixtun-Ch'ich’. Here, the term “debitage” is used loosely to refer not only to obsidian manufacturing waste but also to discarded blade fragments that were frequently used as blanks for the small projectile industry. Table 1 provides a summary of the number of obsidians subjected to pXRF by site and the artifact types sampled.
Obsidian samples from Late Postclassic contexts selected for pXRF analysis

Chronology
Materials used for this study originate from contexts dating roughly between a.d. 1350 and 1550. Chronologically, temporal overlap was present among the sites when comparing point contexts with associated ceramics and radiocarbon dates. In the Petén Lakes region, calibrated radiocarbon dates from Zacpeten included: cal. a.d. 1380–1440 (2σ, p = .689; Str. 602, Group A) and cal a.d. 1420–1520 (2σ, p = .917; Str. 732) (Pugh and Rice Reference Pugh, Rice, Rice and Rice2009a:110). Point contexts from Nixtun-Ch'ich dated between a.d. 1400–1525, as the uppermost layers of the site contain Itza-related Paxcaman ceramics with snail inclusion paste (Pugh et al. Reference Pugh, Rice, Nieto and Rice2016:4). Quexil structures with higher frequencies of points included Q5, Q18, and Q12. Structure Q18 had a calibrated radiocarbon date of cal a.d. 1420–1540 (2σ, p = .647) (Schwarz Reference Schwarz2009:425), with the remaining deposits associated with Late Postclassic polychrome ceramics (Schwarz Reference Schwarz2009:428). Points from Tayasal were largely from structures dating to the Late Postclassic and were not recovered in significant quantities from the Colonial area known as San Bernabe. Numerous Tayasal points were from Group 23 (Pugh et al. Reference Pugh, Rice, Nieto and Rice2012:10), which includes Late Postclassic Structure T52 (Shiratori Reference Shiratori, Pugh and Polo2012:43) and Structure T94. Structure T94 was associated with a reset stela shrine with numerous Late Postclassic ceramics, including composite censer fragments and Patojo Modeled sherds (Pugh et al. Reference Pugh, Sánchez Polo and Shiratori2012:9; Rice Reference Rice, Rice and Rice2009a).
To the north and east, the sites of Santa Rita Corozal, Tipu, Lamanai, and Mayapan all had contexts with small projectiles dating to Late Postclassic occupations, making them roughly contemporaneous with many of the Petén Lakes sites. Late occupation at Santa Rita Corozal is associated with the Xabalxab late facet phase (a.d. 1300–1550) and a radiocarbon date of a cache from point-bearing Structure 183 at Santa Rita Corozal resulted in a range of cal a.d. 1420–1655 (1σ, p = .935); other dates ranged slightly earlier from cal a.d. 1220–1400 (1σ) (Chase and Chase Reference Chase and Chase1988:11). Both Tipu and Lamanai have significant Late Postclassic occupation in addition to contact- and Colonial-period settlement. Lamanai is well-known for Late Postclassic offerings occurring around a.d. 1400–1450, although some could date slightly earlier to around a.d. 1250 (Graham Reference Graham2011:57). The sitewide appearance of bow and arrow weaponry may have occurred near the start of the Yglesias phase around a.d. 1450 (Graham Reference Graham, Awe, Morris and Jones2004). Unfortunately, recent radiocarbon results from Lamanai did not include a Yglesias-era sample, or data from Structure N9–56, a building thought to date between a.d. 1350–1544 (Hanna et al. Reference Hanna, Graham, Pendergast, Hoggarth, Lentz and Kennett2016:3). Tipu is known for its turbulent history between a.d. 1400 and 1700, and it is difficult to tease out terminal Late Postclassic from Contact period contexts due to strong indigenous cultural continuity before 1544 (Graham Reference Graham2011:50, 52).
Mayapan is strongly associated with Late Postclassic occupation, with more than 96 percent of sherds dating to this period (Peraza Lope et al. Reference Peraza Lope, Masson, Hare and Candelario Delgado Ku2006:155). Several radiocarbon dates from the thirteenth to fifteenth centuries were reported from contexts where small projectiles were found (Peraza Lope et al. Reference Peraza Lope, Masson, Hare and Candelario Delgado Ku2006). This included Str. Y-45a with a date of cal a.d.1340–1400 (2σ, p = .50), where a vessel was found with the glyph of K'atun 8 Ahau (a.d. 1441–1461) (Peraza Lope et al. Reference Peraza Lope, Masson, Hare and Candelario Delgado Ku2006:157, 161). The site of Canajaste had significant Late Postclassic occupation dating between 1250 and 1525, with early and late components of the Tan ceramic phase of the Upper Grijalva Region (Blake Reference Blake2010:60). Calibrated radiocarbon analysis revealed only a broad date range of cal a.d. 1150–1635 with no signs of occupation after 1525 (Blake Reference Blake2010:78). Recently discovered sites around the shores of Lake Mensabak include El Mirador, Tzibana, Los Olores, La Punta, and Noh K'uh. Late Postclassic ceramics (a.d. 1200–1500) were recovered from structures associated with small projectiles and bear similarities to other Postclassic ceramics throughout Chiapas, including Las Margaritas, Coapa, and sites located on the Soconusco plain (Deeb et al. Reference Deeb, Deeb, Kestle and Palka2011; Palka and Sanchez Balderas Reference Palka, Fabiola Sanchez Balderas, Lowe and Pye2012).
PORTABLE X-RAY FLUORESCENCE (pXRF)
Methods
PXRF analysis as a method of provenance determination has grown in popularity, particularly due to the relatively inexpensive cost, the internal accuracy of instruments, and the ability to create chemical profiles from large samples of data, especially obsidian (see Cecil et al. Reference Cecil, Moriarty, Speakman, Glascock, Glascock and Speakman2007; Ebert et al. Reference Ebert, Dennison, Hirth, McClure and Kennett2015; Meierhoff et al. Reference Meierhoff, Golitko and Morris2010; Millhauser et al. Reference Millhauser, Fargher, Heredia Espinoza and Blanton2015; Moholy-Nagy et al. Reference Moholy-Nagy, James Meierhoff and Kestle2013; Nazaroff et al. Reference Nazaroff, Prufer and Drake2010; Rice and Cecil Reference Rice, Cecil, Rice and Rice2009a for applications in Mesoamerica). Compositional data from the 495 samples were gathered using a Bruker Tracer III-V pXRF spectrometer at the Elemental Analysis Facility at the Chicago Field Museum. Detailed instrument configurations, calibrations, and procedures are outlined in Appendix A.
Following data collection, group designations were assigned based on centroid cluster analysis of the incompatible elements of rubidium (Rb), strontium (Sr), and zirconium (Zr). This form of cluster analysis calculates the minimum vector distance between two variables and the center (centroid). Such elements have proven to be some of the most effective to determine obsidian provenance in Mesoamerica (see Cecil et al. Reference Cecil, Moriarty, Speakman, Glascock, Glascock and Speakman2007). Chemical profiles were then assigned provenance based on previously published Mesoamerican source data from the Missouri University Research Reactor (Cobean et al. Reference Cobean, Vogt, Glascock and Stocker1991; Glascock and Cobean Reference Glascock and Cobean2002; Glascock et al. Reference Glascock, Braswell, Cobean and Steven Shackley1998).
Results
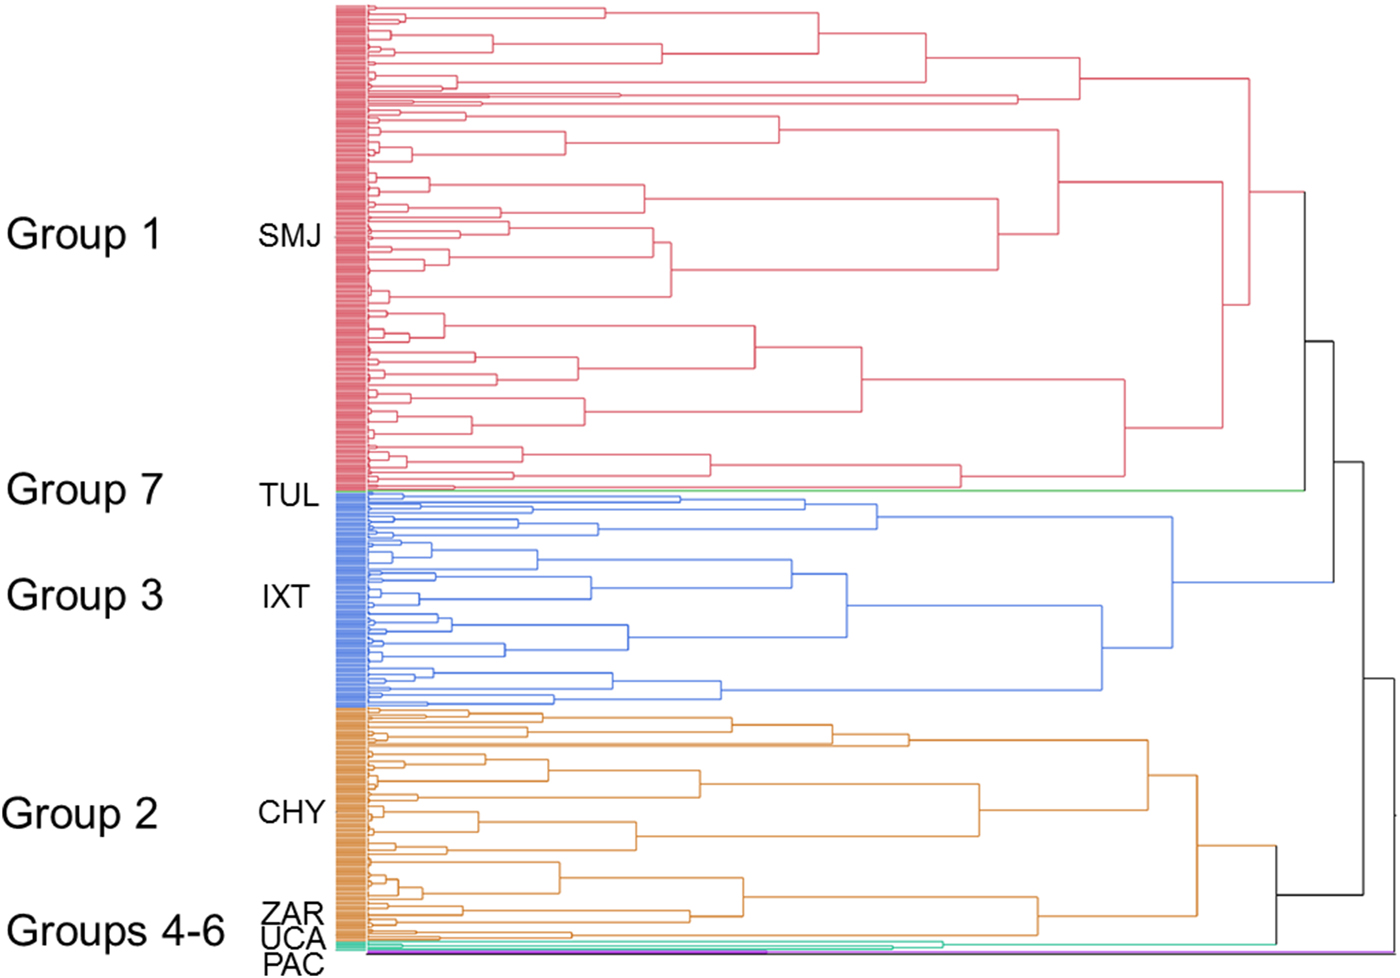
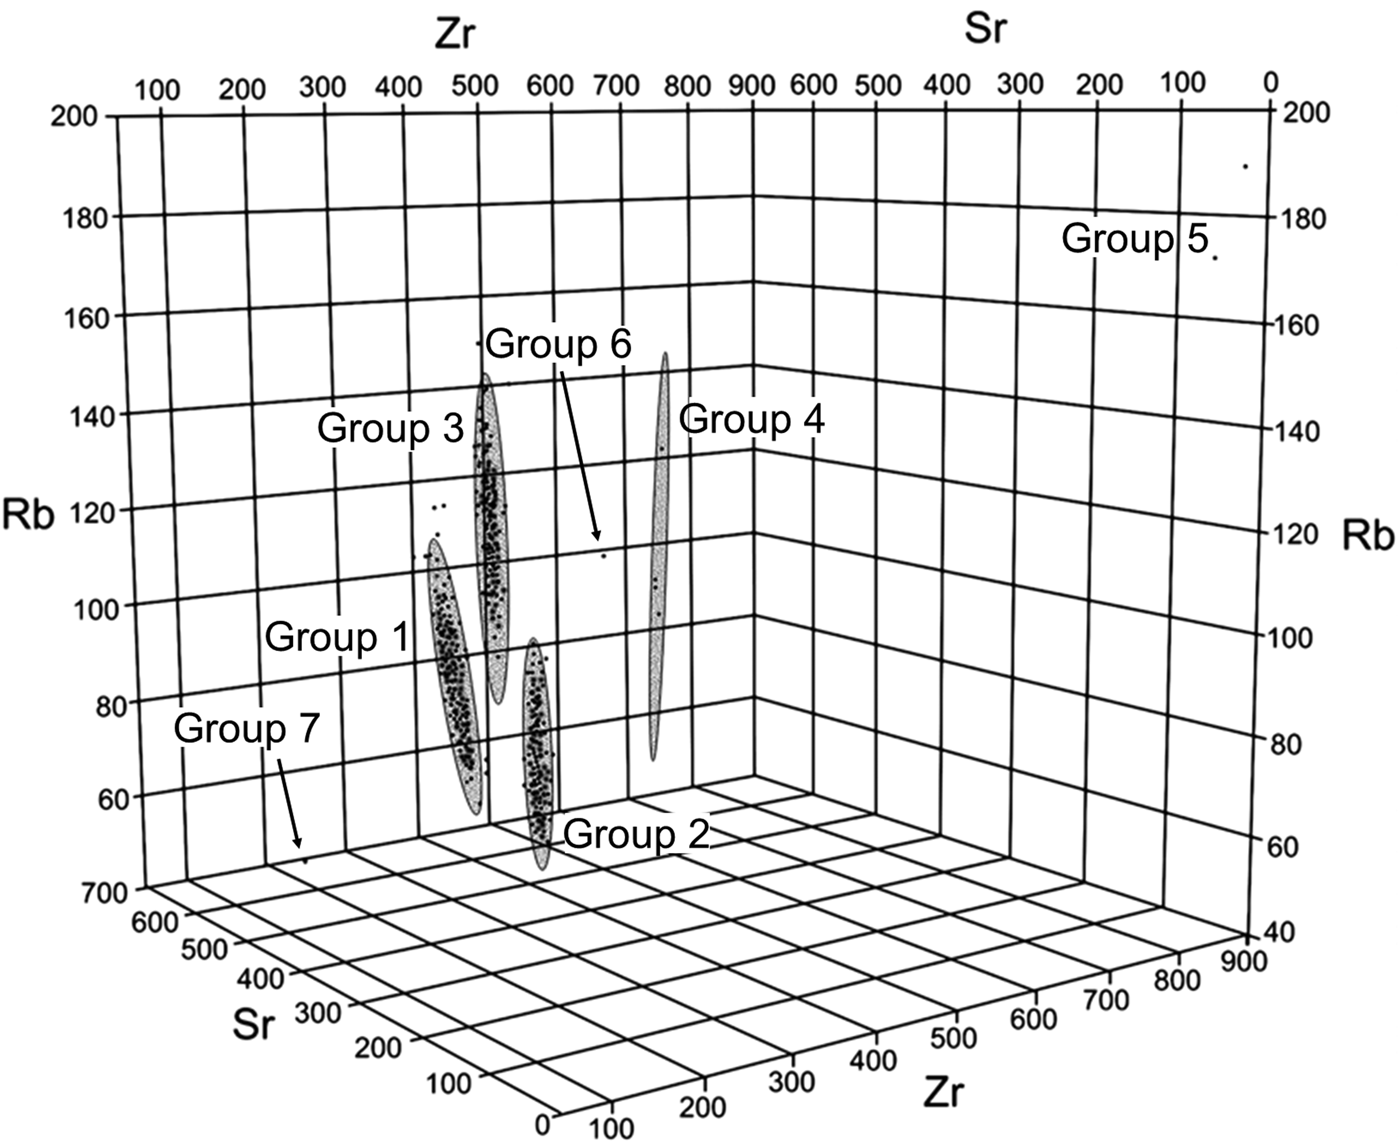
The resulting dendrogram and scatterplot (Figures 4 and 5) revealed seven distinct chemical groups using centroid clustering of Rb, Sr, and Zr values in ppm. These profiles were matched to previously known source data ranges (Cobean et al. Reference Cobean, Vogt, Glascock and Stocker1991; Glascock and Cobean Reference Glascock and Cobean2002; Glascock et al. Reference Glascock, Braswell, Cobean and Steven Shackley1998), allowing for the geological provenance of the artifacts to be assigned to a particular highland obsidian source.
Dendogram of trivariate Sr, Zr, and Rb clustering of pXRF sourced specimens with major groups marked.

Trivariate scatterplot of Sr, Zr, and Rb with three-dimensional 90 percent ellipses marking major clusters.

Of the 495 obsidian artifacts included for pXRF analysis, nearly all could be assigned to a particular source. Seven distinct flows were identified including the Guatemalan source areas of Ixtepeque, Chayal, and San Martin Jilotepeque and four from central Mexico including Zaragoza, Pachuca, Tulancingo, and Ucareo. A small percentage of artifacts plotted slightly outside of the 90 percent confidence ellipses when using the three elements (n = 7 or 1.4 percent; see Figure 5); the concentrations of these artifacts, however, plot quite close to their suspected density ellipses in a trivariate plot. This discrepancy is likely attributed to the thinness of these specimens, as thin specimens can inflate concentration readings. Thus, these provenance attributions were double-checked visually to ensure accuracy using visual criteria derived from Braswell et al. (Reference Braswell, Clark, Aoyama, McKillop and Glascock2000) but ultimately should be assessed using NAA.
Group assignments from the Guatemalan highlands (Figure 4) included: Group 1, which was assigned to San Martin Jilotepeque with relatively low concentrations of Zr and higher concentrations of Sr; Group 2, which was assigned to Chayal with lower amounts of Sr but similar concentrations of Zr; and Group 3 which was assigned to Ixtepeque with higher concentrations of Zr. At least four central Mexican sources were identified that include: Group 4, which was identified as Zaragoza with low levels of Sr; Group 5, which was a match to Pachuca with abnormally high levels of Zr; Group 6 with one representative sample matching Zr and Sr levels of Ucareo; and Group 7 with relatively low levels of Zr and high levels of Sr. To assign this group to a geological source, the elements of Fe and Mn were analyzed. High levels of Fe in the sample suggests an assignment to Tulancingo; future analysis, however, might consider the use of neutron activation analysis for confirmation of this group.
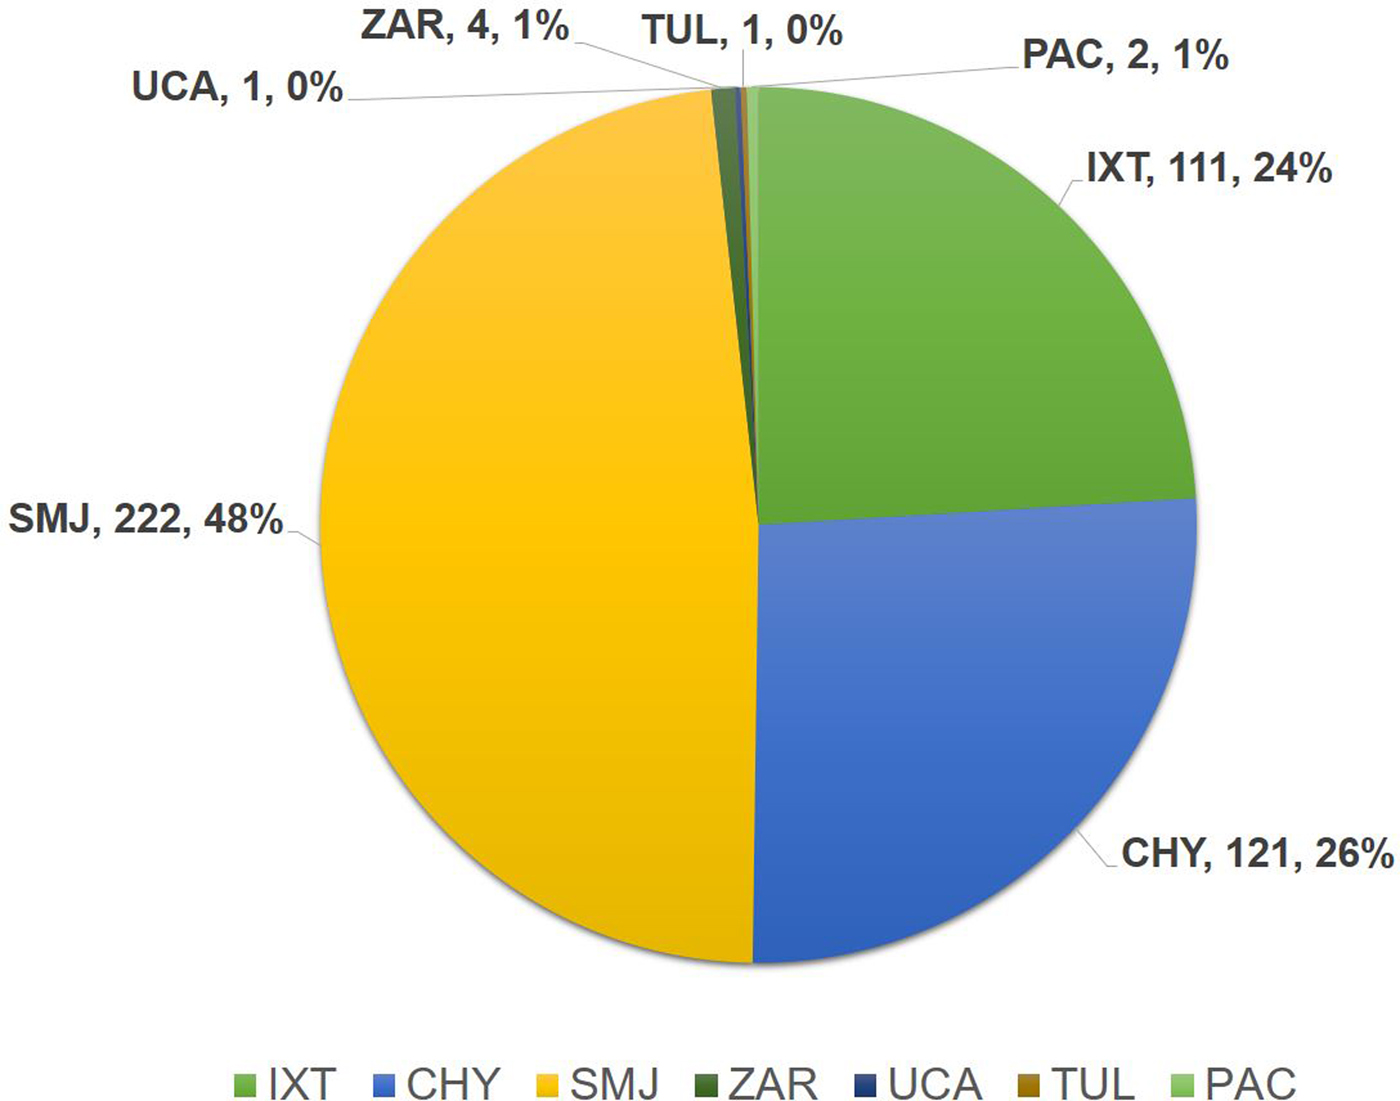
The resulting geochemical designations of Petén obsidian identified by pXRF are displayed in Figure 6 and Tables 2 and 3. The total number of Postclassic projectile points can be assigned to 23.48 percent Ixtepeque (n = 66), 23.48 percent Chayal (n = 66), 52.31 percent San Martin Jilotepeque (n = 147), and 0.71 percent Pachuca (n = 2). Of the obsidian debris, source frequencies were slightly different with 24.9 percent Ixtepeque (n = 45), 30.4 percent Chayal (n = 55), 41.4 percent San Martin Jilotepeque (n = 75), 2.2 percent Zaragoza (n = 4), 0.6 percent Ucareo (n = 1), and 0.6 percent Tulancingo (n = 1). In general, this distribution of obsidian sources is somewhat unusual for the Postclassic Maya lowlands because the sample is weighted in favor of San Martin Jilotepeque. As discussed further below, this is due to a larger sample size of points and debris originating from Nixtun-Ch'ich’. In general, San Martin Jilotepeque was more common during the late Preclassic period in the Petén Lake region, rather than the Postclassic (Braswell Reference Braswell, Smith and Berdan2003). The small test pit sample from Nixtun-Ch'ich' verified this pattern, with Middle Preclassic to Late Preclassic occupation levels containing over 90.9 percent San Martin Jilotepeque, 6.1 percent Chayal, and 3 percent Ixtepeque.
Total pXRF designations from all Postclassic contexts from the Petén Lakes region (points and debitage).

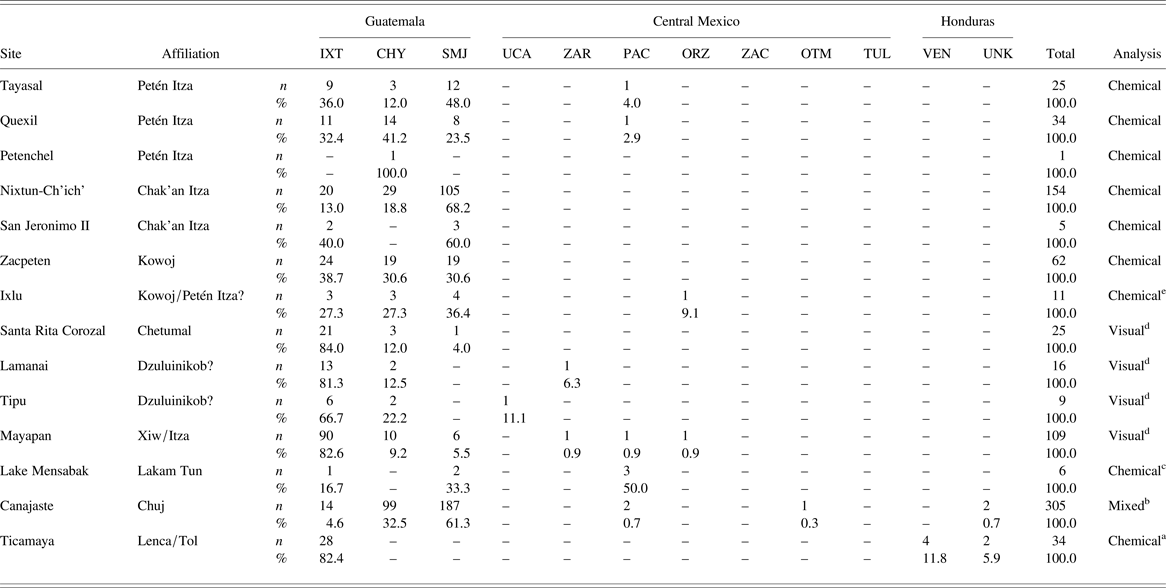
Number (n) and Relative Percentage (%) of Obsidian Source Designations of Small Projectile Points (n = 796; Blaisdell-Sloan Reference Blaisdell-Sloan2006 a; Blake Reference Blake2010 b; Deeb Reference Deeb2013 c; Meissner Reference Meissner2014 d; Rice and Cecil Reference Rice, Cecil, Rice and Rice2009a e). IXT = Ixtepeque, CHY = El Chayal, SMJ = San Martin Jilotepeque, UCA = Ucareo, ZAR = Zaragoza, PAC = Pachuca, ORZ = Pico de Orizaba, ZAC = Zacualtipan, OTM = Otumba, TUL = Tulancingo, VEN = Venado, UNK = Unknown Honduras source.

Obsidian source designations of non-point debitage (n = 2630; Baxter Reference Baxter1984 a; Blaisdell-Sloan Reference Blaisdell-Sloan2006 b; Blake Reference Blake2010 c; Deeb Reference Deeb2013 d; Masson et al. Reference Masson, Escamilla Ojeda, Delgado Kú, Tycz, Masson, Lope and Hare2008 e; Meissner Reference Meissner2014 f; Neivens et al. Reference Neivens, Harbottle, Kimberlin and Sidrys1983 g; Rice and Cecil Reference Rice, Cecil, Rice and Rice2009a h). IXT = Ixtepeque, CHY = El Chayal, SMJ = San Martin Jilotepeque, UCA = Ucareo, ZAR = Zaragoza, PAC = Pachuca, ORZ = Pico de Orizaba, ZAC = Zacualtipan, OTM = Otumba, TUL = Tulancingo, VEN = Venado, UNK = Unknown Honduras source.

SOCIAL NETWORK ANALYSIS (SNA)
Methods
SNA allows for visualizations and pattern recognition of large interrelated data sets. The breadth of SNA applications and methods cannot be succinctly covered here (see Collar et al. Reference Collar, Coward, Brughmans and Mills2015); at a basic level, however, SNA examines the relationships among nodes (objects of interest), and edges (ties or connections proposed by the researcher to denote a relationship). By doing so, SNA does not strictly focus on nodes themselves, but rather on the relational patterns among them. Recent studies have shown how SNA-derived methods are beneficial in a range of archaeological applications (Brughmans Reference Brughmans2010, Reference Brughmans2013; Golitko and Feinman Reference Golitko and Feinman2015; Hart and Engelbrecht Reference Hart and Englebrecht2012; Knappett Reference Knappett2013; Mills et al. Reference Mills, Clark, Peeples, Haas, Roberts, Brett Hill, Huntley, Borck, Breiger, Clauset and Steven Shackley2013; Mizoguchi Reference Mizoguchi2009; Munson and Macri Reference Munson and Macri2009; Phillips Reference Phillips2011).
Here, the pXRF and visual source determinations of the lowland Postclassic obsidians (n = 796 points and n = 2,630 debris fragments) provided the basis for SNA using the frequencies of obsidian provenance for each site. In this study, nodes are considered to represent the aggregate behavior of individuals (obtaining obsidian) at a given site, while edges represent the multifaceted, and potentially long term, exchange interactions that foster similarities among assemblages. Although represented in a synchronic fashion, such ties represent a multitude of interactions among individuals, possibly through generations.
To compare procurement patterns, an appropriate metric must be chosen to quantify categorical data. Since obsidian used for points can hypothetically originate from more than twelve different volcanic flows, visually or instrumentally sourced proportions can be compared using a similarity metric. Following previous studies, a Brainerd-Robinson coefficient of similarity was chosen to compare inter-assemblage variability (Golitko et al. Reference Golitko, Meierhoff, Feinman and Ryan Williams2012; Golitko and Feinman Reference Golitko and Feinman2015; Peebles Reference Peeples2011). A Brainerd-Robinson (BR) coefficient of similarity is a measure of the relative frequencies of artifact types (e.g., ceramic type, raw material type) compared to another organizing nominal variable chosen by the researcher (e.g., site, group, structure, level) (Brainerd Reference Brainerd1951; Robinson Reference Robinson1951). Pairwise BR coefficients result in a number between 0 and 200. A pairwise comparison value of 0 means that obsidian procurement patterns from two sites are completely dissimilar and a value of 200 means that obsidian procurement patterns are perfectly similar. Calculations of the Brainerd-Robinson coefficient were performed using R software (v3.01) with the statnet and network package add-ons (Butts et al. Reference Butts, Handcock and Hunter2013; Hunter et al. Reference Hunter, Handcock, Butts, Goodreau and Morris2008; R Core Team 2013). The metric can account for variability in sample size when coupled with randomized simulation techniques (Peeples Reference Peeples2011).
The equation for the Brainerd-Robinson coefficient is expressed as:
 $$S = 200 - \sum\limits_{k = 1}^p {} \left \vert {P_{ik} -P_{\,jk}} \right \vert $$
where P ik is the percentage of an artifact type k in an organizing variable i and P jk is the percentage of the same artifact k in a separate organizing variable j (Cowgill Reference Cowgill1990:513).
Following the calculation of similarity coefficients, it is necessary to establish which BR thresholds are appropriate to consider as edges or ties. One issue for researchers performing SNA is how to select a similarity threshold value without sacrificing the utility of the results (see Collar et al. Reference Collar, Coward, Brughmans and Mills2015:14–15; Peeples and Roberts Reference Peeples and Roberts2013). Some studies (e.g., Mills et al. Reference Mills, Clark, Peeples, Haas, Roberts, Brett Hill, Huntley, Borck, Breiger, Clauset and Steven Shackley2013:5786) have used a cutoff of 75 percent similarity (≥ BR 150) to establish a tie between nodes. Golitko et al. (Reference Golitko, Meierhoff, Feinman and Ryan Williams2012) utilized a top-down method of network construction that assigned ties to the highest degrees of similarity, stopping at the minimum value to connect all nodes within the network. This technique is advantageous because it is adaptable to many data sets; if similarity coefficients have a great distance from one another, however, it can inadvertently lower the network similarity threshold to a point where nuanced dynamics in the network are lost. Previous SNA applications to Late Postclassic Maya obsidian (Golitko et al. Reference Golitko, Meierhoff, Feinman and Ryan Williams2012:520; Golitko and Feinman Reference Golitko and Feinman2015:231) had threshold values that were quite low due to different methods.
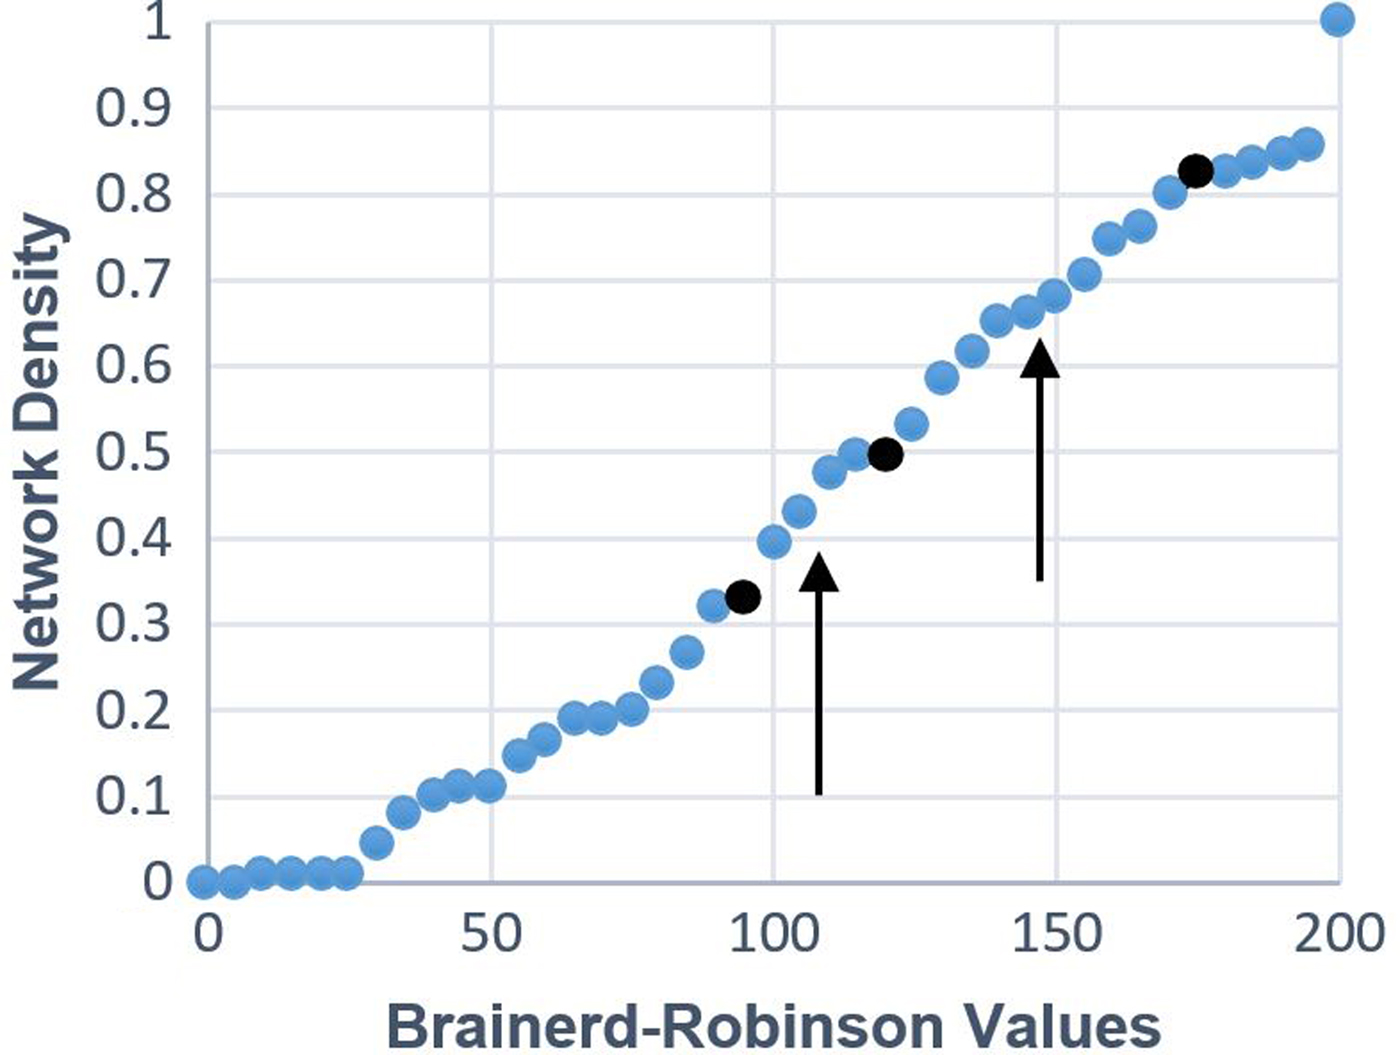
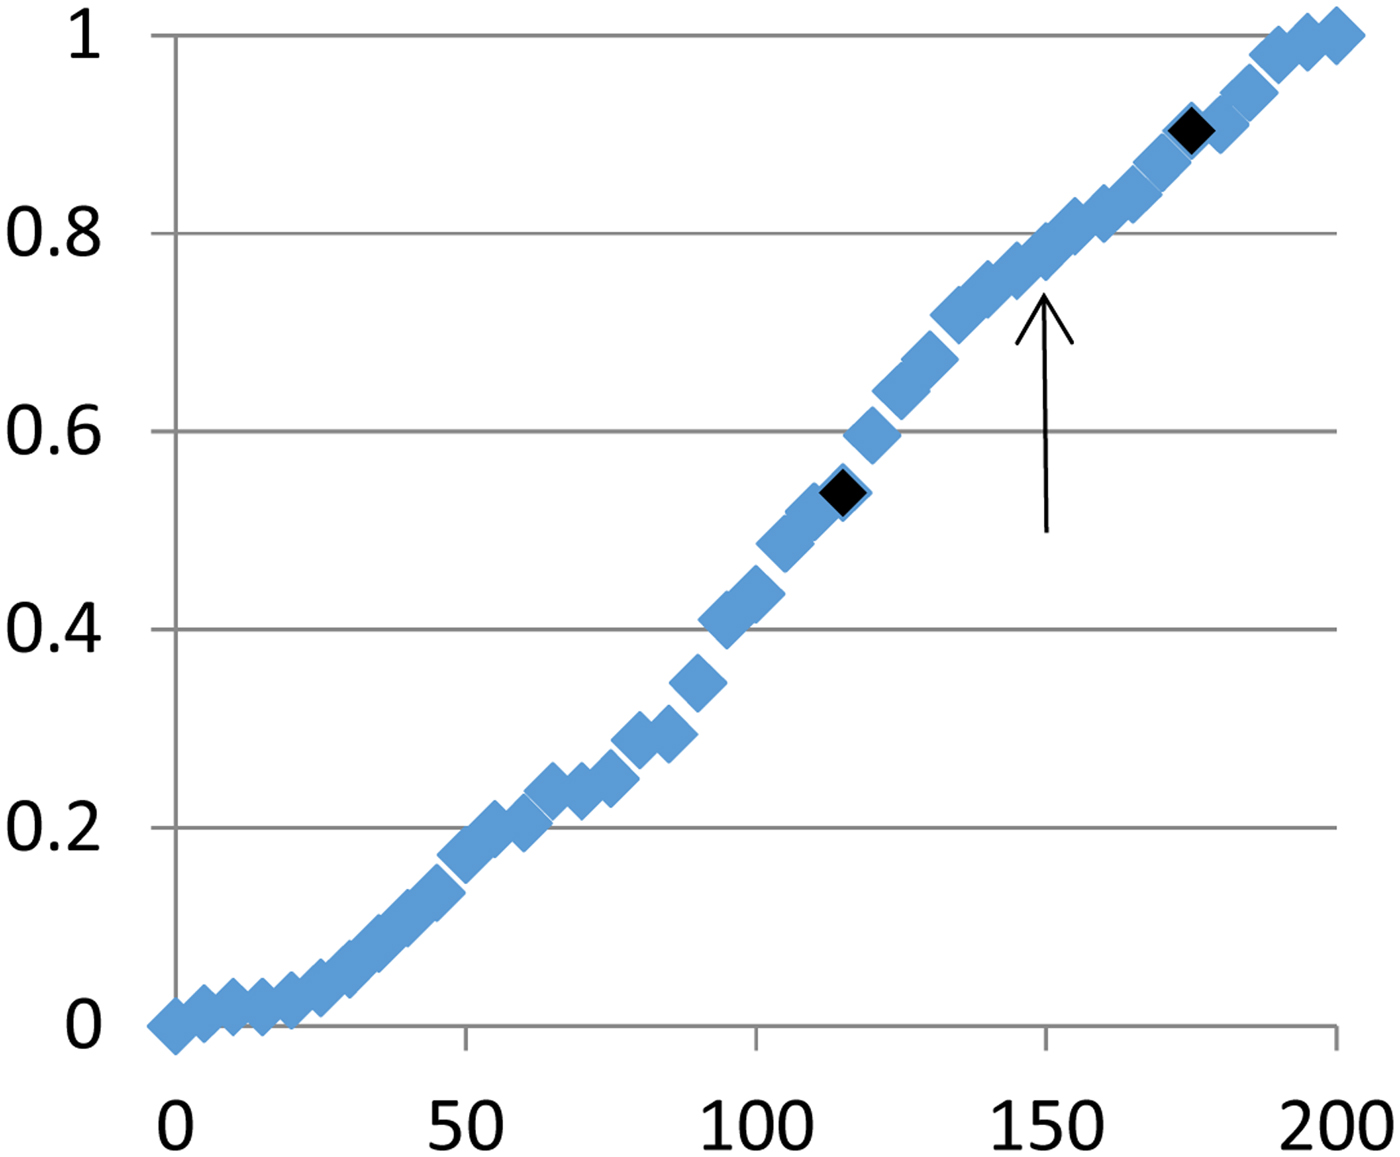
Another network threshold selection method was developed by Phillips (Reference Phillips2011:170–171) and is derived from cumulative differences in network density. This method was chosen for the current study because of its replicability and sensitivity to the internal dynamics of a given network. Phillips (Reference Phillips2011) ordered similarity coefficients from smallest to largest at 2.5 percent intervals. Network density was then calculated at each interval, meaning that for each increase, the cumulative proportion of network connections is reported. Slopes with the greatest proportional change in network density were then averaged to provide a network threshold (see results below and Figure 7).
Network density data used for SNA threshold selection. Darkened values represent the first and second major changes in total network density.

As mentioned above, there are potential problems with using exclusion thresholds and binarized networks. Additional reporting of the strength of associations is necessary to accurately portray data relationships (Peeples and Roberts Reference Peeples and Roberts2013). Thus, this study added a non-binary network visualization that used link weights to explore potential differences in data structure (see Golitko and Feinman Reference Golitko and Feinman2015:214). Using multiple network density thresholds, links were weighted as strong or weak. The lowest link weights were excluded due to their potential to obscure significant patterning.
Results: One-mode Network Visualization
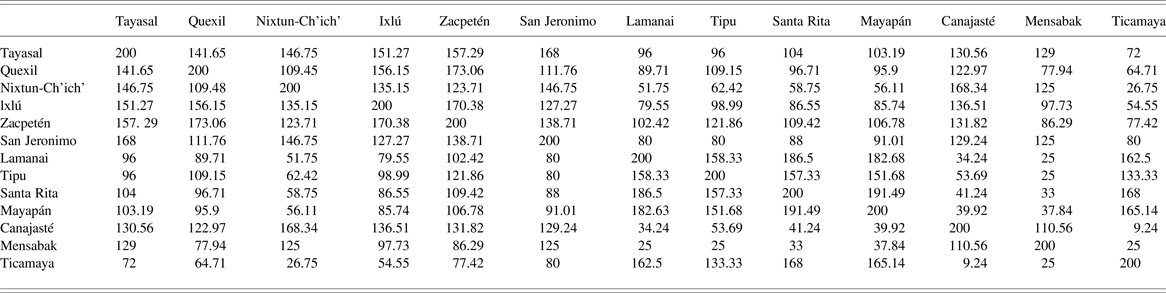
Using source data from the obsidian points, BR coefficients of similarity were calculated. The resulting matrix is displayed in Tables 4. It should be noted that the small sample size from San Jeronimo II in the Petén Lakes region limits interpretive power and results should be considered tentative. When sample sizes were too small to permit standard statistical inference, a resampling method in the form of bootstrapping was used to double check results (Meissner Reference Meissner2014:148–152; see Simon Reference Simon1997). In the case of Petenchel, results were excluded in the study due to small sample size (n = 1).
Using the network density method, a resulting cumulative density graph is displayed in Figure 7. The density graph shows a small plateau at BR values of 175 and 180 before dropping off significantly to 120 where there is another small plateau. This change between 175 and 120 represents 37 percent of total meaningful density change. The mean of this interval is 147.5, and was used as the threshold value to assign strong ties. This threshold value reflects a similarity of 73.8 percent among assemblages, which approximates the 75 percent threshold value (Mills et al. Reference Mills, Clark, Peeples, Haas, Roberts, Brett Hill, Huntley, Borck, Breiger, Clauset and Steven Shackley2013). The next sharpest drop off value occurred between 120 and 95 and was used to establish a weighted weak tie of 107.5 (54 percent similarity).
Brainerd-Robinson Coefficients of Similarity of Obsidian Point Material.

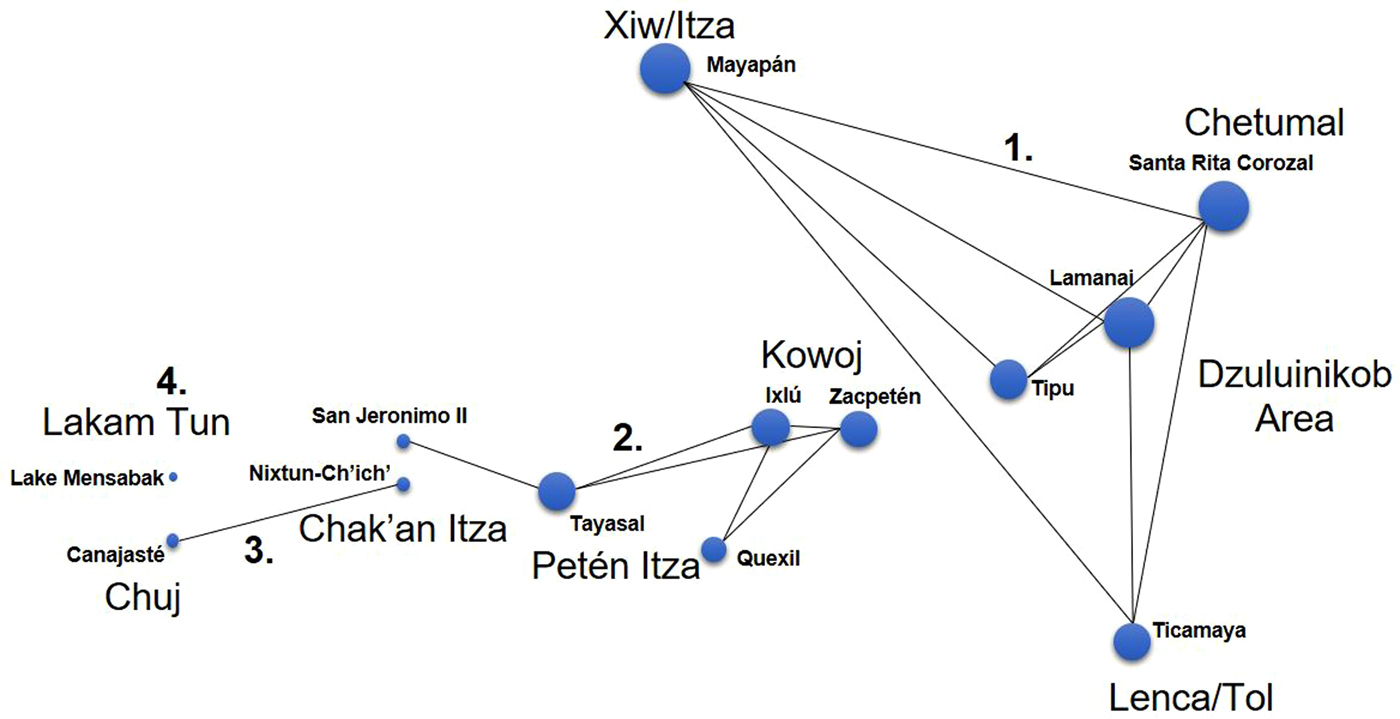
UCINET and Netdraw software were used to create two visualizations: one binary and one weighted. Figure 8 shows a network visualization of small points with a single threshold of BR 147.5. Nodes were positioned schematically according to relative geographical locations of the sites. Other Netdraw positioning algorithms such as mini-max (see Cochrane and Lipo Reference Cochrane and Lipo2010) did not have interpretive utility due to the disembedded nature of the subnetworks. It is important to remember that ties among nodes might not necessarily represent direct (or directional) exchange relationships, only similarities among assemblage materials.
Schematic one-mode network visualization of Late Postclassic obsidian used for small points (binary tie threshold of 147.5 based on density of BR similarity coefficients). Degree centrality is marked by node size.

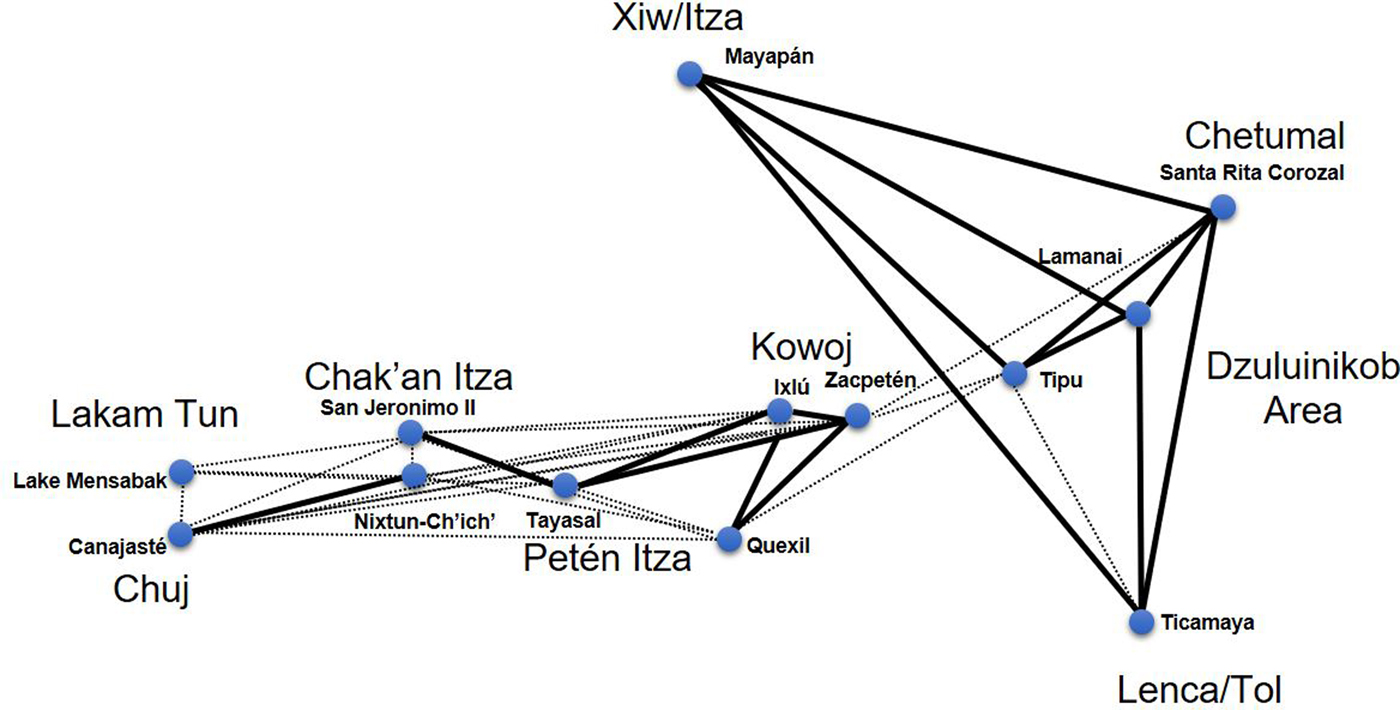
The network visualization shown in Figure 8 reveals four disembedded subnetworks of raw material used for small points: Subnetwork 1 was dominated by Ixtepeque; Subnetwork 2 was characterized by balanced proportions of Ixtepeque, Chayal, and San Martin Jilotepeque; Subnetwork 3 was marked by high percentages of San Martin Jilotepeque; and Subnetwork 4 was dissimilar to others because of its pronounced use central Mexican (Pachuca) and Guatemalan sources. This isolated node represents Lake Mensabak, and did not meet the tie threshold to connect to another node. Materials from Canajaste and Nixtun-Ch'ich' were similar to one another in terms of high percentages of San Martin Jilotepeque used for points with low proportions of Ixtepeque; this tie, however, did not connect externally to any other subnetworks. The other Petén Lakes sites of San Jeronimo II, Tayasal, Quexil, Ixlu, and Zacpeten formed a subnetwork with San Jeronimo II being the most isolated of the five sites. Another subnetwork connected nodes found in Honduras, Belize, and Mexico including Mayapan, Santa Rita Corozal, Lamanai, Tipu, and Ticamaya. The implications of these results are described in detail in the discussion.
A degree centrality measure was added as another layer of analysis. Degree centrality measures the number of ties a node possesses. Simply put, larger nodes represent sites with more network connections and smaller nodes represent sites with fewer connections. Hypothetically, each node (site) in this study could connect to one another if procurement patterns were similar. Centrality measure revealed that Mayapan, Santa Rita Corozal, and Lamanai had the most network connections of any nodes, while the fewest were found in the western Petén lakes sites (Nixtun-Ch'ich’ and San Jeronimo II) and Chiapas (Lake Mensabak and Canajaste).
To provide another layer of analysis, a weighted network visualization is provided in Figure 9. This visualization used the thresholds of BR ≥ 147.5 for a strong tie and 147.5 > BR ≥ 107.5 for a weak tie, excluding low link weights. Some elements of the data structure remain similar to the unweighted network. This includes the well-defined eastern Subnetwork 1, which had weak ties to the Zacpeten node. Weak ties connected much of the western Subnetworks 3 and 4 to the central Subnetwork 2 of the Petén Lakes region. This is likely due to the slightly higher presence of San Martin Jilotepeque obsidian at each of these sites. However, it is important to note that weak ties do not necessarily carry traditional (Bayesian) statistical similarity to one another. For example, a chi-square comparison of the weak tie between Zacpeten and Santa Rita Corozal reveals significant differences (χ2 = 4.56; p = 0.033; 1 df). This reaffirms the importance of considering strong weighted links in this study.
Weighted one-mode network visualization of Late Postclassic obsidian used for small points. Strong ties denoted by thick lines, weak ties denoted by dotted lines (BR ≥ 147.5 for a strong tie and 147.5 > BR ≥ 107.5 for a weak tie) based on BR similarity coefficients; low link weights excluded).

Results: Two-mode visualization of Points and Debris
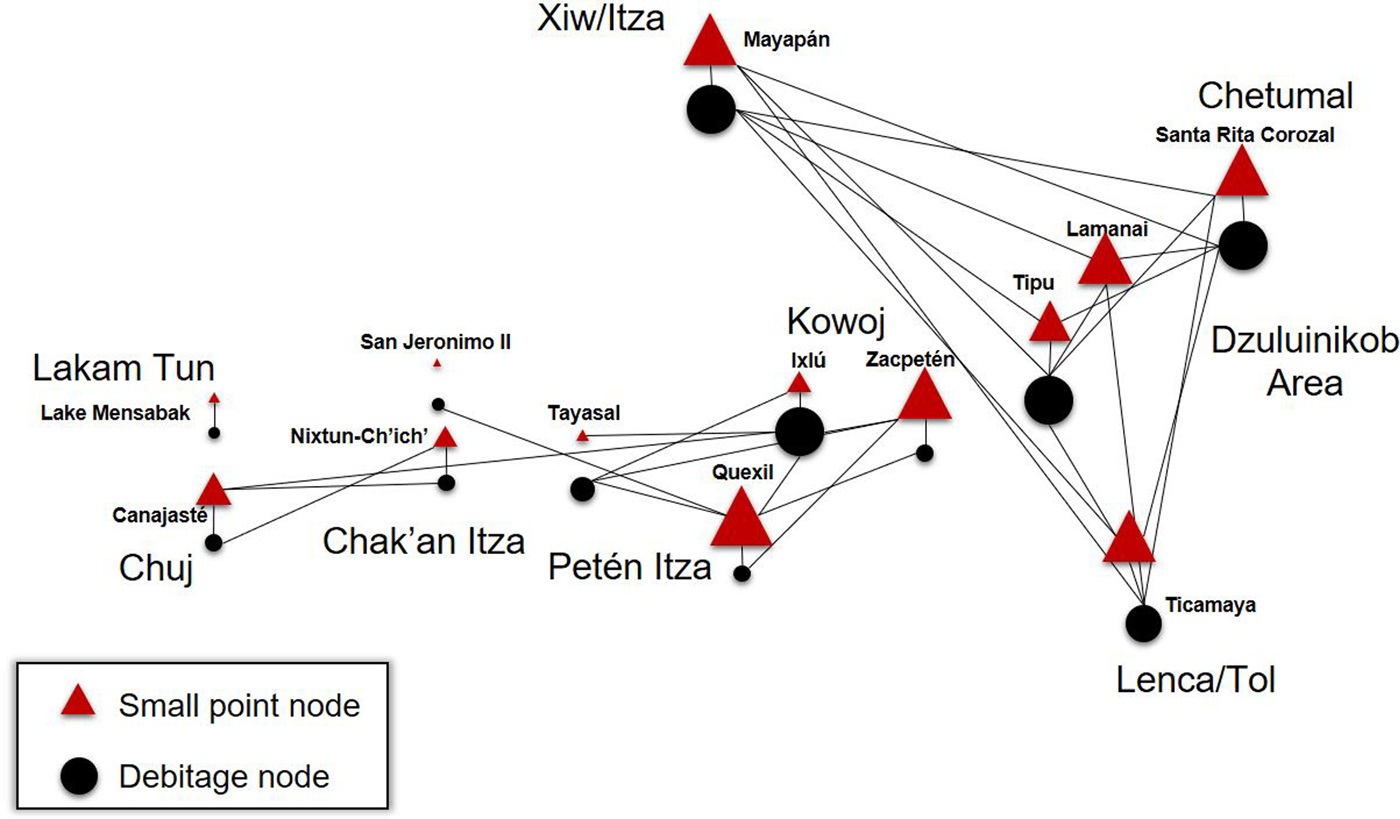
A two-mode analysis (Collar et al. Reference Collar, Coward, Brughmans and Mills2015:13) was added to explore whether points were produced locally or whether they were likely exchanged among polities (Figure 10). In this case, a SNA variant was used to determine whether the raw materials used for small projectile points resembled local or “parent” debitage and debris recovered from sites from a variety of structures. The goal of this visualization is to understand whether obsidian arrow points may have been manufactured with locally available materials, or whether such points might have circulated (and were, therefore, dissimilar to their suspected parent assemblages).
Schematic two-mode network visualization of Late Postclassic obsidian points (triangles) and general debitage (circles). Point nodes only connect to debitage nodes at BR similarity of 145 and degree centrality is reflected by node size.

Obsidian points are represented in triangles and debitage/debris is represented in black circles. In this visualization, points can only connect to debitage, meaning that point nodes cannot connect to other point nodes and debitage nodes cannot connect to other debitage nodes. The resulting visualization showed three subnetworks formed among nodes. Like the one-mode analysis, there is a distinct interconnected subnetwork involving Mayapan, Santa Rita Corozal, Lamanai, Tipu, and Ticamaya. Debitage from Ticamaya was similar to point nodes in all sites within this subnetwork with the exception of Tipu. Other than this discrepancy, debris nodes interconnected to all point nodes in the eastern Subnetwork 1. There is slightly more variability in how point nodes connect to debitage nodes in the Petén Lakes subregion and southwest. The patterns from central Petén are complex and discussed in detail below.
DISCUSSION
Results from SNA visualizations illustrate the varied nature of obsidian procurement patterns for small points, especially when considering ethnopolitical divisions and factions in the Postclassic Maya political landscape. To summarize, the purpose of SNA applications here is to: 1) provide a one-mode visual means of connecting nodes (sites) with ties (similarity) to model possible interactions; 2) identify any isolated subnetworks, and by extension, potential exchange barriers among ethnopolities; and 3) recognize any nodes (sites) that may have functioned as strongly interconnected exchange centers by degree centrality measures. The most striking differences among point assemblages were among western, central, and northeastern/eastern ethnopolities where SNA revealed at least four subnetworks of raw materials when considering strong ties. Non-binary visualizations (strong and weak ties) retained some of this structure but revealed stronger differentiation between inland and coastal exchange. The cultural contexts of the one-mode and two-mode results are described below.
Subnetwork 1
Node ties from Subnetwork 1 show similarities among point materials from Xiw/Itza, the Dzuluinikob area, Chetumal, and Lenca/Tol territories. As mentioned above, there is some possibility that the Xiw/Itza of Mayapan may have facilitated the movement of Ixtepeque obsidian via maritime exchange routes (Braswell Reference Braswell, Smith and Berdan2003:155). Indigenous texts suggest that the Xiw formed an alliance with the Kokoms (Itza) and the Kupul to create a joint rule or multepal of the large regional capital of Mayapan (Milbrath and Peraza Lope Reference Milbrath and Peraza Lope2003; Masson and Peraza Lope Reference Masson and Peraza Lope2014). Following the Mayapan collapse, it is possible that such trade routes remained until Spanish disruption. Interestingly, it is also known that the Lenca/Tol of Honduras (located near the coastal trade route, see Figure 2) had strong alliances with the Chetumal province (Blaisdell-Sloan Reference Blaisdell-Sloan2006:1–3,56; Sheptak et al. Reference Sheptak, Blaisdell-Sloan, Joyce, Voss and Casella2011:157). During the early Contact period, residents of Ticamaya summoned allies from Chetumal to resist Spanish encroachment (Blaisdell-Sloan Reference Blaisdell-Sloan2006).
It is likely that Chetumal and the smaller, nebulous area designated as Dzuluinikob (Jones Reference Jones1989) served as an exchange gateway to Mayapan (Graham et al. Reference Graham, Pendergast and Jones1989; Pendergast Reference Pendergast1993). The relationship between these ethnopolities or areas is unclear. Graham (Reference Graham2011:47) posits that Lamanai was largely outside of the sphere of direct political control of Chetumal, although still possibly involved in a tributary relationship with the halach winik of Chetumal (Graham Reference Graham2011:47; Masson Reference Masson1999:288). The area referred to as Dzuluinikob is also not well-defined archaeologically (although Spanish documents describe Tipu as its capital, see Jones Reference Jones1989:10,17), and its existence as a larger Postclassic political entity is subject to greater scrutiny. Despite all of the sites sharing a subnetwork of raw material exchange, the actual technological traditions and morphologies of the small points were found to vary (Meissner Reference Meissner2014:351), which does not lend strong support for the regional circulation of finished tools in this subnetwork, only for raw materials used for their manufacture.
Subnetwork 2
In Petén, Subnetwork 2 had multiple edges among nodes in Petén Itza and Kowoj territory, along with one minor node in Chak'an Itza territory. The relative similarity of procurement patterns between the Petén Itza and Kowoj (connecting the nodes of Tayasal, Ixlu, Quexil, and Zacpeten) was unanticipated considering these were known as rival, and occasionally warring, groups by the terminal Late Postclassic and late seventeenth century (Rice et al. Reference Rice, Rice, Pugh, Rómulo Sánchez Polo, Rice and Rice2009). Both ceramics and architecture differed between the Petén Itza and Kowoj; Kowoj architectural patterns included temple assemblages similar to those built by the Xius at Mayapan (Cecil Reference Cecil, Rice and Rice2009:231–233; Cecil and Neff Reference Cecil and Neff2006:1485; Pugh Reference Pugh2001; Pugh and Rice Reference Pugh, Rice, Rice and Rice2009b:141; Rice Reference Rice, Rice and Rice2009b:47; Rice and Cecil Reference Rice, Cecil, Rice and Rice2009b:272).
Similarities among point assemblages suggest either these two groups traded at integrated levels despite political hostilities, or it is entirely possible that both the Petén Itza and Kowoj received obsidian or points from third-party merchants. There is some evidence suggesting that the port of Ixlu, and possibly Zacpeten, may have been controlled by the Petén Itzas prior to a Kowoj migration from Mayapan in the late fourteenth century (see Rice Reference Rice, Rice and Rice2009b:49), which could account for some material similarities. Interestingly, the known cultural connections between the Xiw of Mayapan and the Kowoj of Zacpeten did not manifest itself in the movement of obsidian goods. The rural center of Quexil did not carry a strong tie directly to Tayasal, which was unexpected, considering its proximity and its affiliation as a rural Petén Itza center (Figure 8).
Subnetwork 3
Subnetwork 3 was perhaps the most interesting example of the effects of factionalism on procurement strategies. In Petén, SNA visualizations showed that members of the Chak'an Itza faction at Nixtun-Ch'ich' had significantly different patterns of obsidian acquisition than their contemporaries at Tayasal. This difference is striking considering that the Chak'an Itza and Petén Itza are only separated by a mere 2.6 km across Lake Petén Itza. Historic documents suggest the Chak'an Itza were a late faction or splinter group of the Petén Itza that occupied the western and northwestern shores of Lake Petén Itza (Jones Reference Jones1998:6–8). Internal strife likely beginning in the Postclassic led to increased separation of the Chak'an Itza from leadership at Petén Itza capital of Nojpeten. By 1695 the Chak'an Itza leader Ajaw B'atab’ K'in Kante allied himself with Aj Kowoj (the leader of the Kowoj) to sack and burn part of Tayza or Nojpeten—the Petén Itza capital (Jones Reference Jones1998:205).
Results from Subnetwork 3 indicated possible exchange ties between the Chak'an Itza and groups further southwest in Chuj territory though a reliance on San Martin Jilotepeque. However, Chuj and Chak'an Itza points have pronounced morphological and technological differences (Meissner Reference Meissner2014:336, 351), which suggest local manufacture. It is unclear why Nixtun-Ch'ich' utilized such high levels of San Martin Jilotepeque obsidian but the status of Nixtun-Ch'ich' (Nich in Spanish accounts) as a western port of Lake Petén Itza may factor into such characterizations. It is possible that the Chak'an Itza had closer ties to various highland groups like the Kaqchikel who were located near the source. Late Postclassic centers in the Iximche’ polity had similar patterns of exploitation of San Martin Jilotepeque (Braswell et al. Reference Braswell, Clark, Aoyama, McKillop and Glascock2000:271).
It is also possible, given the heavy Preclassic occupation at Nixtun-Ch'ich', that inhabitants had a stronger tendency for recycling San Martin Jilotepeque obsidian from the site. Given that San Martin Jilotepeque is so common across all Postclassic contexts at Nixtun-Ch'ich', however, it is most likely a reflection of actual procurement processes. The Postclassic technique of platform grinding was found on many of the proximal ends of prismatic (3s) blades, suggesting Postclassic manufacture. Interestingly, the small outlying hamlet of San Jeronimo II (likely Chak'an Itza affiliated) did not have adequate data to establish a tie to Nixtun-Ch'ich', although the sample size (n = 5) was quite small.
Subnetwork 4
Lake Mensabak (Lakam Tun/Lacandon) represents the only ethnopolity that used high levels of green Pachuca from Mexico and San Martin Jilotepeque (Subnetwork 4). This site is located in a previously unidentified obsidian exchange sphere (Figure 1; Braswell Reference Braswell, Smith and Berdan2003). Recent research suggests the remote area around Lake Mensabak may have been important for religious pilgrimages from Mexico, as investigations have revealed numerous sacred caves, burial shrines, and petroglyphs (Deeb et al. Reference Deeb, Kestle and Palka2011; Palka Reference Deeb2013; Palka and Sanchez Balderas Reference Palka, Fabiola Sanchez Balderas, Lowe and Pye2012). It is likely that this area had ties further north to trading centers in Xicalango, possibly using the Usumacinta river for the movement of materials from the Gulf of Mexico (Deeb Reference Deeb2013). Research is ongoing in this subregion and future excavations will provide a better understanding of the exchange patterns in this area.
Two-mode Analysis
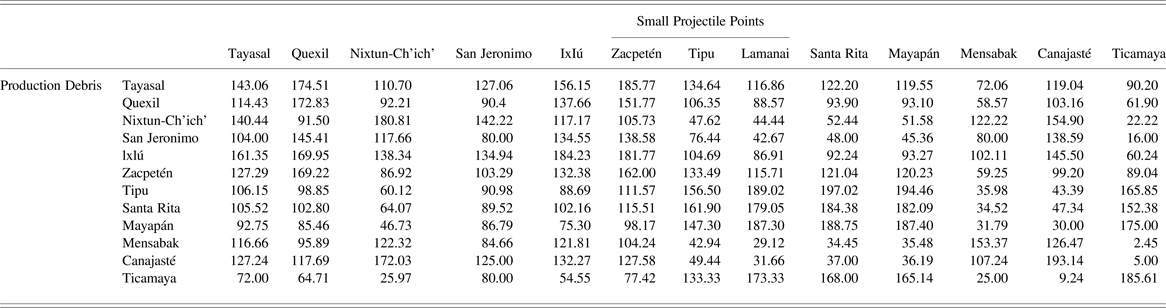
Two-mode analysis between the raw materials used for points and from sitewide obsidian debris added another layer of complexity concerning production and circulation. The resulting visualization (Figure 10) formed three subnetworks among the sites. The BR coefficients of similarity can be found in Table 5, and the network density graph can be found in Figure 11. In general, the raw material sources from points were similar to their “parent” debitage sources, suggesting local manufacture. This pattern was not uniform throughout the lowlands, however, especially in Petén. The obsidian used for points at Zacpeten was found to be proportionately similar to the surrounding Petén Lakes sites with the exception of those located in Chak'an Itza territory.
Network density of points to debitage comparison showing Brainerd-Robinson values on x-axis and proportional density on y-axis. Dropoff interval darkened.

Brainerd-Robinson Coefficients of Similarity of Obsidian Points and Production Debris.

Point materials from Tayasal were most similar to debitage from Ixlu—a contested center. Given that Ixlu (possibly historically known as Saklemakal) was once considered an eastern port for the Petén Itza (Rice and Rice Reference Rice and Rice2016), it is possible that points were produced and distributed to Tayasal, perhaps in the form of tribute as witnessed elsewhere in the Maya lowlands (Scholes and Roys Reference Scholes and Roys1948:344). Another anomaly included the outlying site of Quexil, which had points resembling the debitage of several adjacent sites. Given its rural status, it is likely that such ties do not necessarily represent directionality (e.g., points traded into Quexil), but perhaps reflect the generalized procurement strategies of residents. Another interesting aspect of this visualization is that the point node of San Jeronimo II does not connect to any debitage node at this threshold, making it the only site that did not maintain a tie.
Distant Obsidian Sources
As to the circulation of finished small points (or large quantities of obsidian) from central Mexico, there is no strong evidence from the central and northeastern/eastern polities that indicates a prolonged reliance on distant obsidian flows. Historic accounts mention that the Itza of Mayapan had ties to Nahuatl speaking mercenaries of Mexico (Landa in Tozzer Reference Tozzer1941:26). Such mercenaries were said to have brought bow and arrow weaponry to the city (Landa in Tozzer Reference Tozzer1941:32), which could hypothetically mean increased quantities of Pachuca or Otumba points. Results show only very small quantities of Mayapan obsidian points were made from materials originating from outside of Guatemalan procurement routes (n = 3 or 2.8 percent from central Mexico).
This pattern is similar in the Petén Lakes sites where Pachuca points (n = 2 or 3.4 percent) were only encountered in Petén Itza territory and not in neighboring polities (Table 2). Interestingly, the Kowoj or Kowoj-contested sites of Zacpeten and Ixlu had the only examples of points made from Pico de Orizaba (Rice and Cecil Reference Rice, Cecil, Rice and Rice2009a:334), and it is possible that this discrepancy could reflect a tendency for different central Mexican connections between the Petén Itza and Kowoj. However, sample sizes are so limited that any patterns suggested here would require additional support.
CONCLUSIONS
This study used pXRF and SNA methods to address anthropological topics concerning heightened long distance interactions, social divisions, and Late Postclassic Maya economies. On the basis of previous characterizations, it was expected that social network analysis of the small point industry would reveal a high degree of embeddedness among polities, thus reflecting the “internationalized” or “cosmopolitan” economies of the Postclassic. Results indicate complex patterns of obsidian procurement involved in the small point industry that were not altogether uniform.
Contrary to generalized models, unweighted one-mode SNA showed at least four disembedded subnetworks of obsidian used for points in the Maya lowlands during the Late Postclassic and early contact periods. Such subnetworks brought at least nine different ethnopolities with contact with one another to various degrees, including pronounced western, central, and coastal networks of exchange. In several cases, procurement did not coincide closely with political affiliation, although in the case of the Petén Itza and Chak'an Itza—factionalism and hostilities may have led to divergent patterns of raw material acquisition. Such effects are reminiscent of the economic behaviors of Postclassic Tlaxcalans, where resistance to Aztec governance may have led to differing obsidian procurement in the subregion (Millhauser et al. Reference Millhauser, Fargher, Heredia Espinoza and Blanton2015:144).
Weighted SNA applications including weak ties produced a slightly different pattern, creating a distinctive east-west division among ethnopolities. Such results illustrate the potential importance of threshold selection by the researcher and whether or not network utility is lost with overly sensitive or strong thresholds (Peebles and Roberts Reference Peeples and Roberts2013). In the context of Golitko and Feinman (Reference Golitko and Feinman2015:Figures 13 and 14), intra-network differences among Postclassic Lowland Maya polities are unclear due to lower thresholds that were chosen specifically to understand broader Mesoamerican exchange patterns. However, their “network extensive” hypothesis regarding the Postclassic does bear some similarity to patterns presented in the current study (Golitko and Feinman Reference Golitko and Feinman2015:233). This network topology indicates that fewer obsidian sources were represented at individual sites despite the exploitation of more sources in Mesoamerica overall during the Late Postclassic. In the Maya region, this trend toward decreased diversity of obsidian sources is likely related to the ethnopolitical structures that fluoresced during the Late Postclassic.
Results from two-mode SNA overwhelmingly showed that obsidian used for point manufacture was similar to what was found locally in sitewide debitage. This does not support a hypothesis of widespread regional circulation of finished point weaponry among polities. However, in limited cases in the Petén Lakes region, the raw materials used for points did not closely match sitewide procurement patterns. This suggests that in particular cases, point manufacture may have been tied to highly localized exchange or tribute.
Rather than an all or nothing characterization of a Postclassic Lowland Maya exchange circuit, it is perhaps best to understand the degree in which economic elements resemble or diverge from current ideas. Exchange across political boundaries did occur but exchange was also localized to a mosaic of ethnopolities and subject to factional processes. Despite the presence of a proposed pan-Mesoamerican “world” of exchange (Smith and Berdan Reference Smith, Berdan, Smith and Berdan2003b), an interpretation of provenance data suggests that very few Maya ethnopolities (with the exception of possibly Lake Mensabak) relied strictly on the circulation of small points from outside of local production and procurement regimes. Significant variation of lithic exchange within the proposed Maya exchange circuit requires more attention from a material and technological perspective. Thus, this study illuminates the importance of fine-grained analysis of material origins as it relates to past cultural processes. Did intensified long distance exchange, information sharing, and a “cosmopolitan” economy play a large role in local regimes of craft production? The results of this study suggest that the nuances of ethnopolitical organization are crucial to understand resource procurement and prehistoric economies.
RESUMEN
La presencia de intercambio de material en el registro arqueológico ha llevado a los arqueólogos a buscar modelos teóricos para explicar el comercio a larga distancia y las interacciones. Durante el periodo posclásico tardío (1350–525 d.C.), las economías políticas en la zona conocida como Mesoamérica se han caracterizado cada vez más por los modelos macrorregionales de producción e intercambio que hacen hincapié en las relaciones “internacionales” entre entidades políticas. Los investigadores han caracterizado el posclásico de las tierras bajas mayas como un circuito de intercambio: una subregión del mundo mesoamericano donde se intensificaron los contactos culturales que ocurrieron entre los grupos políticos. Esto incluye la distribución horizontal de las materias primas y productos terminados a través de las fronteras políticas, a menudo mediante centros de comercio internacional (Smith and Berdan Reference Smith, Smith and Berdan2003).
En este estudio, el circuito de intercambio maya es examinado a la luz de recientes datos y nuevos métodos de análisis de obsidiana, incluyendo la aplicación del análisis de redes sociales (ARS). El estudio incluye: 1. El uso de fluorescencia de rayos X y la determinación visual para asignar fuentes volcánicas a una amplia muestra de puntas pequeñas y desechos de talla de obsidiana (n = 796 puntas de proyectil y n = 2.630 desechos); y, 2. La realización de análisis de ARS (one-mode y two-mode), mediante el examen de las diferencias de origen de obsidiana entre sitios.
Los resultados de ARS demuestran la variada naturaleza de los patrones de adquisición de obsidiana en puntas pequeñas, especialmente cuando se consideran las divisiones etnopolíticas y facciones de la geografía política en el posclásico maya. Las diferencias más notables entre los conjuntos de puntos estuvieron entre las unidades etnopolíticas del este/oeste, centro y noreste, donde ARS reveló al menos cuatro subredes de las materias primas. Los análisis no binarios (uniones fuertes y débiles) retienen parte de esta estructura, pero revelaron diferenciación de intercambio más fuerte entre el interior y la costa.
En varios casos, las adquisiciones no coincidían estrechamente con la afiliación política, aunque en el caso de Petén, Guatemala—el sectarismo y las hostilidades pueden haber dado lugar a patrones divergentes de adquisición de materias primas. Tales efectos son una reminiscencia de los comportamientos económicos de los tlaxcaltecas en el posclásico, donde la resistencia al gobierno mexica pudo haber llevado a las diferentes de adquisición de obsidiana en la subregión (Millhauser et al. Reference Millhauser, Fargher, Heredia Espinoza and Blanton2015). La variación significativa del intercambio lítico dentro del circuito de intercambio maya propuesto requiere más atención desde una perspectiva material y tecnológica. Por lo tanto, este estudio ilumina la importancia del análisis de grano fino de los orígenes del material que se refiere a los procesos culturales pasados.
ACKNOWLEDGMENTS
Financial support was provided by a National Science Foundation dissertation improvement grant to Rice and Meissner (#1146372). Archaeological data from Petén were gathered from NSF Grants to Pugh (#0917918, #1037927, and #0742295) and Rice. Previous support for excavations at Nixtun-Ch'ich' was provided by the Heinz Foundation and the National Endowment for the Humanities. The Santa Rita Corozal data was collected as a result of excavations funded by NSF Grants BNS-8509304 and BNS-8318531 (both to D.Z. Chase and A.F. Chase). The mentorship and guidance of Prudence Rice made this study possible. I also thank the following individuals for their assistance and generosity with accessing curated collections: Timothy Pugh, Carlos Sanchez, Evelyn Chan, Don Rice, Joel Palka, Elizabeth Graham, Arlen Chase, Diane Chase, Marilyn Masson, Carlos Peraza Lope, Michael Blake, Roberto Lopez Bravo, Emiliano Gallaga, Katie South, Leslie Cecil, Fabiola Sanchez, Rebecca Deeb, Miriam Salas, Kevin Schwarz, Matthew Rockmore, Matthew Yacubic, Christina Halperin, Yuko Shiratori, Marc Marino (PPP4L), and Teresa Palomares. Institutional support was provided by the Instituto de Antropología e Historia de Guatemala, and Licda. Rita Casas helped with obtaining permissions for exports from Guatemala. The Instituto Nacional de Antropologia e Historia, Museo Regional de Chiapas, and the Consejo Nacional de Arqueologia de Mexico provided institutional support in Mexico. The Royal Ontario Museum (April Hawkins, Justin Jennings) and the Belize Institute of Archaeology (NICH) provided access to the Belizean point collections. Analytical support was provided by the Elemental Analysis Facility at the Chicago Field Museum, where Mark Golitko and Laure Dussubieux provided assistance with pXRF analysis.
APPENDIX A
PXRF data were collected at the Elemental Analysis Facility at the Chicago Field Museum. The instrument was configured to a KTI of 40.00 kV at 10.00 μA and a live time of 180 seconds was used per sample. This live time was found to be most efficient with this particular device when reading the elemental concentrations of obsidians. More time was not necessary to gather the minimal amount of elemental concentrations to provide group designations. A copper filter was used on the anode to determine concentrations of Manganese (Mn), Iron (Fe), Zinc (Zn), Gallium (Ga), Thorium (Th), Rubidium (Rb), Strontium (Sr), Yttrium (Y), Zirconium (Zr), and Niobium (Nb) in parts per million. This particular model is equipped with a rhodium target x-ray tube and a SiPIN detector with a resolution of 190 eV at 10,000 counts per second.
The obsidian fragments were positioned to allow the flattest face of the sample to form a 45-degree angle with the x-ray anode and detector. Samples ranged in size depending on form (e.g., point, blade, flake, or core) and most samples measured between 1 to 5 centimeters in length, 1 to 3 centimeters in width, and 2 millimeters to 4 centimeters in thickness. One sample (#333, MPP20005) was thin and, therefore, gave an inflated reading, although it was determined that it fit within one of the statistical groups mentioned below.
A standard set of three obsidian samples—two originating from Papua New Guinea (ANU2000; ANU9000) and one from the Chayal (CHY001) source in Guatemala—were measured each day prior to beginning and after the completion of work. These obsidian standards had been measured previously in other laboratories on a variety of instruments to provide a baseline measurement to help calibrate the instruments for measuring obsidian (Glascock Reference Glascock1999; Moholy-Nagy et al. Reference Moholy-Nagy, James Meierhoff and Kestle2013; Reepmeyer et al. Reference Reepmeyer, Spriggs, Anggraeni, Lape, Neri, Ronquillo, Simanjuntak, Summerhayes, Tanudirjo and Tiauzon2011). The twice-daily standard check was performed to ensure the instrument's accuracy and double check the concentration amounts in case environmental changes in the instrument occurred. Most importantly, these standards were used to correct the measurements gathered from the Bruker Tracer III-V to allow for comparisons with previously published source data from the Missouri University Research Reactor (MURR) and the other pXRF Innov-X instrument present at the Elemental Analysis Facility (Moholy-Nagy et al. Reference Moholy-Nagy, James Meierhoff and Kestle2013).