



1. Introduction
The flow-induced vibration (FIV) of elastically mounted circular cylinders has attracted significant research interest in engineering applications, including offshore platform risers, bridge cables and other structural systems. The FIV research primarily focuses on complex vortex dynamics and fluid–structure interaction mechanisms, with the objectives of mitigating undesirable vibration energy or exploring potential energy-harvesting applications (Luo et al. Reference Luo, Gao and Zhang2022; Lo et al. Reference Lo, Thompson, Hourigan and Zhao2024). The FIV phenomena can be classified according to distinct excitation mechanisms, including vortex-induced vibration (VIV), which arises from periodic vortex shedding (Williamson & Govardhan Reference Williamson and Govardhan2008; Konstantinidis et al. Reference Konstantinidis, Dorogi and Baranyi2021), wake-induced vibration (WIV), which is triggered by unsteady wake interactions (Assi et al. Reference Assi, Bearman and Meneghini2010; Fan et al. Reference Fan, Wang and Tan2021), as well as galloping and flutter, which are also typical FIV phenomena (Barrero-Gil et al. Reference Barrero-Gil, Sanz-Andrés and Alonso2009; Han & de Langre Reference Han and de Langre2021). Comprehensive reviews of FIV classifications and the underlying physical mechanisms can be found in the literature (Wang et al. Reference Wang, Fan and Lin2020a ; Huera-Huarte Reference Huera-Huarte2025).
The VIV and WIV of circular cylinders both involve intricate vortex dynamics. The VIV phenomena and their underlying mechanisms for single cylinders are first reviewed to provide essential insights for understanding WIV in tandem-cylinder systems. Despite the apparent simplicity of the structural configuration in VIV, the associated fluid dynamics exhibits remarkable complexity, which has sustained extensive research efforts (Williamson & Govardhan Reference Williamson and Govardhan2004; Zhao Reference Zhao2023). An important characteristic of VIV is the lock-in phenomenon, in which the vortex-shedding frequency synchronises with the structural vibration frequency and remains close to the natural frequency of the system (Gabbai & Benaroya Reference Gabbai and Benaroya2005). The lock-in phenomenon typically occurs within a limited range of reduced velocity
 $U_{r}$
. The lock-in of VIV can be divided into upper and lower branches at low mass–damping parameters
 $m^{*}\zeta$
, whereas only the lower branch persists at high
 $m^{*}\zeta$
(Morse & Williamson Reference Morse and Williamson2009; Mishra et al. Reference Mishra, Soti, Bhardwaj, Kulkarni and Thompson2020; Han et al. Reference Han, Zhou, Shi, Feng, Wang and Zhao2026). Here, the mass ratio
 $m^{*}$
represents the ratio of the structural mass to the displaced fluid mass, while
 $\zeta$
denotes the ratio of the structural damping to the critical damping. Beyond the lock-in regime, desynchronised branches emerge. The mass ratio
 $m^{*}$
plays a critical role in VIV dynamics. When
 $m^{*}$
of a circular cylinder falls below the critical mass ratio, the cylinder undergoes VIV forever; that is, the lock-in range becomes infinite. Experiments and numerical simulations have identified a critical mass ratio of
 $m_{cr}^{*} = 0.54$
(Govardhan & Williamson Reference Govardhan and Williamson2002; Han et al. Reference Han, de Langre, Thompson, Hourigan and Zhao2023b
), below which large-amplitude vibrations persist even at infinite reduced velocity. Notably, recent studies have confirmed that
 $m_{cr}^{*}$
exhibits a dependence on the Reynolds number (Navrose & Mittal Reference Navrose and Mittal2017; Bourguet Reference Bourguet2023, Reference Bourguet2024).
For fixed tandem cylinders, the flow field exhibits diverse characteristics under different spacing ratios and Reynolds numbers (Zdravkovich Reference Zdravkovich1987; Alam et al. Reference Alam, Moriya, Takai and Sakamoto2003; Sumner Reference Sumner2010). Compared with the VIV of a single circular cylinder, the WIV of tandem cylinders exhibits substantially greater complexity (Nguyen et al. Reference Nguyen, Chan and Nguyen2018; Wang et al. Reference Wang, Alam and Zhou2018; Alam et al. Reference Alam, Chen, Zhou, Wang, Wang and Islam2023). In addition to the key parameters governing VIV,
 $U_{r}$
,
 $m^{*}$
,
 $\zeta$
and the Reynolds number, the spacing ratio
 $L/D$
emerges as a critical parameter in WIV dynamics. Bokaian & Geoola (Reference Bokaian and Geoola1984) identified four distinct WIV regimes through comprehensive experiments with
 $m^{*}\zeta = 0.109$
: wake-induced galloping (WIG), VIV, separated VIV and WIG, and combined VIV and WIG. The VIV is observed at relatively low
 $U_{r}$
, with vibration frequencies close to the natural frequency of the system, whereas WIG occurs at higher
 $U_{r}$
with vibration frequencies exceeding the natural frequency. Similar vibration responses were reported by Hu et al. (Reference Hu, Wang and Sun2020), who demonstrated that
 $m^{*}\zeta$
significantly affects vibration amplitude, velocity range and hysteresis behaviour. Numerical simulations of fluid–structure interaction for tandem cylinders have been conducted by several researchers (Bao et al. Reference Bao, Huang, Zhou, Tu and Han2012; Sharma & Bhardwaj Reference Sharma and Bhardwaj2023), focusing on vibration modes, lock-in mechanisms, gap flow dynamics, fluid forces and wake characteristics. Alam et al. (Reference Alam, Liu, Zhou, Zhu and Ji2025) showed that increasing
 $L/D$
initially amplifies the influence of the upstream cylinder on the vibration response of the downstream cylinder until a critical threshold is reached, beyond which this influence diminishes. This behaviour was attributed to modifications in vortex strength within the wake. The Reynolds number strongly influences both the vibration amplitude and the dominant frequency of the downstream cylinder (Lin et al. Reference Lin, Wang, Zheng and Sun2020, Reference Lin, Sun, Liu, Zhu, Wang, Triantafyllou and Fan2024), as well as its sensitivity to fluid forces (Carberry et al. Reference Carberry, Sheridan and Rockwell2001). Similar to the VIV forever of a single cylinder, a finite vibration amplitude also exists in the WIV response of a tandem-cylinder system as
 $U_{r} = \infty$
, as experimentally demonstrated by Assi et al. (Reference Assi, Bearman, Carmo, Meneghini, Sherwin and Willden2013). However, Assi et al. (Reference Assi, Bearman, Carmo, Meneghini, Sherwin and Willden2013) did not conduct an in-depth analysis of the critical mass ratio. Infinite reduced velocity conditions for either the VIV of a single cylinder or the WIV of tandem cylinders are typically achieved by eliminating the mechanical spring, resulting in zero structural stiffness (
 $K = 0$
) and thus
 $U_{r} = \infty$
, which is consistent with the methodology adopted in the present study.
Existing studies have established that the mass ratio
 $m^{*}$
plays a central role in the dynamic responses of both VIV and WIV systems. In single-cylinder VIV, decreasing
 $m^{*}$
broadens the lock-in range and, when
 $m^{*} \lt m_{cr}^{*}$
, leads to sustained large-amplitude oscillations at infinite reduced velocity. However, for WIV, whether an analogous critical mass ratio
 $m_{cr}^{*}$
exists and how it depends on wake interference effects remain unclear. The presence of unsteady wake interactions introduces additional flow instabilities and mode coupling, which may fundamentally modify the transition between quiescent and vibrating states, particularly for extreme-light (EL) structures. Clarifying this issue is important not only for advancing the theoretical understanding of wake–structure interactions, but also for engineering applications. Multi-cylinder arrangements are ubiquitous in offshore risers, heat-exchanger tube bundles and marine structural arrays. To address these issues, the present study systematically investigates the WIV of an EL downstream cylinder placed behind an upstream fixed cylinder. By varying
 $m^{*}$
and
 $L/D$
over a wide parameter range, we identify the vibration-regime boundaries, determine the existence and variation of the critical mass ratio
 $m_{cr}^{*}$
under unsteady wakes and analyse the associated flow-field dynamics responsible for the transition between non-vibrating and sustained-vibration states. The remainder of this paper is organised as follows. The numerical methodology and validation are presented in § 2. The critical mass ratio and the corresponding physical mechanisms are discussed in § 3. The vibration-frequency characteristics and the dependence of the response on reduced velocity are examined in § 4. Finally, the main conclusions are summarised in § 5.
2. Problem formulation
2.1. Physical model
The configuration of the tandem cylinder system is illustrated in figure 1. The downstream EL cylinder, with diameter
 $D$
, undergoes purely transverse oscillations in the wake of the upstream cylinder. The structural damping is set to zero to maximise the vibration amplitude. The Reynolds number is fixed at 60, with a focus on the system response under reduced velocity
 $U_r = \infty$
(defined as
 $U_{r} = 2\pi U_{0}/(\omega _{n} D)$
, where
 $U_{0}$
denotes the free-stream velocity and
 $\omega _{n}$
is the natural frequency). The infinite reduced velocity condition is achieved by setting the system stiffness
 $K$
to zero. The spacing ratio
 $L/D$
is varied from 1.1 to 6.0. Within this range of
 $L/D$
and at the selected Reynolds number, the flow field around the fixed tandem cylinders undergoes a transition from steady to unsteady behaviour, highlighting the influence of the mass ratio
 $m^{*}$
on flow-field stability. The mass ratio
 $m^{*}$
is varied from 0.2 to 14 to identify the critical mass ratio of the EL-cylinder WIV system. The computational domain size, including
 $L_d$
and
 $L_u$
, is selected based on domain-size convergence analysis.
Schematic of the EL-cylinder WIV system. Here
 $L_d$
represents the distance from the upstream cylinder to the lateral boundary, and
 $L_u$
denotes the distance from the upstream cylinder to the inlet boundary.

Figure 1. Long description
A schematic of the extreme-light-cylinder wake-induced vibration system. The diagram shows an upstream cylinder and an extreme-light cylinder in a flow field. The upstream cylinder is positioned at a distance Lu from the lateral boundary and Ld from the inlet boundary. The extreme-light cylinder is connected to a mass-spring-damper system. The flow enters from the left with a velocity profile (U0, 0) and exits to the right as outflow. The distance between the centers of the two cylinders is L, and the diameter of the upstream cylinder is D. The system is designed to study the interaction between the cylinders and the flow, focusing on the vibration induced by the wake of the upstream cylinder.
2.2. Methodology
2.2.1. Numerical methods
The fluid flow is governed by the two-dimensional Navier–Stokes (N–S) equations, including the conservation of mass and momentum, as follows:
 \begin{align} \boldsymbol{\nabla }\boldsymbol{\cdot }\boldsymbol{u} & = 0, \\[-12pt]\nonumber \end{align}
 \begin{align} \frac {\partial \boldsymbol{u}}{\partial t} +\boldsymbol{u} \boldsymbol{\cdot }\boldsymbol{\nabla }\boldsymbol{u} & = -\boldsymbol{\nabla }\!p +\frac {1}{\textit{Re}}\boldsymbol{\nabla} ^2\boldsymbol{u} + \boldsymbol{f}, \end{align}
where the velocity
 $\boldsymbol{u}$
and pressure
 $p$
are non-dimensionalised by
 $U_0$
and
 $\rho _0U_0^2$
, respectively. Other physical quantities, lengths and time are non-dimensionalised by
 $D$
and
 $D/U_0$
, respectively, with
 $t=TU_0/D$
. Note that the force term
 $\boldsymbol{f}$
in (2.2) is the Eulerian force, used to impose the no-slip boundary condition for the immersed boundary method.
The interaction between the fluid and the solid via the immersed boundary method can be calculated by the feedback law (Kim et al. Reference Kim, Baek and Sung2002; Huang et al. Reference Huang, Shin and Sung2007). The Lagrangian forcing
 $\boldsymbol{F}$
is calculated by the penalty approach:
 \begin{align} \boldsymbol{F} = \kappa \int _{0}^{t} (\boldsymbol{U} _{\!ib}-\boldsymbol{U} )\,\text{d}t^{\prime } + \psi (\boldsymbol{U} _{\!ib}-\boldsymbol{U} ) , \end{align}
where
 $\kappa$
and
 $\psi$
are large negative free constants,
 $\boldsymbol{U}$
is the velocity of the immersed solid Lagrangian point and
 $\boldsymbol{U} _{\!ib}$
is the fluid velocity interpolated on the immersed boundary point, expressed as
 \begin{align} \boldsymbol{U} _{\!ib}(s,t) = \int _{\varOmega } \boldsymbol{u}(\boldsymbol{x}, t)\delta (\boldsymbol{X}(s,t)-\boldsymbol{x})\,\text{d}\boldsymbol{x} , \end{align}
with
 $\delta ()$
denoting the Dirac delta function in
 $x$
and
 $y$
directions, defined as
 \begin{align} {\delta ({x}) = \frac {1}{h^2}\phi \left(\frac {x}{h}\right)\phi \left(\frac {y}{h}\right)\!, } \end{align}
where
 $h$
denotes the grid spacing. The four-point delta function
 $\phi (r)$
is used, defined as
 \begin{align} {\phi (r)= \begin{cases} \dfrac {1}{8} (3-2\left | r \right | )+\sqrt {1+4\left | r \right |-4r^2}, & \text{} 0\le \left | r \right |\lt 1,\\[11pt] \dfrac {1}{8} (5-2\left | r \right | )-\sqrt {-7+12\left | r \right |-4r^2}, & \text{} 1\le \left | r \right |\lt 2,\\[11pt] 0, & \text{} 2\le \left | r \right |. \end{cases}} \end{align}
The relationship between the Lagrangian force and the Eulerian force is given by
 \begin{align} \boldsymbol{f}(\boldsymbol{x}, t) = \int _{\varGamma } \boldsymbol{F}(\boldsymbol{X}, t)\delta (\boldsymbol{x} - \boldsymbol{X})\,\text{d}\boldsymbol{X} . \end{align}
The downstream EL cylinder is allowed to oscillate passively in the
 $y$
direction under the action of the fluid flow. The governing equation is given as follows:
 \begin{align} { M\!\ddot {Y } + C\! \dot {Y } + K\! {Y } = F_{\!y},} \end{align}
where
 $M$
,
 $C$
and
 $K$
are the structural mass, damping and stiffness, respectively,
 $\ddot {Y}$
,
 $\dot {Y}$
and
 $Y$
are the acceleration, velocity and displacement of the downstream EL cylinder,
 $F_{\!y}$
is the fluid force acting on a cylinder in the
 $y$
direction, the sum of vortex force
 $F_{v\textit{ortex}}$
and potential added-mass force
 $F_{\textit{potential}} = -[C_A M_{\!f} \ddot {Y}]$
, and
 $C_A$
is the potential added-mass coefficient equal to 1. The equation can be dimensionless by introducing the following dimensionless parameters:
 \begin{equation} \begin{aligned} y &= Y/D, & m^{*} &= 4M/(\pi \rho D^2), & C_{\!y} &= 2F_{y}/(\rho U^{2}D), \\[0.5em] U_{r} &= 2\pi U_{0}/(\omega _{n}D), & \omega _{n} &= \sqrt {K/M}, & \zeta &= C/(2M\omega _{n}). \end{aligned} \end{equation}
Combining (2.8) and (2.9) yields the dimensionless equation for the downstream EL cylinder:
 \begin{align} \ddot {y}+\frac {4\pi \zeta }{U_r} \dot {y} +\left(\frac {2\pi }{U_r} \right)^2 y = \frac {2C_{\!y}}{\pi m^{*}}. \end{align}
2.2.2. The flow solver
The N–S equations are discretised as
 \begin{align} D\boldsymbol{u}^{n+1} &= 0, \\[-12pt]\nonumber \end{align}
 \begin{align} \frac {\boldsymbol{u} ^{n+1}-\boldsymbol{u}^{n}}{\Delta t} +N\boldsymbol{u} ^{n+1} &= -G p^{n+\frac {1}{2}} +\frac {1}{2\textit{Re}}(L\boldsymbol{u} ^{n+1}+L\boldsymbol{u} ^{n})+f^{n}, \end{align}
where
 $N$
,
 $G$
,
 $L$
and
 $D$
are the linearised discrete convective operator, the discrete gradient operator, the discrete Laplacian operator and the discrete divergence operator, respectively. The N–S equations are solved by the fractional step method on a staggered Cartesian grid. The velocity components and momentum forcing are defined on the staggered grid, whereas the pressure is applied at the centres of cells. Fully implicit time advancement is employed, with the Crank–Nicholson scheme being used for the discretisation of the diffusion and convection terms. Decoupling of the velocity and pressure is achieved by block LU decomposition in conjunction with approximate factorisation. Details of the approximate factorisation can be found in Kim et al. (Reference Kim, Baek and Sung2002) and Huang et al. (Reference Huang, Shin and Sung2007). In summary, it can be written as
 \begin{align} \frac {\boldsymbol{u} ^{*}-\boldsymbol{u}^{n}}{\Delta t} +N\boldsymbol{u} ^{*} &= -G p^{n- {1}/{2}} +\frac {1}{2\textit{Re}}(L\boldsymbol{u} ^{*}+L\boldsymbol{u} ^{n})+f^{n}, \\[-28pt] \nonumber \end{align}
 \begin{align} \Delta tDG\delta p &= D \boldsymbol{u} ^{*} , \\[-28pt] \nonumber \end{align}
 \begin{align} \boldsymbol{u}^{n+1} &= \boldsymbol{u}^{*}-\Delta tG\delta p, \\[-28pt] \nonumber \end{align}
 \begin{align} p^{n+ {1}/{2}} &= p^{n- {1}/{2}}+\delta p, \\[0pt] \nonumber \end{align}
where
 $\boldsymbol{u}^{*}$
denotes the intermediate velocity. Due to the implicit treatment of the nonlinear convection terms, further decoupling of the intermediate velocity components is made and finally a system of tridiagonal matrices is formed instead of a large sparse matrix. The momentum equation is then solved directly without iteration, and the computational cost is reduced significantly. The pressure Poisson equation is solved by a direct method using Fast Fourier transform or a multi-grid method. The pressure is then used to correct the velocity field to satisfy the continuity equation.
2.2.3. Discretisation of the cylindrical governing equations
When solving (2.10), the cylinders with an extremely small
 $m^*$
are prone to numerical instability due to added-mass effects. We propose a simple strategy based on the Newmark-
 $\beta$
method and the centre difference format (Belanger et al. Reference Belanger, Paidoussis and de Langre1995; Yvin et al. Reference Yvin, Leroyer, Visonneau and Queutey2018; Han et al. Reference Han, Zhang, Zhang and Huang2025) for solving the dynamical equations with extremely small
 $m^*$
. Considering the dimensionless governing equation at time
 $t + \Delta t$
, the term
 $({\pi }/{2})\ddot {y}_{t+\Delta t}$
is added to both sides of (2.10), yielding
 \begin{align} {\left(\frac {\pi }{2} + 1\right)\ddot {y}_{t+\Delta t}+\frac {4\pi \zeta }{U_r} \dot {y}_{t+\Delta t} +\left(\frac {2\pi }{U_r} \right)^2 y_{t+\Delta t} = \frac {2C_{y}^{t+\Delta t}}{\pi m^*} + \frac {\pi }{2} \ddot {y}_{t+\Delta t}.} \end{align}
Performing the centre difference format for the acceleration term on the right-hand side of the equation, we can obtain
 \begin{align} {\left(\frac {\pi }{2} + 1\right)\ddot {y}_{t+\Delta t}+\frac {4\pi \zeta }{U_r} \dot {y}_{t+\Delta t} +\left(\frac {2\pi }{U_r} \right)^2 y_{t+\Delta t} = \frac {2C_{y}^{t+\Delta t}}{\pi m^*} + \pi \frac {(\Delta t \dot {y}_{t+\Delta t} -y_{t+\Delta t} + y_{t})}{\Delta t^2}.} \end{align}
Based on the linear acceleration assumption of the Newmark-
 $\beta$
method, the expressions for the acceleration and velocity at time
 $t + \Delta t$
are obtained:
 \begin{align} \ddot {y}_{t+\Delta t} = \frac {1}{\beta \Delta t ^2}(y_{t+\Delta t} -y_{t}) - \frac {1}{\beta \Delta t}\dot {y}_{n} - \left(\frac {1}{2 \beta }-1\right) \ddot {y}_{n}, \\[-12pt]\nonumber \end{align}
 \begin{align} \dot {y}_{t+\Delta t} = \frac {\alpha }{\beta \Delta t }(y_{t+\Delta t} -y_{t}) + \left(1- \frac {\alpha }{\beta }\right)\dot {y}_{n} -\left(\frac {\alpha }{2 \beta }-1\right) \Delta t \ddot {y}_{n}. \end{align}
According to previous research (Wang et al. Reference Wang, Song, Mao, Tian, Zhang and Han2020b
), the values of
 $\alpha$
and
 $\beta$
are set to 0.5 and 0.25, respectively. Based on (2.18)–(2.20), the acceleration, velocity and displacement at time
 $t + \Delta t$
are obtained. Details of the present two-way coupling solver can be found in Huang et al. (Reference Huang, Shin and Sung2007).
Validation of flow past a circular cylinder with a mechanical spring at
 $\textit{Re}$
= 150 and
 $m^*$
= 2.546. (a) Vibration amplitudes. (b) Vibration frequency.

2.3. Validations
The computational fluid domain has dimensions of
 $40.96D$
in the streamwise direction and
 $30D$
in the transverse direction, with the centre of the upstream cylinder located
 $10D$
downstream of the inlet boundary and
 $15D$
from both the upper and lower boundaries. The fluid computational domain depicted in figure 1 is discretised into 2049 uniform Eulerian grid points along the
 $x$
direction. Along the
 $y$
direction, a uniform Eulerian grid is maintained over
 $y \in [-4,4]$
, with gradual stretching applied beyond this range. This strategy results in a total of 1 436 349 computational nodes. To ensure consistent resolution coupling between the fluid and structural domains, the Lagrangian grid on the cylinder consists of 157 points. The grid resolution, time-step size (
 $\Delta t = 0.003$
) and domain size were determined through systematic convergence studies, as detailed in Appendix A. The in-house solver used in this study has been previously validated in various applications related to fluid–structure interactions (Huang et al. Reference Huang, Shin and Sung2007; Huang & Sung Reference Huang and Sung2009; Huang & Sung Reference Huang and Sung2010; Uddin et al. Reference Uddin, Huang and Sung2015; Han et al. Reference Han, Zhang, Zhang and Huang2025). For completeness, we further validate the numerical method against the VIV response of a single cylinder. Key parameters align with established benchmarks: Reynolds number
 $\textit{Re} = 150$
and mass ratio
 $m^* = 2.546$
, consistent with prior studies (Carmo et al. Reference Carmo, Sherwin, Bearman and Willden2011; Zhao Reference Zhao2013; Mishra et al. Reference Mishra, Soti, Bhardwaj, Kulkarni and Thompson2020). Comparative results in figure 2 show excellent agreement between simulated and literature-reported maximum amplitude and frequency ratio characteristics within the lock-in region. It should be noted that fluid–structure interaction simulations at extremely low mass ratios are highly sensitive to the added-mass effect, which can induce numerical instability in conventional partitioned coupling algorithms. Further validation examines the
 $m^*$
-dependent VIV response under
 $U_r = \infty$
, with results presented in figure 3(a). The vibration amplitudes show good agreement with previous studies across various
 $m^*$
values (Bourguet Reference Bourguet2023). The minor discrepancies with published results (Navrose & Mittal Reference Navrose and Mittal2017; Shiels et al. Reference Shiels, Leonard and Roshko2001) may arise from differences in numerical schemes and treatment of the added-mass coupling. In addition, the vibration responses of rigidly connected cylinders under
 $U_r = \infty$
are compared with Yu et al. (Reference Yu, Ping, Wang, Bao, Xu, Huang and Xiao2025), as shown in figure 3(b). The results show excellent agreement, further demonstrating the effectiveness of the proposed numerical method. Additionally, fixed tandem cylinder configurations are validated against published results in table 1, demonstrating good agreement in hydrodynamic force coefficients. These validations confirm the robustness and predictive accuracy of the simulation method.
Validation for the fixed tandem cylinder at
 $L/D$
= 3 and
 $\textit{Re}$
= 200.

Table 1. Long description
The table presents a comparison of hydrodynamic force coefficients for fixed tandem cylinders at a Reynolds number of 3 and a spacing ratio of 200. It includes data from various studies and the present work. The table has five rows and five columns. The columns are labeled as follows: References, C D1, mean, C D2, mean, C L1, rms, C L2, rms, and S t. The rows list different studies and the present work, with corresponding values for each coefficient. Row 1: Alam (2016), C D1, mean 1.018, C D2, mean -0.13, C L1, rms 0.022, C L2, rms 0.212, S t 0.125. Row 2: Meneghini et al. (2001), C D1, mean 1.0, C D2, mean -0.08, C L1, rms not provided, C L2, rms not provided, S t 0.125. Row 3: Mahir & Altac (2008), C D1, mean 1.05, C D2, mean -0.56, C L1, rms 0.020, C L2, rms 0.191, S t 0.13. Row 4: Koda & Lien (2013), C D1, mean 1.04, C D2, mean -0.129, C L1, rms 0.016, C L2, rms 0.212, S t 0.127. Row 5: Present, C D1, mean 1.015, C D2, mean -0.124, C L1, rms 0.0202, C L2, rms 0.208, S t 0.125. The table provides a detailed comparison of the hydrodynamic force coefficients, highlighting the variations and agreements among different studies.
Validation of flow past (a) a freely vibrating cylinder without mechanical spring force at
 $\textit{Re}$
= 100 and (b) rigidly connected cylinders without mechanical spring force at
 $L/D$
= 2.0 and
 $\textit{Re}$
= 150.

3. Results
3.1. Classification of flow mode
After validating the mesh resolution, time step and numerical methodology, the simulation scheme is employed to investigate the EL-cylinder WIV responses over a range of spacing ratios (
 $L/D$
) and mass ratios (
 $m^*$
). Figure 4 presents a comprehensive classification of the flow regimes observed within the
 $L/D$
–
 $m^*$
parameter space, along with representative vorticity fields for each regime. Compared with a single-cylinder system, the flow characteristics of the fixed tandem cylinders are considerably more complex due to inter-cylinder interference effects. The gap flow exhibits distinct flow modes at different
 $L/D$
values (Zdravkovich Reference Zdravkovich1987; Sumner Reference Sumner2010): (i) the overshoot regime (
 $1 \lt L/D \lt 1.2$
–
 $1.8$
), in which the shear layers from the upstream cylinder pass directly across the downstream EL cylinder before undergoing periodic vortex shedding; (ii) the reattachment regime (
 $1.2$
–
 $1.8 \lt L/D \lt 3.4$
–
 $3.8$
), where the upstream shear layers reattach to the surface of the EL cylinder; and (iii) the co-shedding regime (
 $L/D \gt 3.8$
), in which vortices are shed synchronously from both the upstream cylinder and EL cylinder. Based on the dynamic interactions between the EL cylinder and the shear layers originating from the upstream cylinder, five distinct flow regimes are identified: (i) alternating reattachment (AR), (ii) combined overshoot and weak alternating reattachment (COWAR), (iii) overshoot (OS), (iv) co-shedding (CS), and (v) steady flow. These regimes are colour-coded in figure 4 for clarity. In the AR regime, shear layers from the upstream cylinder periodically reattach to the EL-cylinder surface. The COWAR regime, a newly identified flow mode occurring at small mass and spacing ratios, is characterised by weak vortices within the gap region. In both the COWAR and OS regimes, the primary shear layers from the upstream cylinder traverse the EL cylinder, forming alternating vortex streets. The CS regime occurs at larger
 $L/D$
values, where the shear layers from the upstream cylinder are fully developed, allowing simultaneous vortex shedding from both cylinders. In the steady flow regime, the EL cylinder remains stationary. The flow regime classification indicates strong fluid–structure energy transfer in the AR, COWAR and CS regimes, which is consistent with the observed pronounced vibration responses.
(a) Flow regime classification and (b) vorticity fields of the EL-cylinder WIV in the
 $L/D$
–
 $m^*$
parameter space. The coloured regions indicate AR (alternating reattachment), OS (overshoot), COWAR (combined overshoot and weak alternating reattachment), CS (co-shedding) and steady flow regimes.

3.2. Vibration response
This section presents a comprehensive analysis of the vibration response characteristics to determine the critical mass ratio (
 $m^{*}_{cr}$
) of the EL-cylinder WIV system. To quantify the vibration amplitude,
 $y_{10}$
– defined as the average of the top 10 % peak amplitudes – is adopted as the representative response metric, following established methodologies (Han et al. Reference Han, Huang, Qin, Wang and Zhao2023a
,
Reference Han, de Langre, Thompson, Hourigan and Zhaob
). While conventional frequency analysis typically examines the ratio of the structural vibration frequency to the natural frequency (Zhang et al. Reference Zhang, Song, Abdelkefi, Yu and Wang2022), this approach becomes invalid when the natural frequency loses its physical meaning due to zero stiffness (
 $K = 0$
). Consequently, a modified frequency ratio is introduced as
 $f^{*}/f_{s}$
, where
 $f^{*}$
denotes the dominant frequency extracted from the time-history signals of the cylinder (displacement or lift force) and
 $f_{s}$
represents the vortex-shedding frequency of a fixed single cylinder at the same Reynolds number. Both
 $f^{*}$
and
 $f_{s}$
are obtained using the fast Fourier transform algorithm.
Vibration responses and vibration-regime classification of the EL-cylinder WIV within the
 $L/D$
–
 $m^*$
parameter space. Here LRV denotes the limited-range vibration regime, NV denotes the non-vibration regime and IRV denotes the infinite-range vibration regime.

Figure 5. Long description
A heat map showing vibration responses and vibration-regime classification of the EL-cylinder WIV within the parameter space. The heat map is divided into three main regions: LRV (limited-range vibration regime), NV (non-vibration regime), and IRV (infinite-range vibration regime). The x-axis represents the parameter m* ranging from 0.25 to 8.00, and the y-axis represents the parameter L/D ranging from 2 to 6. The color scale on the right side of the heat map ranges from 0 to 0.80, indicating the value of y10. The color gradient moves from purple at the lower end of the scale to yellow at the higher end. The heat map shows a clear transition between the different vibration regimes. The LRV region is located in the middle of the heat map, the NV region is primarily located in the bottom right corner, and the IRV region is located in the top right corner. The heat map also includes dotted lines and dashed lines that demarcate the boundaries between these regions. The dotted lines represent the boundaries between the LRV and NV regions, while the dashed lines represent the boundaries between the LRV and IRV regions.
Figure 5 illustrates the amplitude response characteristics of the downstream EL cylinder within the
 $L/D$
–
 $m^*$
parameter space. For a given
 $L/D$
, increasing the mass ratio
 $m^*$
leads to a reduction in vibration amplitude. When
 $1.1 \leq L/D \lt 5.5$
, the amplitude
 $y_{10}$
gradually decreases to zero as
 $m^*$
increases. In contrast, for
 $L/D \geq 5.5$
, the vibration amplitude does not diminish to zero, even at large mass ratios. Based on the vibration responses observed in the
 $L/D$
–
 $m^*$
parameter space, the vibration characteristics can be classified into three regimes: (1) the limited-range vibration (LRV) regime, in which cylinder vibration occurs only within a finite range of
 $m^*$
and the amplitude decreases to zero as
 $m^*$
increases; (2) the infinite-range vibration (IRV) regime, where cylinder vibration persists within the investigated
 $m^*$
range with a non-zero amplitude; and (3) the non-vibration (NV) regime, characterised by a steady flow field with
 $y_{10}=0$
. As shown in figure 5, a critical mass ratio
 $m^{*}_{cr}$
exists for the EL cylinder under the influence of an unsteady wake, marking the transition from the LRV regime to the NV regime. The value of
 $m^{*}_{cr}$
exhibits a strong dependence on the spacing ratio
 $L/D$
. Specifically, when
 $1.1 \leq L/D \lt 3.9$
,
 $m^{*}_{cr}$
increases with increasing
 $L/D$
; beyond this range,
 $m^{*}_{cr}$
decreases rapidly as
 $L/D$
increases. This transition is closely related to the vortex formation length of a single cylinder (see figure 17 in Appendix B), where the vortex formation length,
 $L_{\!f}/D = 3.9$
, coincides with the critical spacing ratio. In fact, the vortex formation location of a single cylinder determines the region in the upstream wake with the most stable vortex structures and the strongest circulation intensity as the spacing ratio of tandem cylinders increases (Gerrard Reference Gerrard1966; Griffin & Ramberg Reference Griffin and Ramberg1974). When the EL cylinder is located near this region, the influence of the upstream cylinder wake is maximised, leading to a larger
 $m^{*}_{cr}$
value. As the EL cylinder moves away from this region, the enhancing effect of the upstream wake gradually weakens, and
 $m^{*}_{cr}$
correspondingly decreases. When
 $m^* \gt m^{*}_{cr}$
, the system reaches a stable state, consistent with the steady flow regime shown in figure 4. Compared with the ‘VIV forever’ phenomenon observed in single-cylinder systems at
 $m^* \lt m^{*}_{cr}$
, the vibration characteristics of the EL cylinder are significantly altered by the presence of an unsteady wake. Experiments by Govardhan & Williamson (Reference Govardhan and Williamson2002) demonstrated that, in single-cylinder VIV, the cylinder undergoes an abrupt transition from a near-stationary state to large-amplitude vibration once
 $m^*$
falls below
 $m^{*}_{cr}$
. In contrast, with an upstream cylinder present, the EL cylinder exhibits a smooth transition in vibration amplitude rather than an abrupt change near
 $m^{*}_{cr}$
. Furthermore, Li et al. (Reference Li, Zhang and Gao2018) investigated the WIV response at
 $L/D = 2$
and
 $\textit{Re} = 60$
, and reported weak vibration at
 $m^* = 5$
under high reduced velocity, which is consistent with the present prediction of
 $m^{*}_{cr}$
. It should be noted that variations in system parameters, such as the Reynolds number, will also lead to changes in the critical mass ratio of the system. The following section further examines the fluid–structure interaction mechanisms underlying these vibration regimes.
Instantaneous vorticity and streamlines over one-quarter period at (a)
 $L/D=1.1$
,
 $m^*=0.2$
and (b)
 $L/D=2.1$
,
 $m^*=0.2$
; (c) time-history amplitude. Red arrows indicate gap-flow direction.

3.2.1. Transition from LRV regime to NV regime
Figure 5 shows that, in the LRV regime, the vibration amplitude of the downstream EL cylinder gradually diminishes to zero with increasing
 $m^*$
. The NV regime corresponds to a zero-amplitude response associated with a steady flow regime (see figure 4). The LRV regime encompasses three flow modes: AR, COWAR and OS. For
 $L/D \leq 1.3$
, the vibration amplitudes remain relatively small (e.g.
 $y_{10}=0.28$
at
 $L/D=1.3$
and
 $m^*=0.2$
). At the same mass ratio, increasing
 $L/D$
to 2.1 results in an abrupt increase in amplitude to 0.68, followed by a gradual rise to 0.74 at
 $L/D=3.0$
. Meanwhile, the boundary of
 $m^{*}_{cr}$
range expands significantly, from
 $m^* \leq 2$
at
 $L/D=1.1$
to
 $m^* \leq 13.5$
at
 $L/D=3.5$
, which correlates closely with transitions among the flow regimes. Figure 6 presents transient flow snapshots at
 $L/D=1.1$
and 2.1 for
 $m^*=0.2$
. Owing to the periodicity of the flow, only one-quarter of a vibration cycle is shown. In the COWAR regime, the shear layers separated from the upstream cylinder bypass the EL cylinder, forming alternating shedding vortices. Unlike the gap-flow dynamics observed in the OS mode (Zhu et al. Reference Zhu, Zhang and Liu2019, Reference Zhu, Zhong and Zhou2021), small vortices shed from the upstream cylinder – barely discernible in the vorticity contours – induce a reversal of the gap flow between moments 2# and 3#. Vortex 2 dissipates upon impinging on the EL cylinder, whereas vortex 1 persists and attracts the gap flow. In the AR regime (figure 6
b), the elongated shear layers promote alternating reattachment onto the EL-cylinder surface. The relatively small vortex in the COWAR regime limits its ability to modify the gap flow, and the stable shear layers surrounding the EL cylinder suppress vibration responses, thereby explaining the weak EL-cylinder WIV responses observed at small
 $L/D$
.
As
 $L/D$
increases further, a transition to the AR regime occurs. Figure 7 presents the spectral analysis of the transverse force coefficients together with vorticity contours at
 $L/D=3.0$
for
 $m^*=0.2$
, 2.0 and 6.5, illustrating the transition from the AR to the OS regime. At
 $m^*=0.2$
, pronounced high-order frequency components appear in the spectra, indicating strong interactions between the cylinder motion and the shear layers; this is accompanied by shear-layer attachment to the surface of the downstream EL cylinder in the vorticity field. Increasing
 $m^*$
, these high-order force components gradually weaken and ultimately vanish in the OS regime. Notably, at
 $m^*=6.5$
, only a single dominant frequency remains, corresponding to vortex shedding from the downstream EL cylinder. The presence of stable shear layers on both sides of the cylinder effectively suppresses vibration responses.
Transverse force coefficient spectra and corresponding vorticity fields at
 $L/D=3.0$
for different
 $m^*$
.

Figure 7. Long description
The image contains three line graphs on the left and three vorticity field visualizations on the right. The line graphs show the transverse force coefficient spectra for different values of m*. Each graph has the same x-axis labeled f_Cy/fs ranging from 0 to 10 and the y-axis labeled A_Cy ranging from 1 x 10^-6 to 10. The three line graphs correspond to different values of m*: 0.2, 2.0, and 6.5. Each graph shows peaks at specific frequencies, with the highest peak decreasing as m* increases. The vorticity fields on the right show the flow patterns around an object for the same values of m*. Each vorticity field has the x-axis labeled x/D and the y-axis labeled y/D, ranging from -2 to 2. The flow patterns change significantly with increasing m*, showing different vortex structures and interactions. The vorticity fields provide a visual representation of the fluid dynamics corresponding to the spectral data in the line graphs.
To further elucidate the fluid–structure interaction characteristics and the associated energy transfer mechanisms in the LRV and NV regimes, representative cases are analysed using dynamic mode decomposition (DMD). The dataset consists of at least 350 consecutive flow-field snapshots sampled at
 $\Delta t = 0.15$
from the fully developed flow. The flow-field region for DMD analysis is defined by
 $x/D \in [0.51, 15]$
and
 $y/D \in [y_c-4, y_c+4]$
, where
 $y_c$
denotes the lateral coordinate of the cylinder centre. The DMD analysis is applied to both vorticity and pressure fields to extract the dominant modal structures and their corresponding energy contributions. The modal decomposition procedure follows established mathematical formulations (Xu et al. Reference Xu, Liu, Li, Zhao and Zhao2023). When dealing with moving cylinder boundaries, the traditional DMD technique may produce spurious structures in the modal results due to the alternating occupation of certain mesh grids by the fluid and solid domains. To avoid this issue, the centre of the EL cylinder is taken as the reference frame, and a coordinate transformation is performed on the flow field (Menon & Mittal Reference Menon and Mittal2020), thereby converting the instantaneous flow field into a reference coordinate system consistent with that of the EL cylinder. The stability of each mode is determined by the location of its Ritz eigenvalue: eigenvalues lying on the unit circle correspond to periodic modes, those inside the circle indicate stable modes and those outside the circle represent unstable modes. Unlike the conventional DMD implementations where modes are normalised to unit norm and modal amplitudes are used to characterise modal energy, at present the modal contribution is evaluated directly from the original mode magnitude and temporal coefficients following Xu et al. (Reference Xu, Liu, Li, Zhao and Zhao2023). The energy ratio of mode
 $j$
is defined as
 \begin{align} {\textit{ER}_{\!j} = \frac {E_{\!j}}{\sum _{j=1}^{r} E_{\!j}},} \end{align}
where
 $E_{\!j}$
denotes the modal energy of the
 $j$
th mode, and the importance of the
 $j$
th mode is quantified by the energy ratio
 $\textit{ER}$
.
Figure 8 presents the Ritz eigenvalue spectra and the modal energy ratios of the first ten modes. The complex eigenvalues appear in conjugate pairs; here, only eigenvalues with non-negative imaginary parts are used to calculate the DMD frequencies. Mode 1 represents the time-averaged mode with
 $f_{DMD}/f_s = 0$
, mode 2 corresponds to the Kármán vortex street mode and mode 3 and higher-order modes represent harmonic modes (Bagheri Reference Bagheri2013). Figure 8(a–c,e–g) corresponds to the LRV regime, whereas figure 8(d,h) represents the NV regime. The eigenvalues are primarily distributed along the unit circle (see figure 8
a–d), indicating that the system dynamics converges to an attractor. In both the COWAR and AR flow regimes (figures 8
e and 8
f), the first two modes dominate the dynamics at low mass ratios. Notably, the modal energy of mode 2 exceeds that of mode 1, while the energy associated with higher-order modes decays progressively. As
 $m^*$
increases, the flow mode transitions to the OS regime (
 $L/D=3.0$
,
 $m^{*} = 6.5$
), the energy contribution of the first-order mode increases markedly, reaching
 $\textit{ER} \approx 0.42$
, which is significantly larger than that of the second-order mode. In the NV regime, corresponding to the steady flow regimes, mode 1 (the time-averaged mode) becomes dominant, as illustrated in figure 8(h).
(a–d) Ritz eigenvalue spectra at different
 $L/D$
and
 $m^*$
, where the cross symbols denote the eigenvalues of the first ten modes; (e–h) modal energy distributions of the first ten modes.

The DMD modes of the vorticity and pressure fields at different
 $L/D$
and
 $m^*$
: (a)
 $L/D=1.1$
,
 $m^*=0.2$
; (b)
 $L/D=3.0$
,
 $m^*=0.2$
; (c)
 $L/D=3.0$
,
 $m^*=6.5$
. The black dashed line represents the trajectory of the vortex development, and
 $L_w$
represents the near-wake modal width, defined as the transverse distance between the two local maxima of the pressure DMD modal magnitude in the near-wake region.

Figure 9. Long description
Panel A: A series of heat maps showing the pressure fields of different vibration modes for circular cylinders. Each subplot represents a different mode with varying frequency ratios. The x-axis is labeled x/D and the y-axis is labeled y/D. The color scale ranges from blue to red, indicating different pressure values. The black dashed line represents the trajectory of vortex development, and L_w represents the near-wake modal width. Panel B: A series of heat maps showing the vorticity fields of different vibration modes for circular cylinders. Each subplot represents a different mode with varying frequency ratios. The x-axis is labeled x/D and the y-axis is labeled y/D. The color scale ranges from blue to red, indicating different vorticity values. The black dashed line represents the trajectory of vortex development, and L_w represents the near-wake modal width. Panel C: A series of heat maps showing the vorticity fields of different vibration modes for circular cylinders. Each subplot represents a different mode with varying frequency ratios. The x-axis is labeled x/D and the y-axis is labeled y/D. The color scale ranges from blue to red, indicating different vorticity values. The black dashed line represents the trajectory of vortex development, and L_w represents the near-wake modal width.
Figure 9 presents the DMD modes of the vorticity and pressure fields under different parameter combinations, corresponding to the cases shown in figure 8(a–c). The vortex development trajectories and the near-wake modal width,
 $L_w$
, are illustrated in the pressure-field modal results. It should be noted that although mode 3 possesses a relatively large energy ratio, it is primarily associated with velocity and drag fluctuations in the streamwise direction; therefore, its contribution to the transverse vibration of the cylinder is relatively limited. This study mainly focuses on modes such as mode 2 and mode 4, which directly influence the transverse force acting on the cylinder. Varying
 $L/D$
and
 $m^*$
, the EL-cylinder WIV system exhibits distinctly different modal characteristics. In the COWAR flow regime (
 $L/D=1.1$
,
 $m^*=0.2$
; figure 9
a), the time-averaged shear layer associated with mode 1 directly traverses the EL cylinder. The modal structures of modes 2 and 4 resemble those of a single-cylinder vortex street. Near the EL cylinder, mode 2 exhibits pronounced near-wake characteristics, whereas mode 4 remains relatively weak. Under this flow condition, both mode 1 and mode 2 possess large energy ratios
 $\textit{ER}$
.
When the spacing ratio increases to the AR flow regime (e.g.
 $L/D=3.0$
,
 $m^*=0.2$
; figure 9
b), the high-gradient shear layer of mode 1 surrounding the EL cylinder shrinks in the streamwise direction and expands in the transverse direction. Although the mode shape of mode 1 exhibits periodic characteristics, it still represents the time-averaged mode. This is because the mesh coordinates are transformed during the DMD preprocessing stage to align with the reference frame of the moving cylinder. Consequently, mode 1 corresponds to the time-averaged mode in the transformed coordinate system, rather than the conventional time-averaged mode associated with a stationary cylinder. Compared with the COWAR regime, the modal energy of mode 1 is decreased, indicating that the vortex-shedding-related modes (e.g. mode 2 and mode 4) gain a competitive advantage in the modal dynamics. Modes 2 and 4 exhibit pronounced modal features within the gap region, and the transverse width of the Kármán vortex street mode is larger than that observed in the COWAR regime (see figures 9
a(iv) and 9
b(iv)). Previous experiments by Assi et al. (Reference Assi, Bearman and Meneghini2010) demonstrated that unsteady vortices shed from the upstream cylinder play a crucial role in sustaining WIV of the downstream cylinder. Consistent with this observation, in the AR flow regime, the upstream shear layers evolve into intense vortices within the gap, exciting a stronger second-order mode and resulting in elevated modal energy for mode 2. The pronounced modal features of modes 2 and 4 around the EL cylinder indicate that higher-order modes govern the system dynamics, which is consistent with the multiple frequency components observed in the transverse force spectra (see figure 7). Under the AR flow regime, the competitive dominance of mode 2 and the higher-order modes over mode 1 promotes the vibration of the EL cylinder.
With a further increase in
 $m^*$
, the flow transitions to the OS regime, and the corresponding modal characteristics are shown in figure 9(c). In this regime, the time-averaged mode resembles that of the COWAR regime but exhibits more pronounced modal features, with the high-gradient shear layer extending over a broader streamwise direction region. In contrast, the modal characteristics of mode 2 – particularly in the near-wake region – are significantly weaker than those observed in the AR regime. Mode 1 becomes energetically dominant over mode 2 in the modal competition. Under this flow condition, the modal energy ratio (
 $\textit{ER}$
) of mode 1 is approximately 0.42, which is substantially larger than that of mode 2. Mode 4 displays modal structures further downstream and has a negligible influence on cylinder vibrations. Consequently, the energy ratio of mode 1 increases in the OS regime, suppressing cylinder vibrations and reducing energy transfer between the EL cylinder and the surrounding fluid. These trends are further corroborated by the pressure DMD results (figures 9
a(iv), 9
b(iv) and 9
c(iv)). The second-order pressure mode exhibits an antisymmetric distribution with respect to
 $y=0$
. In the COWAR and AR flow regimes, high-pressure-gradient structures appear near the EL cylinder, leading to strong fluid–structure interactions and efficient energy transfer between the flow and the cylinder. In contrast, in the OS regime, the pressure gradients near the cylinder are considerably weaker. A more detailed analysis of the energy transfer mechanisms between the fluid flow and the cylinder is presented in § 3.3.
3.2.2. The IRV regime
As shown in figure 5, when
 $L/D \gt 4$
, the critical mass ratio
 $m^{*}_{cr}$
decreases rapidly with increasing
 $L/D$
. For the spacing ratio
 $L/D$
from 5.0 to 5.5, the vibration response transitions to the IRV regime, in which the flow field is characterised by the CS mode. In the IRV regime, the vibration amplitude decreases gradually with increasing
 $m^*$
but remains non-zero within the investigated
 $m^*$
range, indicating the persistent occurrence of WIV. This transition is closely associated with changes in the flow field of fixed tandem-cylinder configurations. Figure 10 shows the variation of the root-mean-square lift coefficient of a fixed downstream cylinder as a function of the spacing ratio at
 $\textit{Re}=60$
. The critical spacing ratio
 $L_{cr}/D$
is identified to lie between
 $L/D=5.0$
and 5.5. When the spacing ratio exceeds
 $L_{cr}/D$
, the flow field becomes unstable, which is consistent with the findings of Li et al. (Reference Li, Zhang and Gao2018). Owing to the shielding effect of the upstream cylinder, the critical Reynolds number for a fixed tandem-cylinder system is higher than that of a single cylinder (
 $\textit{Re} \approx 47$
). As the spacing ratio increases, the shielding effect weakens, as does the suppressive influence of the downstream EL cylinder on the wake of the upstream cylinder, ultimately leading to vortex shedding behind both cylinders. In the IRV regime, the EL cylinder is subjected to strong vortex-shedding forces within the mass ratio range, resulting in persistent non-zero vibration amplitudes. To further elucidate the dynamics underlying the IRV regime, representative cases are selected for DMD analysis. Figure 11 presents the Ritz eigenvalue spectra and modal energy ratios of the first ten modes. Most of the eigenvalues lie on the unit circle. Similar to the LRV regime at small
 $m^*$
, the IRV regime at
 $L/D=5.5$
and
 $m^*=0.2$
is dominated by the first two modes, while the contributions of higher-order modes decay progressively. Figure 12 presents the DMD modes of both the vorticity and pressure fields. Modes 2 and 4 exhibit pronounced modal structures within the gap region, suggesting that higher-order modes play an important role in governing the system dynamics. In the CS flow regime, fully developed vortices are observed in the gap, enabling mode 2 to maintain its advantage over mode 1 in the competition. The pressure-mode distribution shown in figure 12(a.iv) reveals strong pressure-gradient fluctuations on the surface of the EL cylinder, implying intense energy transfer between the cylinder and the surrounding flow. Even at elevated mass ratios, mode 2 maintains a high modal energy ratio
 $\textit{ER}$
, indicating that the cylinder can sustain vibration with a finite amplitude. This behaviour contrasts with that observed in the LRV regime, where the energy ratio of mode 1 increases progressively with increasing
 $m^*$
, while the vibration amplitude approaches zero.
Variation of the root-mean-square lift coefficient of the downstream cylinder with the spacing ratio in fixed tandem cylinders.

(a) Ritz eigenvalue spectrum at
 $L/D=5.5$
and
 $m^*=0.2$
, where the cross symbols denote the eigenvalues of the first ten modes; (b) modal energy distribution of the first ten modes.

(a) The DMD modes of the vorticity and pressure fields at
 $L/D=5.5$
and
 $m^*=0.2$
in the IRV regime. (b) Schematic illustration of the interaction between cylinder motion and vortex shedding. The black dashed line represents the trajectory of the vortex development, and
 $L_w$
represents the near-wake modal width, defined as the transverse distance between the two local maxima of the pressure DMD modal magnitude in the near-wake region.

Figure 12. Long description
Panel A: Four contour plots depict the DMD modes of vorticity and pressure fields in the IRV regime. Each plot shows the spatial distribution of vorticity and pressure around a cylinder. The x-axis represents the streamwise distance normalized by the cylinder diameter (x/D), and the y-axis represents the transverse distance normalized by the cylinder diameter (y/D). The color scales indicate the pressure coefficient (Cp) and the normalized vorticity (ωz*). Panel (i) shows Mode 1 with fDMD/fs = 0, Panel (ii) shows Mode 2 with fDMD/fs = 0.929, Panel (iii) shows Mode 4 with fDMD/fs = 2.788, and Panel (iv) shows Mode 2 with fDMD/fs = 0.929, including a black dashed line representing the trajectory of vortex development and a red arrow indicating the near-wake modal width (Lw = 2.21). Panel B: A schematic illustration shows the interaction between cylinder motion and vortex shedding. The cylinder is depicted in the center, with arrows indicating the direction of motion and vortex shedding. The schematic highlights the feedback loop between cylinder motion and the strengthening of near-wake vortices.
The interaction between wake dynamics and EL-cylinder vibration is schematically illustrated in figure 12(b). From the above analysis, it is evident that mode 1 and mode 2 are the primary governing modes in both the LRV and IRV regimes. Mode 2 sustains the cylinder vibration at a finite amplitude, whereas the strengthening or weakening of mode 1 determines the vibration amplitude of the cylinder. In the LRV regime, mode 1 does not dominate the EL-cylinder WIV system at low mass ratios, and the cylinder vibrates primarily under the influence of mode 2. The cylinder motion modifies the near-wake characteristics of the EL cylinder, thereby increasing the near-wake modal width and enhancing vortex shedding. The enhanced vortex shedding, in turn, further promotes cylinder vibration, eventually leading to a stable vibration state. As the mass ratio increases, mode 1 gradually becomes the dominant component in the EL-cylinder WIV system, and the cylinder vibration is consequently suppressed. The near-wake width decreases significantly; for example,
 $L_w$
decreases from 3.92 to 1.99, as shown in figures 9(b.iv) and 9(c.iv). At the same time, vortex shedding is weakened, as shown in figure 9(c.ii). In the IRV regime, however, the continuous influence of the gap flow prevents mode 1 from dominating the EL-cylinder WIV system, while mode 2 consistently maintains a significant modal energy level. This forms a positive feedback cycle between enhanced cylinder vibration and intensified near-wake dynamics, thereby sustaining finite-amplitude vibrations.
3.3. Energy transfer characteristics
In § 3.2, the modal characteristics of the EL-cylinder WIV system were analysed, revealing that mode 1 and mode 2 are the dominant modes governing the system dynamics. This section further investigates the energy-transfer process in the EL-cylinder WIV system. First, the work done on the system by the transverse force component,
 $C_{y,m2}$
, corresponding to mode 2 is analysed. For cylinders with low mass ratios, the added-mass effect is an important factor influencing the system response, and the work associated with the added-mass force is therefore also a key focus of this section. The transverse force,
 $F_{\!y}$
, acting on the cylinder is decomposed into two components: the potential force,
 $F_{\textit{potential}}$
, and the vortex force,
 $F_{\textit{vortex}}$
, expressed as follows (Williamson & Govardhan Reference Williamson and Govardhan2008):
 \begin{align} {F_{\!y} = F_{\textit{potential}} + F_{v\textit{ortex}}.} \end{align}
Non-dimensionalising all force components by
 $0.5 \rho U_{in}^{2}DL$
yields
 \begin{align} C_{\!y} = C_{\textit{potential}} + C_{v\textit{ortex}}, \end{align}
where
 $C_{\textit{potential}} = - ({\pi }/{2}) \ddot {y}$
. To quantify the effects of these two components, the corresponding power inputs are defined as
 $P_P$
and
 $P_V$
, respectively, as follows:
 \begin{align} P_P = - \frac {\pi }{2} \ddot {y} \dot {y}, \\[-12pt]\nonumber \end{align}
 \begin{align} P_V = C_{v\textit{ortex}} \dot {y}. \end{align}
The kinetic energy ratio
 $C_{\textit{EK}}$
is introduced as the ratio of the cylinder’s kinetic energy
 $E_K$
to the fluid flow’s kinetic energy, to quantify the cylinder’s kinetic energy characteristics, as follows:
 \begin{align} C_{\textit{EK}} = \frac {0.5 m_s \dot {Y}^{2}}{0.5 m_{\!f} \dot {U_0}^{2}} = m^{*} \dot {y}^2. \end{align}
When
 $P_P$
and
 $P_V$
are greater than zero, the fluid performs positive work on the cylinder and transfers energy into the system. Conversely, negative values indicate that the cylinder performs work on the fluid, resulting in energy transfer from the structure to the flow.
As shown in figure 13(a–c), the spectra of
 $C_{\!y}$
and
 $y$
for the cases of
 $L/D=3.0$
,
 $m^{*}=0.2$
;
 $L/D=3.0$
,
 $m^{*}=6.5$
; and
 $L/D=5.5$
,
 $m^{*}=0.2$
are presented. Compared with figures 8 and 11, the dominant frequencies closely correspond to those of mode 2 identified in the DMD results. The dominant frequency component,
 $C_{y,m2}$
, extracted from the transverse force coefficient, is used to evaluate the energy transfer associated with mode 2 between the EL cylinder and the fluid. Here,
 $C_{y,m2}$
is obtained through the fast Fourier transformation of
 $C_{\!y}$
. Similar to (3.5), the corresponding power is calculated as
 $C_{y,m2}\dot {y}$
, and the net energy transfer is evaluated by calculating its time-averaged value. For the case of
 $L/D=3.0$
and
 $m^{*}=0.2$
(figure 13
d), mode 2 is the dominant mode governing the dynamic response of the system. In this case, the phase difference between
 $C_{y,m2}$
and the cylinder velocity
 $\dot {y}$
remains close to 90
 $^\circ$
, and the average power,
 $\bar {P}_{C{y,m2}} = 0.009$
, indicates effective energy transfer from the fluid flow to the EL cylinder. Consequently, the EL cylinder can sustain large-amplitude oscillations. When
 $L/D=3.0$
and
 $m^{*}=6.5$
, mode 1 dominates the modal competition, and the system dynamics is therefore primarily governed by mode 1. Although the phase difference between
 $C_{y,m2}$
and
 $\dot {y}$
remains close to 90
 $^\circ$
, the average power is extremely small. As a result, the EL cylinder vibrates with an extremely small amplitude. At
 $L/D=5.5$
and
 $m^{*}=0.2$
, the fully developed vortices in the gap flow cause mode 2 to become the primary mode governing the system dynamics. In this case, the average power,
 $\bar {P}_{C{y,m2}} = 0.005$
, indicates intense energy exchange between the cylinder and the fluid flow, and the EL cylinder exhibits significant vibration responses.
(a–c) Spectra of the displacement (
 $y$
) of the EL cylinder and the transverse force coefficient (
 $C_{\!y}$
) of the EL cylinder and the upstream cylinder; (d–f) time histories of velocity (
 $\dot {y}$
), the dominant frequency component of the transverse force coefficient (
 $C_{y,m2}$
), the power characteristic (
 $P_{C_{y,m2}}$
) of
 $C_{y,m2}$
and the phase difference (
 $\varPhi$
) between
 $\dot {y}$
and
 $C_{y,m2}$
. (a,d)
 $L/D=3.0$
,
 $m^{*}=0.2$
; (b,e)
 $L/D=3.0$
,
 $m^{*}=6.5$
; and (c, f)
 $L/D=5.5$
,
 $m^{*}=0.2$
. The overbar denotes the cycle-averaged value, and
 $\bar {P}_{C{y,m2}}$
is obtained by averaging over ten periods of
 $P_{C_{y,m2}}$
.

Time histories of displacement, the power of the potential and vortex-shedding forces, the kinetic energy coefficient, the instantaneous pressure coefficient on the EL-cylinder surface and the instantaneous vorticity fields of the EL-cylinder WIV at different
 $L/D$
and
 $m^*$
: (a)
 $L/D=3.0$
,
 $m^{*}=0.2$
; (b)
 $L/D=3.0$
,
 $m^*=6.5$
; and (c)
 $L/D=5.5$
,
 $m^*=0.2$
. Black circles in the vorticity contours indicate the locations of the maximum Reynolds stress,
 $\overline {\boldsymbol{u}'\boldsymbol{u}'}$
.

Figure 14. Long description
The image contains multiple graphs and visual representations related to the vortex-induced vibration (VIV) and wake-induced vibration (WIV) of circular cylinders. Panel A: (a1) A line graph showing the time histories of displacement (y), the power of the potential and vortex-shedding forces (P_P and P_V), and the kinetic energy coefficient (C_EK) for different conditions. The x-axis represents time (t) and the y-axis represents the respective coefficients and displacement. (a2) A line graph showing the instantaneous pressure coefficient (C_p) on the EL-cylinder surface as a function of the angle (θ). The x-axis represents the angle (θ) in degrees and the y-axis represents the pressure coefficient (C_p). (a3) A visual representation of the instantaneous vorticity fields of the EL-cylinder WIV, with color indicating vorticity magnitude (ω_z^*) and black circles marking the locations of maximum Reynolds stress. The x-axis represents the streamwise distance (x/D) and the y-axis represents the transverse distance (y/D). Panel B: (b1) A line graph similar to (a1) but for different conditions. The x-axis represents time (t) and the y-axis represents the respective coefficients and displacement. (b2) A line graph similar to (a2) but for different conditions. The x-axis represents the angle (θ) in degrees and the y-axis represents the pressure coefficient (C_p). (b3) A visual representation of the instantaneous vorticity fields similar to (a3) but for different conditions. The x-axis represents the streamwise distance (x/D) and the y-axis represents the transverse distance (y/D). Panel C: (c1) A line graph similar to (a1) but for different conditions. The x-axis represents time (t) and the y-axis represents the respective coefficients and displacement. (c2) A line graph similar to (a2) but for different conditions. The x-axis represents the angle (θ) in degrees and the y-axis represents the pressure coefficient (C_p). (c3) A visual representation of the instantaneous vorticity fields similar to (a3) but for different conditions. The x-axis represents the streamwise distance (x/D) and the y-axis represents the transverse distance (y/D).
Under low-mass-ratio conditions, the added-mass effect has a significant influence on the EL-cylinder WIV system. The total transverse force acting on the cylinder can be decomposed into the potential-flow force and the vortex-shedding force. Here, we further analyse the energy-transfer characteristics associated with these two force components. Figure 14 presents the temporal evolution of energy transfer, surface pressure coefficients and instantaneous vorticity fields for representative cases in the LRV and IRV regimes, encompassing the AR, OS and CS flow regimes. Peaks in the Reynolds stress, indicated by black circles in the vorticity contours, identify vortex formation locations (Chopra & Mittal Reference Chopra and Mittal2019; Sharma & Bhardwaj Reference Sharma and Bhardwaj2023). The out-of-phase relationship between
 $P_P$
and
 $P_V$
drives cyclic energy exchange, causing the cylinder to oscillate between its equilibrium and limit positions. From moment 1 to 2, the vortex-shedding force dominates the work input, driving the cylinder towards the equilibrium position (note that the system stiffness is zero, and thus no mechanical restoring force acts to return the cylinder to the centre position). During the interval from 2 to 3, the kinetic and potential forces propel the cylinder towards negative displacement. In the AR flow regime (figure 14
a1–a3), vortex formation near the EL cylinder induces pronounced surface pressure fluctuations. Both the vortex-shedding force and the potential force provide substantial energy input to the EL-cylinder WIV system. The pressure-field DMD results (figure 9
b.iv) reveal the second-order mode, antisymmetric about
 $y=0$
, with alternating high and low pressure that promote efficient fluid–structure energy exchange. Within the LRV regimes, as the flow mode transitions from the AR to the OS regime (figure 14
b1–b3), a marked suppression of energy input is observed, as shown in figure 14(b1). Compared with the AR regime, both the work done by the potential force (
 $P_P$
) and that by the vortex-shedding force (
 $P_V$
) decrease significantly. In the OS regime,
 $P_P$
is substantially smaller than
 $P_V$
, rendering the vortex-shedding force dominant in the energy transfer. Since mode 2 loses its dominance in the modal competition with mode 1, the flow field around the EL cylinder becomes more stable compared with that in the AR flow regime. This stabilisation weakens surface-pressure fluctuations and suppresses fluid–structure energy exchange. In the IRV regime, the flow is characterised by the CS mode, in which fully developed vortices form within the gap region (with black circles denoting their formation locations). Unlike the single-cylinder case (see Appendix B), the presence of the downstream EL cylinder suppresses shear-layer separation from the upstream cylinder. Consequently, the vortex formation location relative to the upstream cylinder is reduced to
 $L_{\!f}/D \approx 3.3$
, compared with
 $L_{\!f}/D = 3.9$
for a single cylinder. In the IRV regime, the EL cylinder experiences persistent vortex-shedding forces within the investigated
 $m^*$
range. The DMD results (figure 12) reveal strong second- and fourth-order vorticity modes within the gap flow. In addition, high-gradient pressure-mode regions appear around the EL cylinder (figure 12
a.iv), generating large pressure differences and enabling sustained energy exchange between the fluid and the EL cylinder.
The dimensionless amplitude varies with frequency under different
 $L/D$
and
 $m^*$
.

4. Discussion
4.1. Frequency response
To examine the frequency response of the EL-cylinder WIV system, the vibration amplitudes in figure 5 are replotted against the corresponding frequencies, as shown in figure 15. The analysis focuses on the variation of vibration amplitude with the normalised frequency
 $f_{\textit{osc}}/f_s$
under different spacing ratios
 $L/D$
and mass ratios
 $m^*$
, with comparisons with the vibration responses of a single cylinder. The arrows indicate variations in mass ratio, where
 $m^*$
increases from top to bottom. Navrose & Mittal (Reference Navrose and Mittal2017) investigated the frequency–amplitude response of a single cylinder under infinite
 $U_r$
conditions at different Reynolds numbers. Below the critical mass ratio
 $m^*_{cr}$
, the cylinder exhibited significant vibration amplitudes, which decreased with increasing
 $m^*$
. Meanwhile, the frequency ratio initially decreased to a minimum and then increased as
 $m^{*}$
increased, a trend consistent with the frequency–amplitude response shown in figure 15. However, under unsteady wake conditions, the frequency–amplitude response of the downstream EL cylinder exhibits pronounced variability. The vibration amplitude decreases monotonically with increasing
 $m^*$
, consistent with the observation for a single cylinder that the minimum mass ratio corresponds to the maximum amplitude response. For
 $L/D \lt 4.5$
, the vibration frequency decreases with increasing
 $m^*$
. At the minimum mass ratio
 $m^* = 0.2$
, the vibration frequency gradually increases with increasing
 $L/D$
. At the critical mass ratio
 $m^*_{cr}$
, the amplitude
 $y_{10}$
approaches zero, while the vibration frequency gradually decreases with
 $L/D$
. When
 $L/D = 5$
, the frequency trajectory exhibits distinct behaviour: at small
 $m^*$
, the vibration frequency first decreases and then increases; as
 $m^*$
increases to 2.6, the frequency drops sharply to
 $f_{\textit{osc}}/f_s \approx 0.75$
, accompanied by a significant reduction in vibration amplitude (see figure 5). Owing to the well-developed gap vortex, the gap flow at
 $L/D = 5$
is in a critical transitional state compared with cases with smaller spacing ratios. When
 $L/D = 5.5$
, the flow mode undergoes a complete transition. The vibration frequency decreases from 0.92 to a minimum value of 0.89 and then gradually increases; however, its growth rate is lower than that observed for a single cylinder. A notable change in the amplitude growth trend occurs near
 $L/D = 3$
, which correlates with vortex formation within the gap. As shown in figure 14(c3), the vortex formation length is
 $L_{\!f}/D = 3.3$
. When the spacing ratio exceeds this value, the influence of the upstream shear layer on the EL-cylinder vibration amplitude is significantly weakened.
(a) The dimensionless amplitude
 $y_{10}$
, (b) transverse force coefficient
 $C_{y,\textit{rms}}$
, (c) phase difference
 $\phi$
between the transverse force and displacement and (d) effective added-mass coefficient
 $C_{\textit{EA}}$
as functions of
 $U_r$
for the EL-cylinder WIV system with a mechanical spring. (e) The variation of
 $C_{\textit{EA}}$
at infinite
 $U_r$
in the parameter space of
 $L/D$
and
 $m^*$
.

4.2. Vibration response varies with reduced velocity
Figure 16 illustrates the vibration responses as functions of the reduced velocity
 $U_r$
, where
 $\phi$
denotes the phase difference between the transverse force and the displacement. The coefficient
 $C_{\textit{EA}}$
represents the effective added-mass coefficient, which characterises the apparent effect caused by the transverse force being in phase with the cylinder acceleration. Following the formulation established by Govardhan & Williamson (Reference Govardhan and Williamson2002),
 \begin{align} C_{\textit{EA}} = \frac {C_{\!y} cos(\phi )}{2 \pi ^3 A_{\!y} {\textit{St}}^2}\left(\frac {f_{v0}}{f_{\textit{osc}}}\right)^2 = \frac {C_{\!y} cos(\phi )}{2 \pi ^3 A_{\!y}}\left(\frac {U}{f_{\textit{osc}} D}\right)^2. \end{align}
Govardhan & Williamson (Reference Govardhan and Williamson2002) analysed the behaviour of
 $C_{\textit{EA}}$
for a single cylinder under infinite
 $U_r$
conditions (i.e. in the absence of mechanical springs) in VIV experiments. They reported that as
 $U_r$
approaches infinity,
 $C_{\textit{EA}}$
gradually tends to
 $-m^*$
when
 $m^*$
is below the critical mass ratio.
As the reduced velocity
 $U_r$
increases, a larger vibration amplitude is observed at
 $L/D = 2.5$
, owing to enhanced shear-layer interaction with the EL cylinder. In previous work, Borazjani & Sotiropoulos (Reference Borazjani and Sotiropoulos2009) performed EL-cylinder WIV simulations at
 $\textit{Re} = 200$
and
 $L/D = 1.5$
, showing that the vibration amplitude gradually decreased with increasing
 $U_r$
. The lift coefficient
 $C_{\!y}$
acting on the cylinder first decreased to a minimum and then increased as
 $U_r$
increased. These findings are consistent with the present results. In contrast, experiments reported divergent vibrations at higher reduced velocity, which were attributed to differences in Reynolds number (Assi et al. Reference Assi, Bearman and Meneghini2010). Notably,
 $C_{\textit{EA}}$
approaches zero near
 $U_r = 7$
–
 $8$
, where the vibration amplitude becomes independent of
 $m^*$
, and the phase difference undergoes an out-of-phase transition. A similar phenomenon was reported by Navrose & Mittal (Reference Navrose and Mittal2017) for the VIV of a single cylinder. Under
 $U_r=\infty$
in the EL-cylinder WIV system,
 $C_{\textit{EA}}$
tends to
 $-m^*$
, consistent with the behaviour of a single cylinder. Within the parameter domain
 $m^*, L/D$
, it is likewise satisfied that when
 $U_r \rightarrow \infty$
, if cylinder vibration persists, then
 $C_{\textit{EA}} = -m^*$
, as shown in figure 16(e). It can be observed that in the LRV and IRV regimes, the effective added-mass coefficient varies linearly with the mass ratio.
4.3. Wake stiffness concept at low Reynolds numbers
The WIV experiments of Assi et al. (Reference Assi, Bearman, Carmo, Meneghini, Sherwin and Willden2013) show that, at high Reynolds numbers, the oscillation amplitude of the downstream cylinder increases continuously with increasing Reynolds number
 $\textit{Re}$
. Assi et al. (Reference Assi, Bearman, Carmo, Meneghini, Sherwin and Willden2013) introduced the concept of ‘wake stiffness’ based on the static lift gradient at different transverse locations and pointed out that the vibration frequency of the downstream cylinder does not coincide with the vortex-shedding frequency of the stationary upstream cylinder, but is instead governed by the ‘wake stiffness’ effect. At low Reynolds numbers, the amplitude and frequency responses of the EL cylinder differ from those observed at high Reynolds numbers. The phase-difference results in figure 16(c) show that the phase difference between the transverse force coefficient and the displacement of the downstream cylinder is
 $180^\circ$
, suggesting that, in the absence of mechanical stiffness, the fluid force induced by the upstream wake also acts as an effective restoring force. However, this mechanism differs fundamentally from WIV at high Reynolds numbers. At
 $\textit{Re}=60$
, when
 $m^{*}$
exceeds the critical mass ratio,
 $m^{*}_{cr}$
, the entire flow field becomes stable, and vortex shedding is suppressed, thereby preventing effective wake excitation. Under the OS flow regime, the vibration of the EL cylinder is primarily governed by the vortex shedding generated behind itself, and the applicability of the ‘wake stiffness’ concept becomes limited. In contrast, under the AR flow regime, the shear layers separated from the upstream cylinder alternately attach to the surface of the EL cylinder, resulting in larger-amplitude responses. The spectral results in figure 13(a–c) show that the dominant frequencies of the transverse forces acting on both the upstream cylinder and the EL cylinder, as well as the displacement of the EL cylinder, are identical. This indicates that the vibration response of the EL cylinder is related to the periodic excitation induced by the upstream wake flow. The study of Mysa et al. (Reference Mysa, Kaboudian and Jaiman2016) also demonstrated that the vibration mechanism of the downstream cylinder is primarily governed by the interaction between the cylinder motion and the vortex shedding from the upstream cylinder. These observations suggest that, at low Reynolds numbers, the applicability of the wake stiffness concept is weakened.
5. Conclusions
In this study, the FIVs of an EL cylinder in the wake of a fixed upstream cylinder are numerically investigated. The focus is placed on the existence and characteristics of a critical mass ratio under unsteady wake conditions at
 $U_r \to \infty$
.
Vibration responses across the
 $L/D$
and
 $m^*$
parameter domains reveal three distinct regimes: LRV regime, IRV regime and NV regime. Simulation results confirm that a critical mass ratio
 $m^*_{cr}$
exists at the LRV–NV transition boundary, even for cylinders subjected to unsteady wake. Notably, the amplitude diminishes to zero at
 $m^*_{cr}$
, contrasting with the abrupt amplitude increase observed in single cylinders below
 $m^*_{cr}$
.
Flow-field analyses reveal that
 $m^*_{cr}$
correlates with flow regime transitions. In the LRV regime, increasing
 $m^*$
induces flow transitions from the AR regime or COWAR regime to steady flow. The Kármán vortex street (mode 2) exhibits significant modal energy contributions in the AR/COWAR mode. As
 $m^*$
approaches
 $m^*_{cr}$
, mode 2 energy contributions gradually reduce to zero, coinciding with amplitude extinction. In the IRV regime, the flow exhibits CS modes, where mode 2 maintains substantial energy contributions, and no critical mass ratio is observed within the
 $m^*$
range. The value of
 $m^*_{cr}$
is governed by
 $L/D$
and the vortex formation length
 $L_{\!f}/D$
of a stationary single cylinder. When
 $L/D \lt L_{\!f}/D$
,
 $m^*_{cr}$
increases with
 $L/D$
; conversely, when
 $L/D \gt L_{\!f}/D$
,
 $m^*_{cr}$
decreases as
 $L/D$
increases.
The present study is restricted to a two-dimensional tandem-cylinder configuration at
 $\textit{Re}=60$
, with transverse vibration only and without structural damping. Future work should examine the robustness of the present stability boundary under more realistic conditions, including three-dimensional effects, finite structural damping and higher Reynolds numbers.
Funding
This work was supported by the National Natural Science Foundation of China (grant nos. 12302317, 52277227, 12425206), the Rolling Support Program for Excellent Young Scientists Fund of Henan Province (grant no. 252300421239), the XJTU Young Talent Support Plan and the Fundamental Research Funds for the Central Universities (grant no. xtr052025027).
Declaration of interests
The authors report no conflict of interest.
Data availability statement
The data that support the findings of this study are available from the corresponding author upon reasonable request.
Appendix A. Numerical convergence analysis
A numerical convergence study was conducted for the tandem-cylinder configuration at
 $L/D = 3$
and
 $m^* = 1.0$
to determine the appropriate mesh resolution and time-step size for the simulations. In the mesh-independence verification, a mesh refinement factor of
 $r = 2$
was adopted, meaning that the grid spacing of each refined size is half that of the previous one (Eça & Hoekstra Reference Eça and Hoekstra2014). Considering the relatively small gap spacing in the present studies, the resolution of the first mesh size was set to
 $\Delta g = 1/50D$
, where
 $D$
is the cylinder diameter. Simultaneously, the time step
 $\Delta t$
was set to 0.006, 0.003 and 0.0015. The specific settings are summarised in table 2. Four physical quantities were monitored: vibration amplitude, transverse force coefficient, drag coefficient and Strouhal number. For cases 1#, 2# and 3#, the grid convergence index for case 1#, calculated based on the maximum cylinder displacement
 $y_{max }$
, was 0.17 %, indicating that the mesh configuration is well converged. Furthermore, the relative errors of other physical quantities (with case 3# as the reference) were less than 0.73 %, confirming that a mesh resolution of
 $1/50D$
is sufficient for the present simulations. Time-step sensitivity was assessed using cases 1#, 4# and 5#. The maximum difference for case 1# (relative to case 5#) was 0.06 %, satisfying the temporal convergence requirement. Based on these results, the grid resolution and time step of case 1# were selected for the subsequent simulations, corresponding to 2049 uniformly distributed grid points in the
 $x$
direction.
Results of the EL-cylinder WIV system for varying grid resolutions and time steps.

Table 2. Long description
A table summarizing a numerical convergence study for a tandem-cylinder configuration, detailing mesh resolution and time-step size for simulations. The table has six rows and eight columns. The columns are labeled as Case, Δg, Δt, Nodes, ymax, C_y,rms, C_D,mean, and St. The rows are labeled as 1#, 2#, 3#, 4#, and 5#. Row 1: Case, 1/50; Δg, 0.003; Δt, 1436 349; Nodes, 0.5714; ymax, 0.3459; C_y,rms, 0.7233; C_D,mean, 0.1175; St. Row 2: Case, 1/100; Δg, 0.003; Δt, 4919 296; Nodes, 0.5728; ymax, 0.3468; C_y,rms, 0.7281; C_D,mean, 0.1175; St. Row 3: Case, 1/200; Δg, 0.003; Δt, 16392 192; Nodes, 0.5733; ymax, 0.3471; C_y,rms, 0.7286; C_D,mean, 0.1170; St. Row 4: Case, 1/50; Δg, 0.006; Δt, 1436 349; Nodes, 0.5721; ymax, 0.3462; C_y,rms, 0.7221; C_D,mean, 0.1175; St. Row 5: Case, 1/50; Δg, 0.0015; Δt, 1436 349; Nodes, 0.5713; ymax, 0.3457; C_y,rms, 0.7233; C_D,mean, 0.1175; St.
The influence of computational domain size was further examined. Three computational domain configurations were tested, with the domain width varying from
 $30D$
to
 $60D$
, and the distance between the upstream cylinder and the inlet varying from
 $10D$
to
 $20D$
, as shown in table 3. The mesh resolution and time step were kept fixed at
 $\Delta g = 1/50D$
and
 $\Delta t = 0.003$
, respectively. The corresponding results are also presented in table 3. Based on case 3#, the variations in cylinder vibration amplitude, transverse force coefficient, drag coefficient and Strouhal number were all below 1.0 %. Therefore, the computational domain parameters were selected as
 $L_u = 10D$
and
 $L_d = 15D$
for the present study.
Results of the EL-cylinder WIV system for different domain sizes.

Table 3. Long description
A table with three rows and eight columns comparing different computational domain configurations and their results. The columns are labeled as Case, L_u, L_d, Nodes, y_max, C_y_rms, C_D_mean, and St. The rows present data for three different cases. Row 1: Case 1#, L_u 10, L_d 15, Nodes 1436349, y_max 0.5714, C_y_rms 0.3459, C_D_mean 0.7233, St 0.1175. Row 2: Case 2#, L_u 15, L_d 20, Nodes 1933459, y_max 0.5710, C_y_rms 0.3446, C_D_mean 0.7215, St 0.1175. Row 3: Case 3#, L_u 20, L_d 30, Nodes 2806449, y_max 0.5707, C_y_rms 0.3450, C_D_mean 0.7159, St 0.1175. The table shows the variations in cylinder vibration amplitude, transverse force coefficient, drag coefficient, and Strouhal number for different domain sizes.
Appendix B. Flow around a fixed cylinder at
 $\textit{Re}$
= 60

Using the same grid resolution and time-step size as those adopted for the EL-cylinder WIV system, the flow around a fixed single cylinder at a Reynolds number of 60 is simulated. The analysis focuses on the vortex formation length (
 $L_{\!f}$
), defined as the distance from the centre of the cylinder to the location where vortices develop and are shed. Chopra & Mittal (Reference Chopra and Mittal2019) reviewed various methods for determining
 $L_{\!f}$
. In the present study, the criterion based on the Reynolds stress component
 $\overline {\boldsymbol{u}^{\prime }\boldsymbol{u}^{\prime }}$
is employed. The vortex formation length
 $L_{\!f}$
is calculated as the distance between the location of maximum Reynolds stress and the centre of the cylinder. Here,
 $\boldsymbol{u}^{\prime }$
denotes the fluctuation of the streamwise velocity component relative to the time-averaged flow. Figure 17 presents the vorticity field and the corresponding vortex formation length for a single cylinder. It is observed that
 $L_{\!f}/D = 3.9$
, which is larger than the value shown in figure 14, owing to the absence of obstruction effects from the downstream EL cylinder on the shear layer of the fixed cylinder.
(a) Vorticity field and (b) corresponding vortex formation length
 $L_{\!f}$
for flow past a fixed cylinder at
 $\textit{Re} = 60$
.


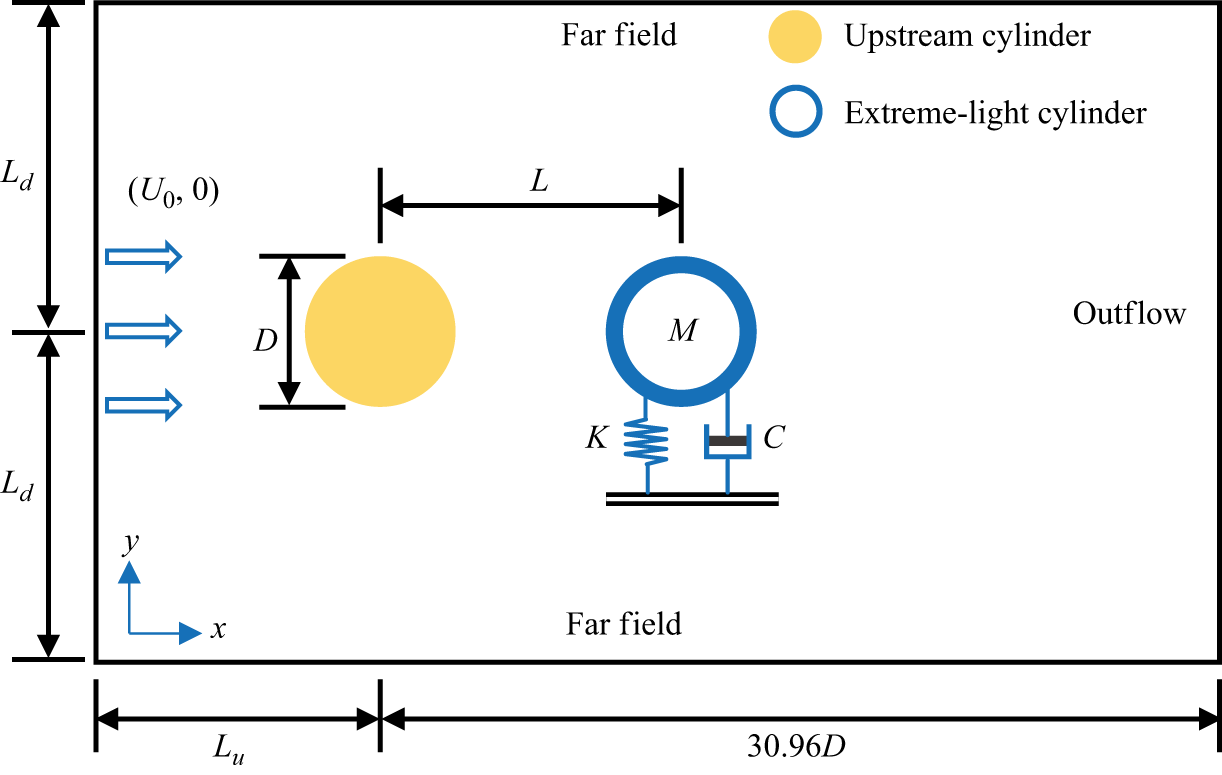
 Ld
 Lu
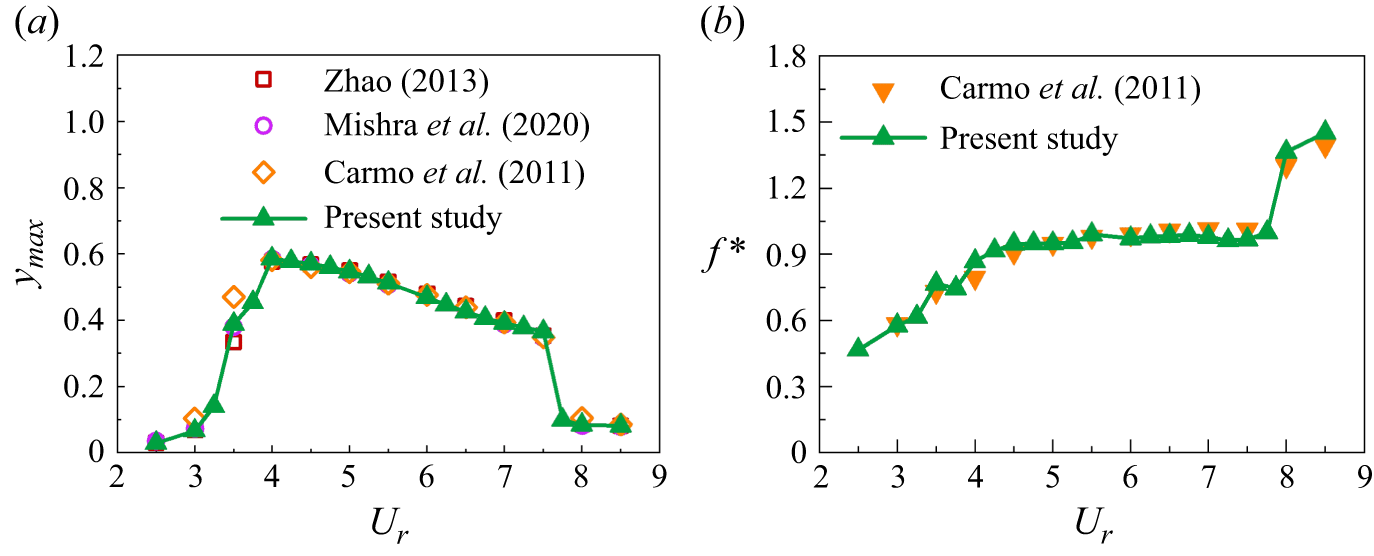
 Re
 m∗
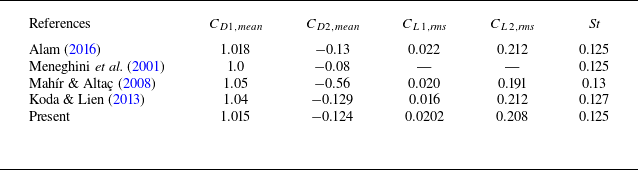
 L/D
 Re
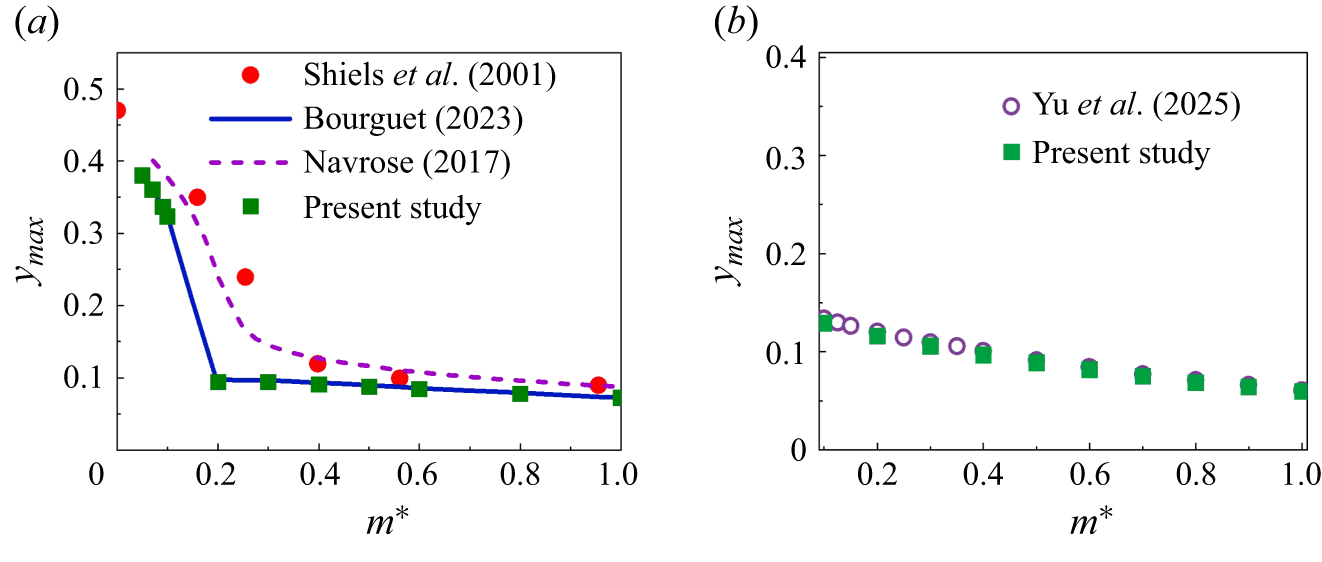
 Re
 L/D
 Re
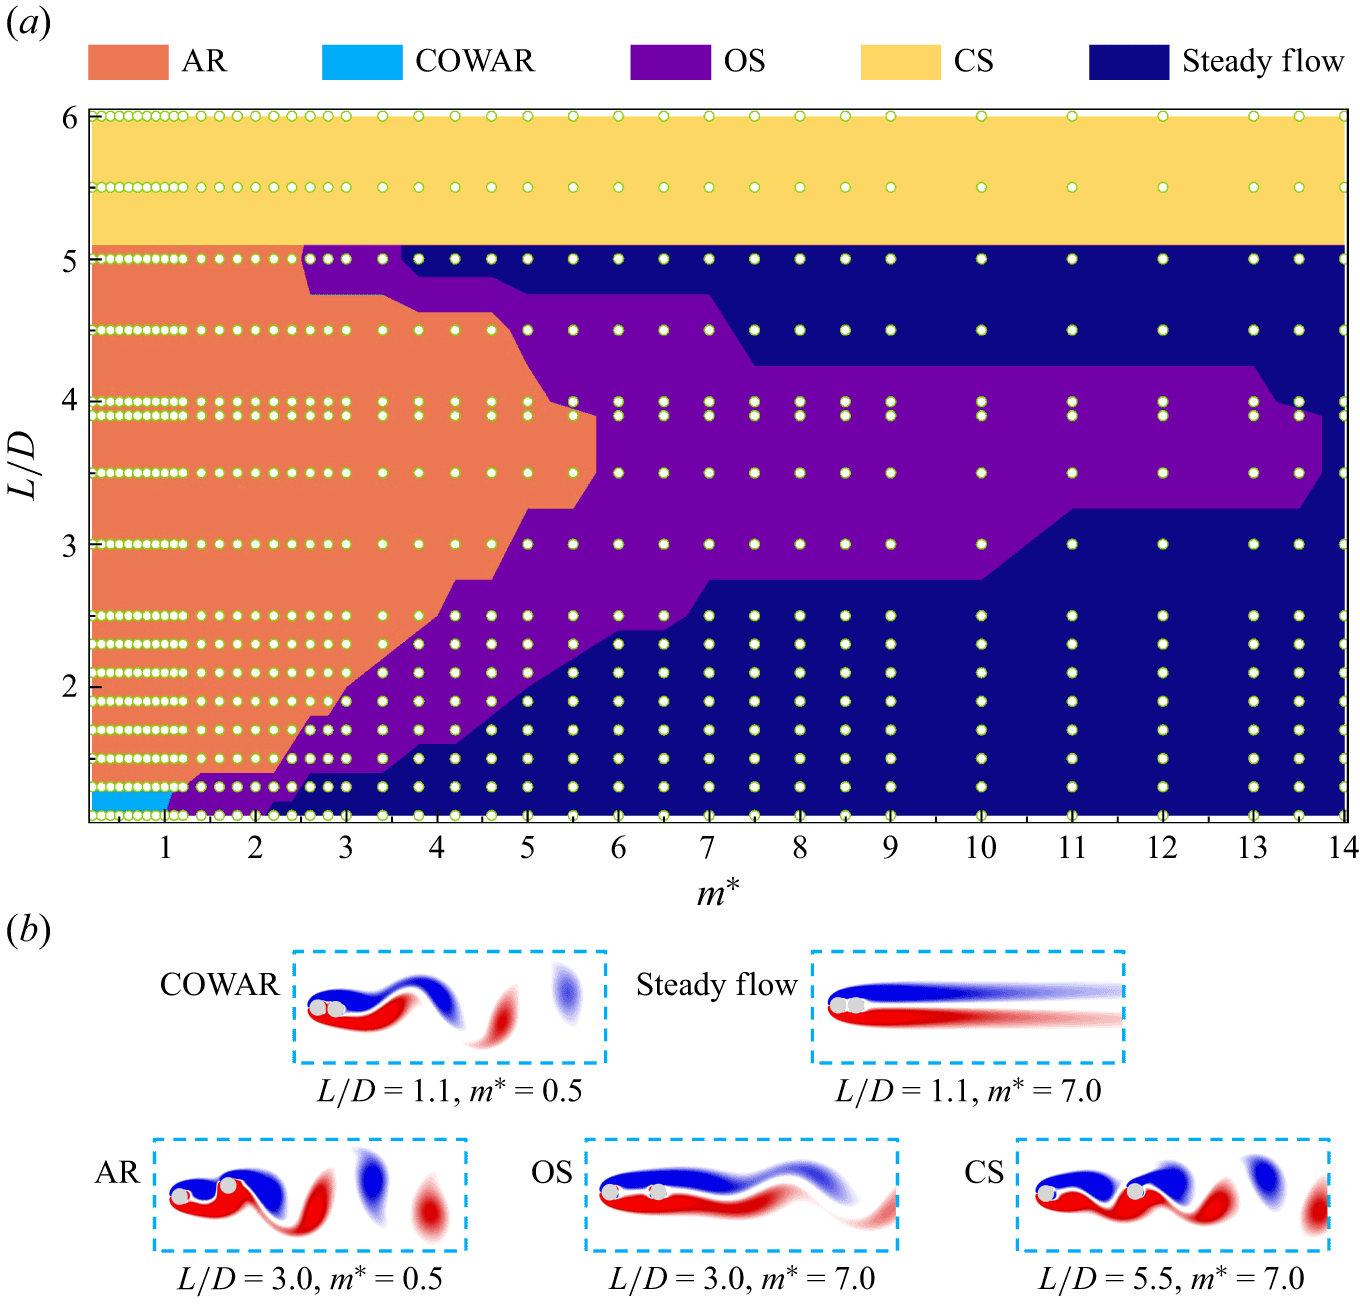
 L/D
 m∗
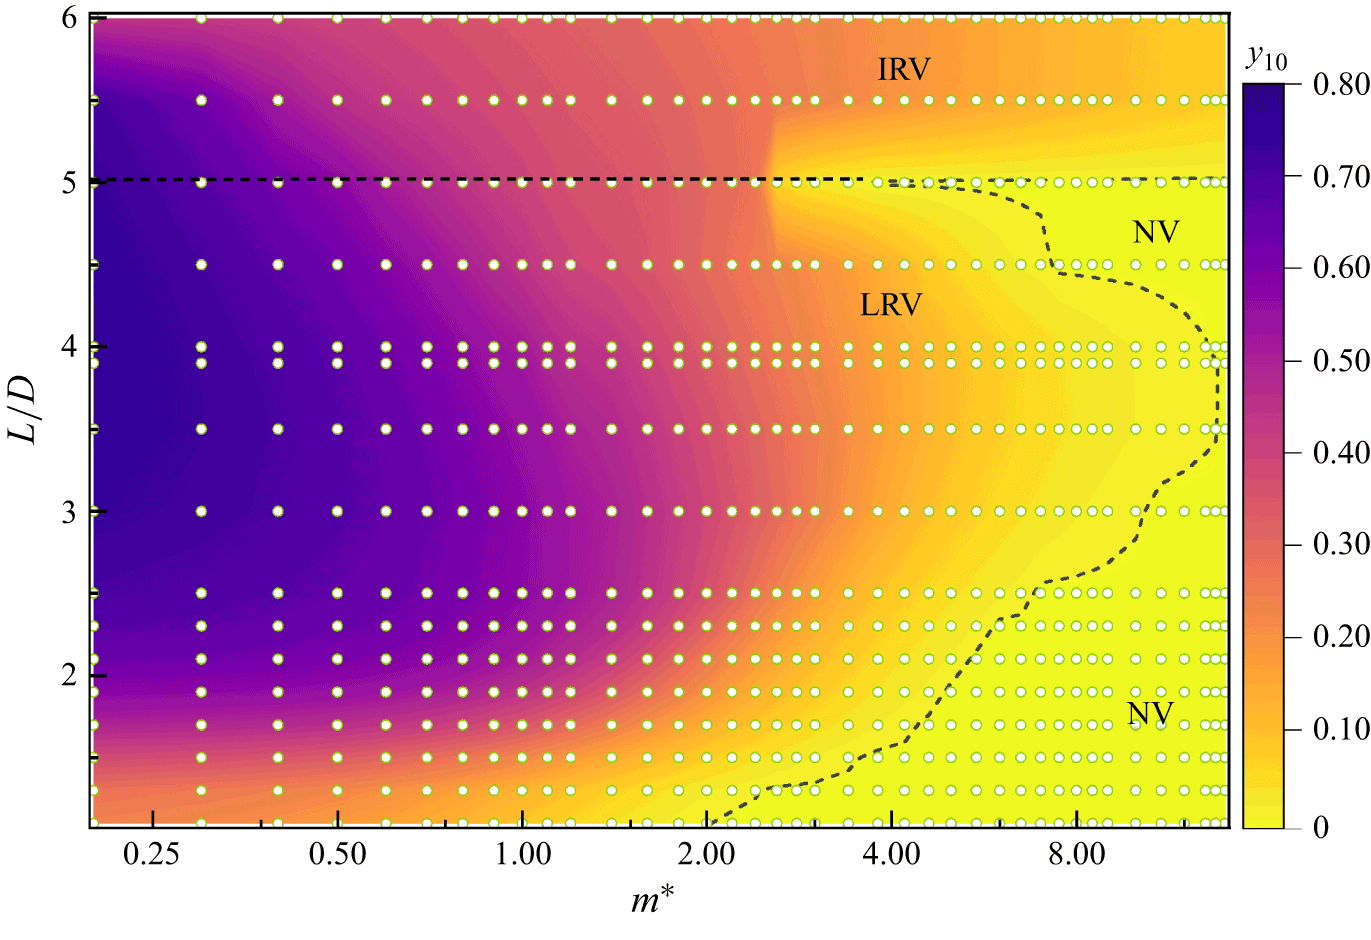
 L/D
 m∗
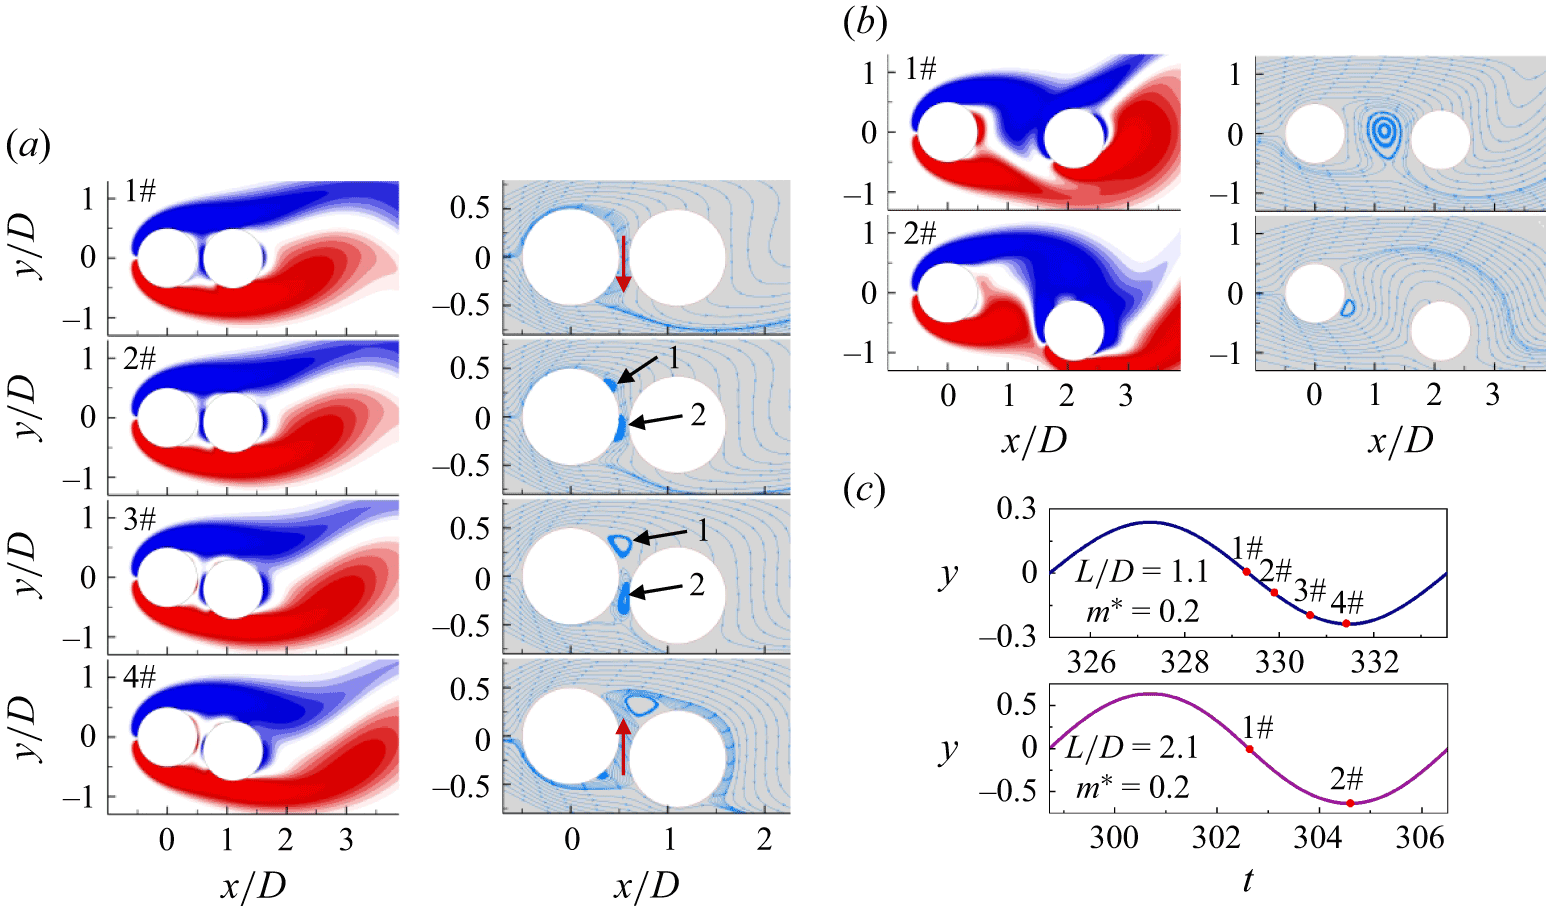
 L/D=1.1
 m∗=0.2
 L/D=2.1
 m∗=0.2
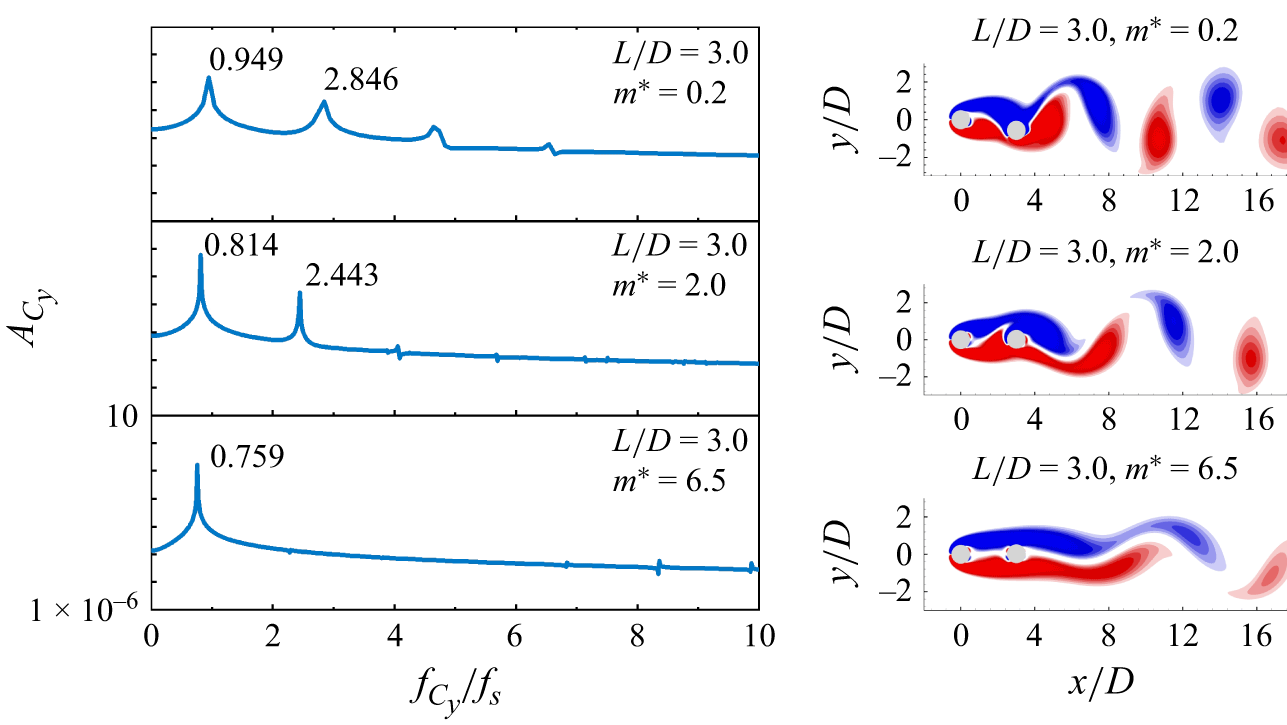
 L/D=3.0
 m∗
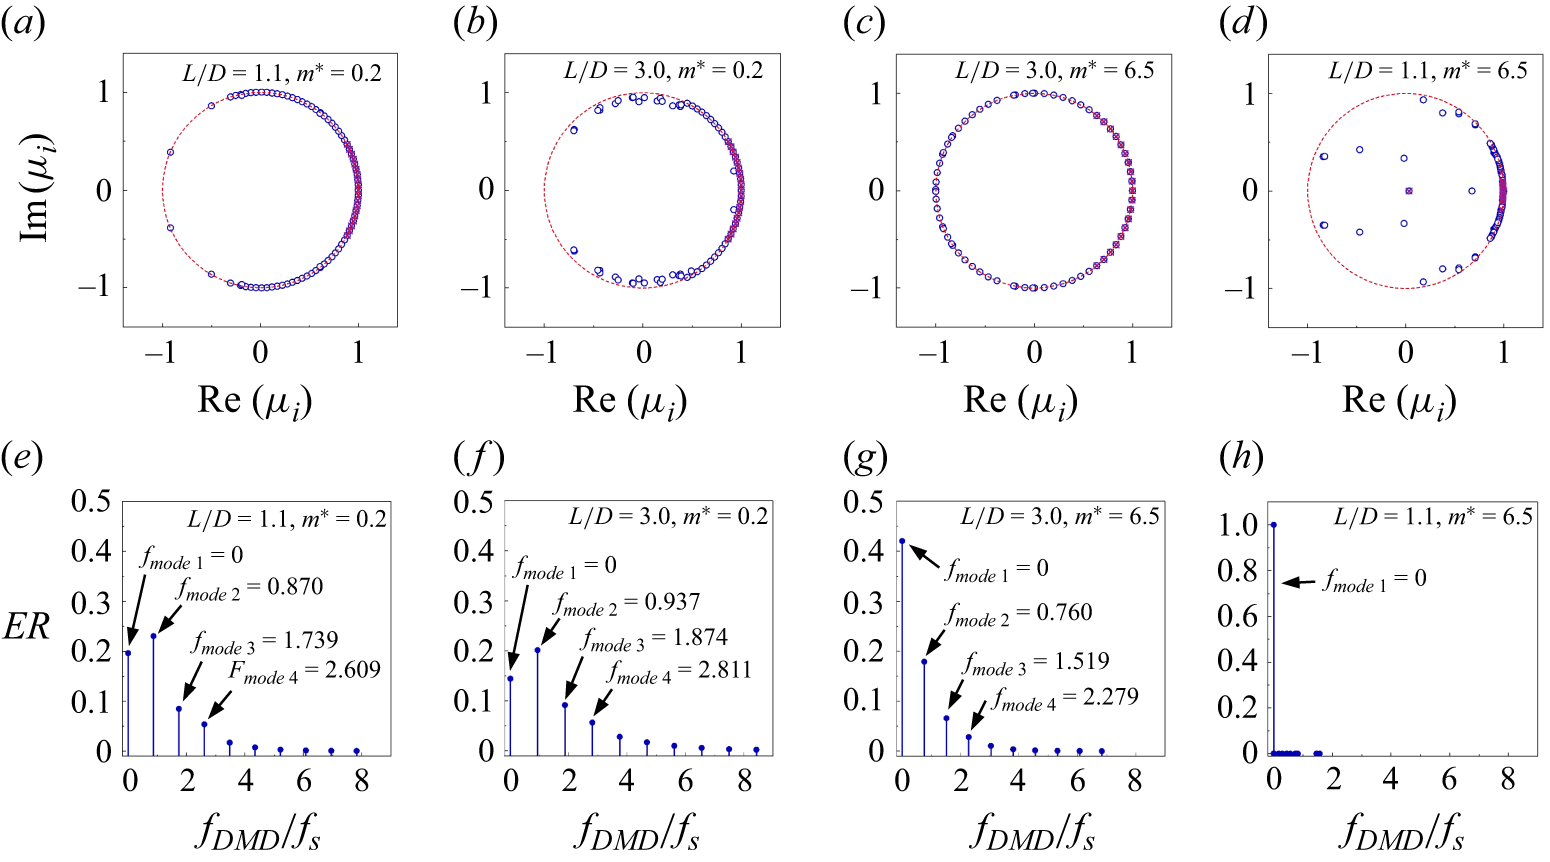
 L/D
 m∗
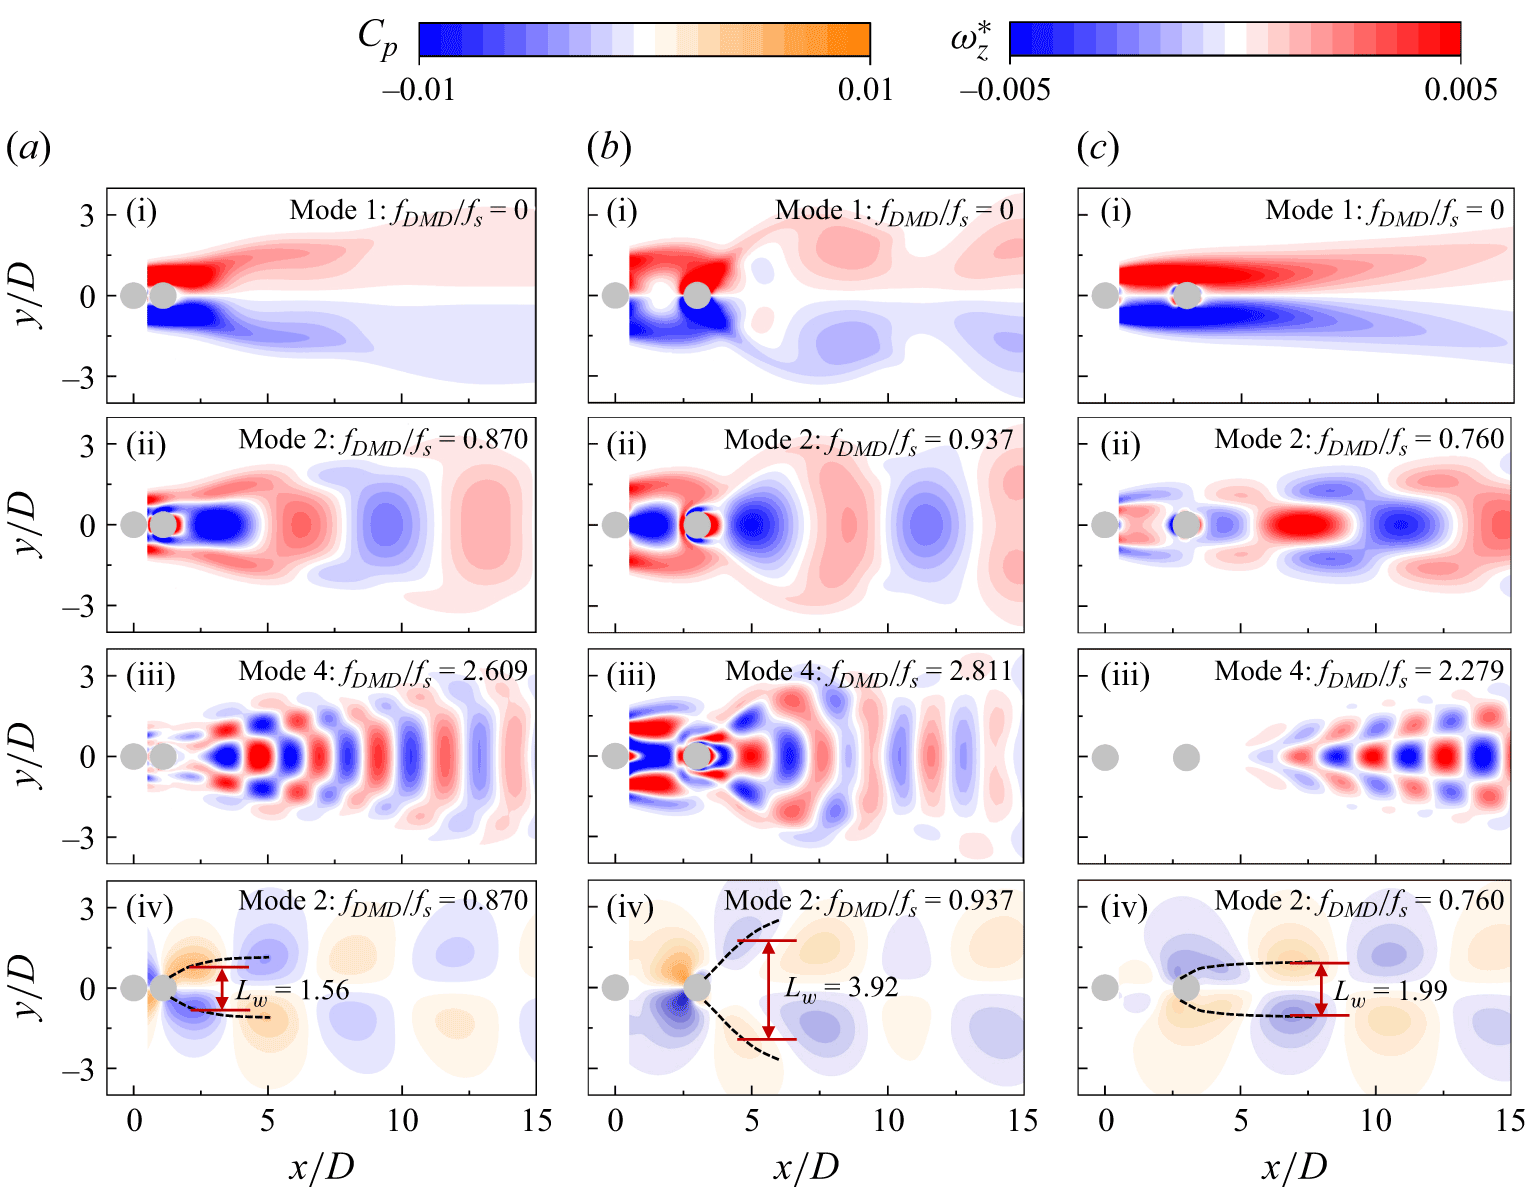
 L/D
 m∗
 L/D=1.1
 m∗=0.2
 L/D=3.0
 m∗=0.2
 L/D=3.0
 m∗=6.5
 Lw


 L/D=5.5
 m∗=0.2

 L/D=5.5
 m∗=0.2
 Lw

 y
 Cy
 y˙
 Cy,m2
 PCy,m2
 Cy,m2
 Φ
 y˙
 Cy,m2
 L/D=3.0
 m∗=0.2
 L/D=3.0
 m∗=6.5
 L/D=5.5
 m∗=0.2
 P¯Cy,m2
 PCy,m2

 L/D
 m∗
 L/D=3.0
 m∗=0.2
 L/D=3.0
 m∗=6.5
 L/D=5.5
 m∗=0.2
 u′u′¯

 L/D
 m∗

 y10
 Cy,rms
 ϕ
 CEA
 Ur
 CEA
 Ur
 L/D
 m∗
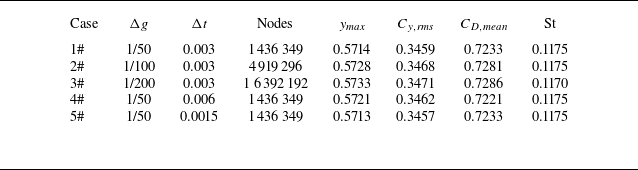
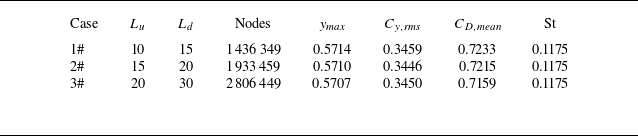

 Lf
 Re=60


