Introduction
Detection and monitoring of invasive species is becoming critically important because of globalization and climate change (Carruthers, Reference Carruthers2003; Hulme, Reference Hulme2009; Ziska et al., Reference Ziska, Blumenthal, Runion, Hunt and Diaz-Soltero2011; Sanderson et al., Reference Sanderson, McLaughlin and Antunes2012). One of the most sensitive means of detecting invasive insects and monitoring their population levels is the use of traps baited with pheromones or other attractive semiochemicals (Allen et al., Reference Allen, Abrahamson, Eggen, Lanier, Swier, Kelley and Auger1986; Gage et al., Reference Gage, Wirth and Simmons1990; Asaro et al., Reference Asaro, Cameron, Nowak, Grosman, Seckinger and Berisford2004; Walton et al., Reference Walton, Daane and Pringle2004; El-Sayed et al., Reference El-Sayed, Suckling, Wearing and Byers2006). The lesser date moth (LDM) Batrachedra amydraula Meyrick (Lepidoptera: Batrachedridae) was introduced to Israel about 45 years ago. LDM is currently a major pest of date palm fruits, a food staple over a wide geographical range covering North Africa through the Middle East, from Saudi Arabia to Iraq and Iran as well as India and Pakistan. LDM larvae attack both the young and mature fruits (Shayesteh et al., Reference Shayesteh, Marouf and Amir–Maafi2010) and without treatment yield can be reduced to 30%. Additional damage can result from larval webs that stick neighbouring fruits together, causing the fruit to be attacked by Aspergillus fungi and to develop black rot during ripening. This accelerates sap beetle infestation of the date bunch (Blumberg, Reference Blumberg2008).
Until recently, monitoring of LDM in Israel was performed manually by counting larvae in shed fruitlets starting when 60% of flowers have opened. In Pakistan, adult populations have been monitored by means of light traps and sweep nets (Kakar et al., Reference Kakar, Nizamani, Rustamani and Khuhro2010) but these methods are laborious and many non-target species also are captured. Control of LDM has been done mainly by pesticides, such as spinosad, triflumuron and teflubenzuron, because natural enemies were found ineffective (Blumberg, Reference Blumberg2008). When fruits are small, the larva may move from one fruit to another and be exposed to pesticides. The detection of this mobile stage is very important for successful application of pesticides. When fruits are larger, the larvae remain to feed on the inside of fruits and thus are protected from insecticides. Manual sampling to detect larvae is difficult and expensive because of the high cost of using lifting machines to reach date bunches.
The development of pheromone traps for monitoring LDM was delayed because repeated attempts to identify the pheromone of B. amydraula over the past 45 years were unsuccessful. The problem was due to the difficulty of rearing the moth on an artificial diet (Blumberg, Reference Blumberg2008) and to the extremely small amount of pheromone released by the female. However, these problems were circumvented by using the recently developed technique of Sequential SPME/GCMS Analysis (SSGA), which is sensitive to circadian-released volatiles and enabled the identification of the LDM pheromone from only a few calling females (Levi-Zada et al., Reference Levi-Zada, Fefer, Anshelevitch, Litovsky, Bengtsson, Gindin and Soroker2011, Reference Levi-Zada, Sadowsky, Dobrinin, David, Ticuchinski, Fefer, Greenberg and Blumberg2013, Reference Levi-Zada, David, Fefer, Seplyarsky, Sadowsky, Dobrinin, Ticuchinski, Harari, Blumberg and Dunkelblum2014). LDM pheromone is comprised of three components: Z5-decenyl acetate (Z5–10:Ac), Z5-decen-1-ol (Z5–10:OH) and (Z4,Z7)-4,7-decadien-1-acetate ((Z4,Z7)-10:Ac) in a ratio of 2:2:1, respectively. Earlier, we performed initial experiments to select a trap and determine what placement height was necessary for monitoring (Levi-Zada et al., Reference Levi-Zada, Sadowsky, Dobrinin, David, Ticuchinski, Fefer, Greenberg and Blumberg2013). In the present work we continue to improve the monitoring system; i.e. we examined lure and trap parameters, determined the daily flight rhythm of males, sampled seasonal population abundance in date plantations of two common date varieties in Israel, and evaluated pheromone trap interactions. We also investigated spatial and chemical parameters affecting pheromone-baited trap catches and used these to estimate a circular attraction radius that would intercept 100% of the insects in numbers equivalent to the catch of an attractive pheromone trap (Byers, Reference Byers2007, Reference Byers2011, Reference Byers2012a , Reference Byers b ). The circular effective attraction radius (EARc) is independent of population density and used in encounter-rate equations (Byers & Naranjo, Reference Byers and Naranjo2014) to gain insights for development of effective detection, monitoring and mass-trapping programmes for management of LDM. These methods and results should prove useful for many other pest species.
Material and methods
Optimization of LDM pheromone bait for monitoring
A dose–response test of LDM pheromone was performed in the field to find the appropriate bait that attracted large numbers of male moths and also was efficient in use of the pheromone. The LDM pheromone consists of a ternary blend of Z5–10:Ac: Z5–10:OH (Bedoukian, Danbury, USA, 98% isomeric purity): Z4,Z7–10:Ac (from our stock, Levi-Zada et al., Reference Levi-Zada, Sadowsky, Dobrinin, David, Ticuchinski, Fefer, Greenberg and Blumberg2013) in a 2:2:1 ratio. Grey rubber septa (West & Co., Lionville, PA) were impregnated with either 0.1, 0.5, 1, 2 or 10 mg pheromone (each dose n = 5) dissolved in n-hexane with 0.05 mg BHT antioxidant (Sigma, Rehovot, Israel). Several other slow-release devices (n = 5 each type) were evaluated in this experiment using 1 mg of pheromone: 1 ml polyethylene vial (Just Plastic Ltd, Norfolk, UK), same vial with 50 µl light mineral oil (Sigma, Rehovot, Israel), and red rubber septa (Yogev Ltd, Ness Ziona, Israel). This experiment was conducted in a Deglet nour variety date plantation from 13 March to 17 April 2013 (35 days). In a second experiment in the same plantation from 22 May to 9 June 2013 (18 days), 1, 10, 20 or 50 mg pheromone impregnated in grey rubber septa were tested, while empty traps served as control (n = 5 each treatment). The delta traps 7 cm (h) × 9 cm (w) × 15 cm (l) were prepared from white polypropylene sheets. A sticky card insert (Chemtica, Heredia, Costa Rica) was used as the floor of the trap. Unless otherwise stated, pheromone traps were hung at a height of 2 m above ground on a palm trunk in a date orchard in the Southern Arava Valley, Israel. Treatments were replicated in a randomized block design with 27 m between traps (every fourth tree) and rotated one position after each count (approximately every week) during the experiments.
Pheromone bait longevity in the field
In order to determine pheromone release rates and longevity of attractiveness of lures under field conditions, 54 baits of 1 mg pheromone in grey rubber septa, chosen as monitoring lures (MT), were exposed in a date plantation in Southern Arava valley for various periods from 1 to 10 weeks (26 May to 5 August 2014). The temperature in the area ranged from 24 to >40°C, daily average humidity 12–50%, and average wind velocity 7 km h−1 with gusts to 40 km h−1. Groups of nine baits each were removed after 15, 29, 48, 57 and 70 days, wrapped in aluminium foil and kept refrigerated at 4°C. After the last group of baits, aged for 70 days, was removed from the field, lures of each age group and fresh lures as control (n = 5) were placed inside delta sticky traps and exposed in the field for 14 days (11–26 August 2014) in a date orchard at a height of 2 m above ground on the tree trunk and in a randomized block with 27 m between traps (every fourth tree). The trap catch of each age group was recorded.
The remaining four baits of each age group were chemically analysed for pheromone residue. Each lure was immersed in n-hexane (6 ml), sonicated for 2 h in an ultrasonic bath; decanyl acetate and n-decanol (200 µg in 100 µl n-hexane each) were added as internal standards. Analyses were performed on an Agilent 7890A GC instrument interfaced with an Agilent 5975C MS detector and FID detector working in parallel (Agilent, Santa Clara, CA, USA). The GC was equipped with a polar VF–23 MS (Varian, Lake forest, CA, USA) column (30 m × 0.25 mm ID × 0.25 µm film) that was kept at 50°C for 5 min, then programmed at 5°C min−1 to 230°C and held an additional 10 min. Column helium flow was 1.5 ml min−1 and the GC–MS inlet temperature was 230°C with an injection time of 1 min in splitless mode.
Tests of trap design and colour
Four different types of traps each baited with 1 mg pheromone in grey rubber septa were tested in a Deglet nour plantation (20–27 May 2014): (a) self-assembly delta traps made from white polypropylene sheets with a sticky insert floor of 9 × 15 cm2, (b) delta traps with an internal surface of 18 × 27 cm2 covered with adhesive (Suttera, Bend, OR, USA), (c) transparent plastic bottle of 0.5 litre with three 1 cm holes on the top part and (d) transparent 1.5 litres plastic bottle with four 1 cm holes on the top part. The bottles were filled with a solution of 2.5 g l−1 surfactant (‘90’, Makhteshim – Adama, Lod, Israel) to 3 cm depth. In a second experiment conducted in a Deglet nour plantation from 26 August to 9 September 2014, red (Suttera) and white (Ducart group, Kfar Masaryk, Israel) delta traps both with an internal surface of 18 × 27 cm2 covered with adhesive were tested. The white traps were covered inside with Rimifoot sticky paste (Rimi, Petah Tikva, Israel). In a third experiment, delta traps with a sticky removable floor were prepared from white, transparent, yellow, green, red, blue or black polypropylene sheets, 7 cm (h) × 9 cm (w) × 15 cm (l), and baited with 1 mg pheromone in grey septa. They were hung for 1 week in a Deglet nour plantation during 3–10 June 2013 (n = 4 each colour).
LDM diurnal and seasonal activity and larval monitoring
The diurnal flight activity of males was monitored with six delta sticky traps each baited with 1 mg pheromone and hung at 2 m height on palm trees. The traps were 36 m apart in the centre of a date plantation for 24 h and captures were recorded every hour throughout the night (00:00–08:00 AM) and every 2 h during the rest of the day on 4 days: 3, 5, 7 and 11 July 2016.
The seasonal flight activity of males was monitored during 3 years (2013–2015) in 8–10 date plantations of Majhool and Deglet nour varieties in Southern Arava valley using 1 mg pheromone-baited sticky traps. Four to six traps were placed in each plantation and monitored every 7–10 days and the sticky insert was replaced if needed. Baits were replaced every 4–5 weeks. Sampling for larvae was done in four trees of each of the monitored plantations in 2013 and 2014 beginning in April when 60% of the flowers were open until date bunches were covered with a screen by commercial operations at the beginning of July. Due to results from previous years, the sampling of the larvae in 2015 began earlier, from mid-March until the end of June in three plantations of each date variety. Every 7–14 days all date bunches of four trees were shaken into a plastic bucket and dropped fruits were brought to the laboratory and inspected immediately for larvae.
Design of ‘female-dosage’ (FD) bait
A female LDM releases only a few ng per calling period (Levi-Zada et al., Reference Levi-Zada, Sadowsky, Dobrinin, David, Ticuchinski, Fefer, Greenberg and Blumberg2013) and cannot survive in a caged trap in the desert. Therefore, we prepared a FD lure for use in experiments to determine likely effects of monitoring traps on natural females. The trial was conducted from 6 April to 14 May 2014 (38 days) in an orchard infested with LDM. Grey rubber septa with doses of 1, 5, 10 or 20 µg in delta sticky traps placed 27 m apart (every fourth tree) were tested. The baited traps and the empty control traps (n = 5) were rotated weekly after catches were recorded.
Monitoring trap distance of influence estimated with FD traps
The overall goal of the following experiments was to estimate the distance of influence of an MT trap, a distance of separation between MT traps that may give efficient mass trapping. Traps baited with 1 mg pheromone were used for monitoring (MT) and traps baited with 10 µg pheromone were used as the ‘FD’. Delta traps with sticky card floor were used for both MT and FD baits. Two experiments were conducted in two Deglet nour date plantations: (a) a central MT trap with four equidistant radiating lines of FD traps placed on trees planted at 9, 18, 27, 36, 45 and 54 m from the central MT trap (24 April to 31 May 2015) and (b) a central MT trap with radiating lines of FD traps in each of four cardinal directions, each line with traps at distances of 9, 18, 27, 36, 45, 54, 63 and 72 m from the MT trap (11–31 May and 31 May–5 July 2015).
Effective attraction radius (EAR) of baited trap and LDM vertical flight distribution
The spherical EAR is used to measure attractive strength of different attractant baits and to simulate insect trapping in three-dimensional models (Byers, Reference Byers2011). In practice, the spherical EAR is based on a ratio of catch in a pheromone trap and a blank trap that is converted to a EARc that can be employed in more convenient two-dimensional simulation models as well as in encounter rate equations (Byers, Reference Byers2012a , Reference Byers b ; Byers & Naranjo, Reference Byers and Naranjo2014). In order to determine EAR, 14 1.5 litres plastic bottles without baits were placed on poles at 2 m height and compared with four delta traps with 1 mg (MT) and four delta traps with 10 µg (FD) doses. In addition, four traps (with entire internal surface sticky, Suttera) for each dose were tested. The baited and control traps were placed at least 27 m apart in the same plantation (14–27 July 2014). The resulting catches were used to calculate EAR that were converted to EARc using the standard deviation (SD) of the vertical flight distribution (equations and methods Byers, Reference Byers2011, Reference Byers2012a ). In order to estimate the SD and mean flight height of the moths from trap catches, six transparent 1.5 litres plastic bottles without baits were covered with adhesive and hung on an iron pole every 1 m up to 6 m above ground in a date plantation (20–26 May 2014).
An encounter rate equation (Byers & Naranjo, Reference Byers and Naranjo2014) was modified by replacing speed × time with distance travelled to give the expected initial population of males (M) from subsequent trap catch:
 $$M = Catch/(1 - \exp ( - 2 \cdot EARc \cdot D \cdot K/A))$$
where Catch = total catch on traps, EARc in metres (m) as found for LDM monitor traps (in ‘Results’ section), D = average distance flown by a male (7200 m or 0.5 m s−1 for total of 4 h), a conservative estimate based on another small moth's flight capacity discussed in Byers & Naranjo (Reference Byers and Naranjo2014), K = number of pheromone monitoring traps, and A = area in m2. Equation (1) was used to predict initial male LDM population numbers based on catches of 1, 10, 100 or 1000 males in a 300 × 300 m2 plantation area with one monitoring trap. To detect invasive species at an initial population of M in an area A with the same parameters above, equation (1) can be solved for number of traps K needed to detect LDM (Catch of at least one male):
 $$K = \ln ((M - Catch)/M) \cdot A/( - 2 \cdot EARc \cdot D).$$
Equation (2) was used with initial populations of 2, 10 or 100 males in an area of A = 100 km2 to calculate the number of traps needed for likely detection. If a specific number of traps are placed in a 100 km2 area to detect invasive LDM, for example 5 or 50 traps, then the total Catch can be estimated using the same value for A and initial populations of M = 10, 100 or 1000 in equation (3):
 $$Catch = M \cdot (1 - \exp ( - 2 \cdot EARc \cdot D \cdot K/A)).$$
Statistics
Trap catches of male moths in experiments were square root transformed and analysed by ANOVA with significant differences between pairs of treatments indicated by Tukey's HSD at α = 0.05 (JMP 4.0.4, SAS Institute Inc., USA). Non-linear regression (Table Curve 2D version 5.01, Systat Software Inc., Chicago, IL) was used to find the best-fitting curve of dose–response (Byers, Reference Byers2013).
Results
Optimization of LDM pheromone bait for monitoring
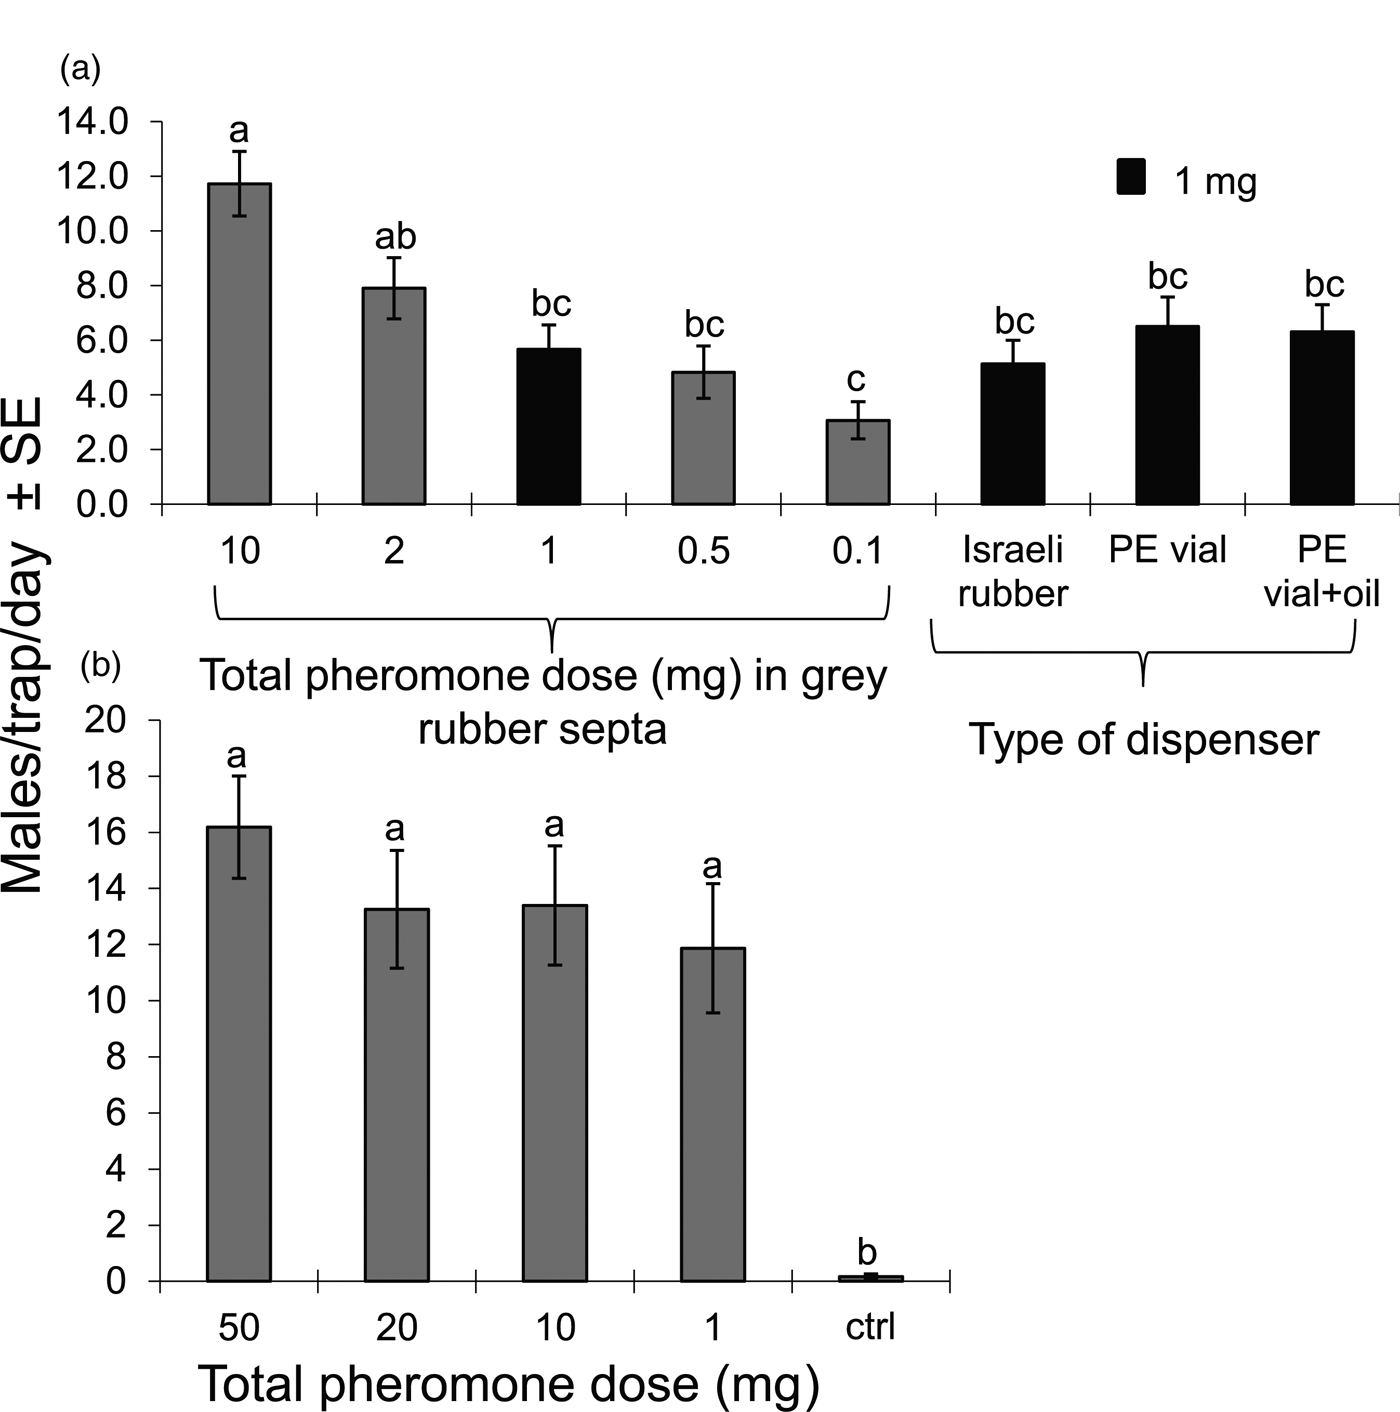
Pheromone dosages from 0.1 to 50 mg were tested in two trials (fig. 1). Increasing the dosages from 1 to 10 mg (fig. 1a) caused a twofold increase in catch while increasing dosage from 1 to 10, 20 and 50 mg (fig. 1b) did not significantly improve the catches during the test periods. After 35 days, no differences were observed among catches of the higher dosages compared with 1 mg. The best-fitting dose–response curve of five increasing doses was a first-order kinetic formation function (Byers, Reference Byers2013): Y = 2.861 + 8.987(1 – Exp(−0.409X)), where Y is the mean catch and X is the dose in mg (adjusted R 2 = 0.99). The function predicts that catch increases are insignificant above 5 mg and that 1 mg was almost as attractive as the two highest doses. Several different slow-release devices loaded with 1 mg pheromone displayed statistically similar attractiveness as grey rubber septa (fig. 1a). Therefore, the common grey rubber septa, baited with 1 mg pheromone were chosen as MT lures for further work.
Average catches of LDM males (per trap per day) on different pheromone doses in a Deglet nour date plantation. (a) Using different slow-release devices (baited with 1 mg pheromone) for 35 days in spring 2013 (n = 5). (b) Using grey rubber septa for 18 days in spring 2013 (n = 5).

Pheromone bait longevity in the field
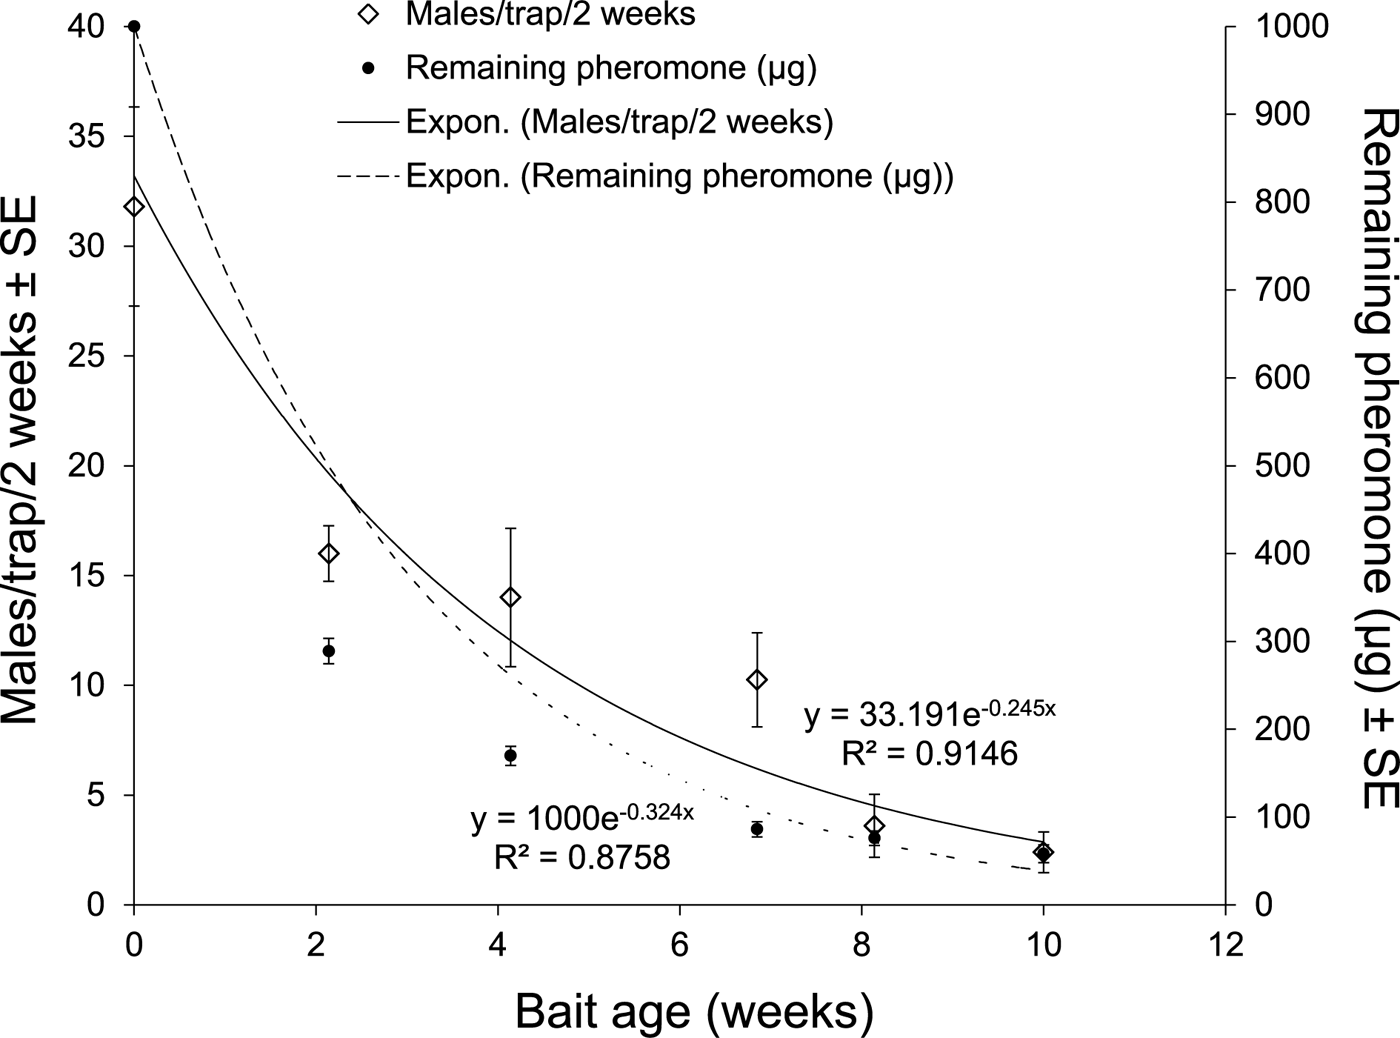
Baits of 1 mg pheromone in grey rubber septa were aged under field conditions for various periods from 2 to 10 weeks (May–August 2014). They were evaluated for their attractiveness and chemically analysed for pheromone residue (n = 4 each age). The field aging was performed in Southern Arava at temperatures of maximum >40°C and lowest humidity <15%. The pheromone content of the dispensers (proportional to release rate) declined exponentially (fig. 2) and after 6 weeks of aging about 85% of the pheromone had evaporated. Catch of LDM males also decreased exponentially with time so that after 6 weeks catches were reduced to about 25% of the catch of fresh baits (fig. 2).
Release rate of pheromone from grey rubber septa and male catch for 2 weeks (11–26 August 2014) in a date plantation in Southern Arava.

Tests of trap design and colour
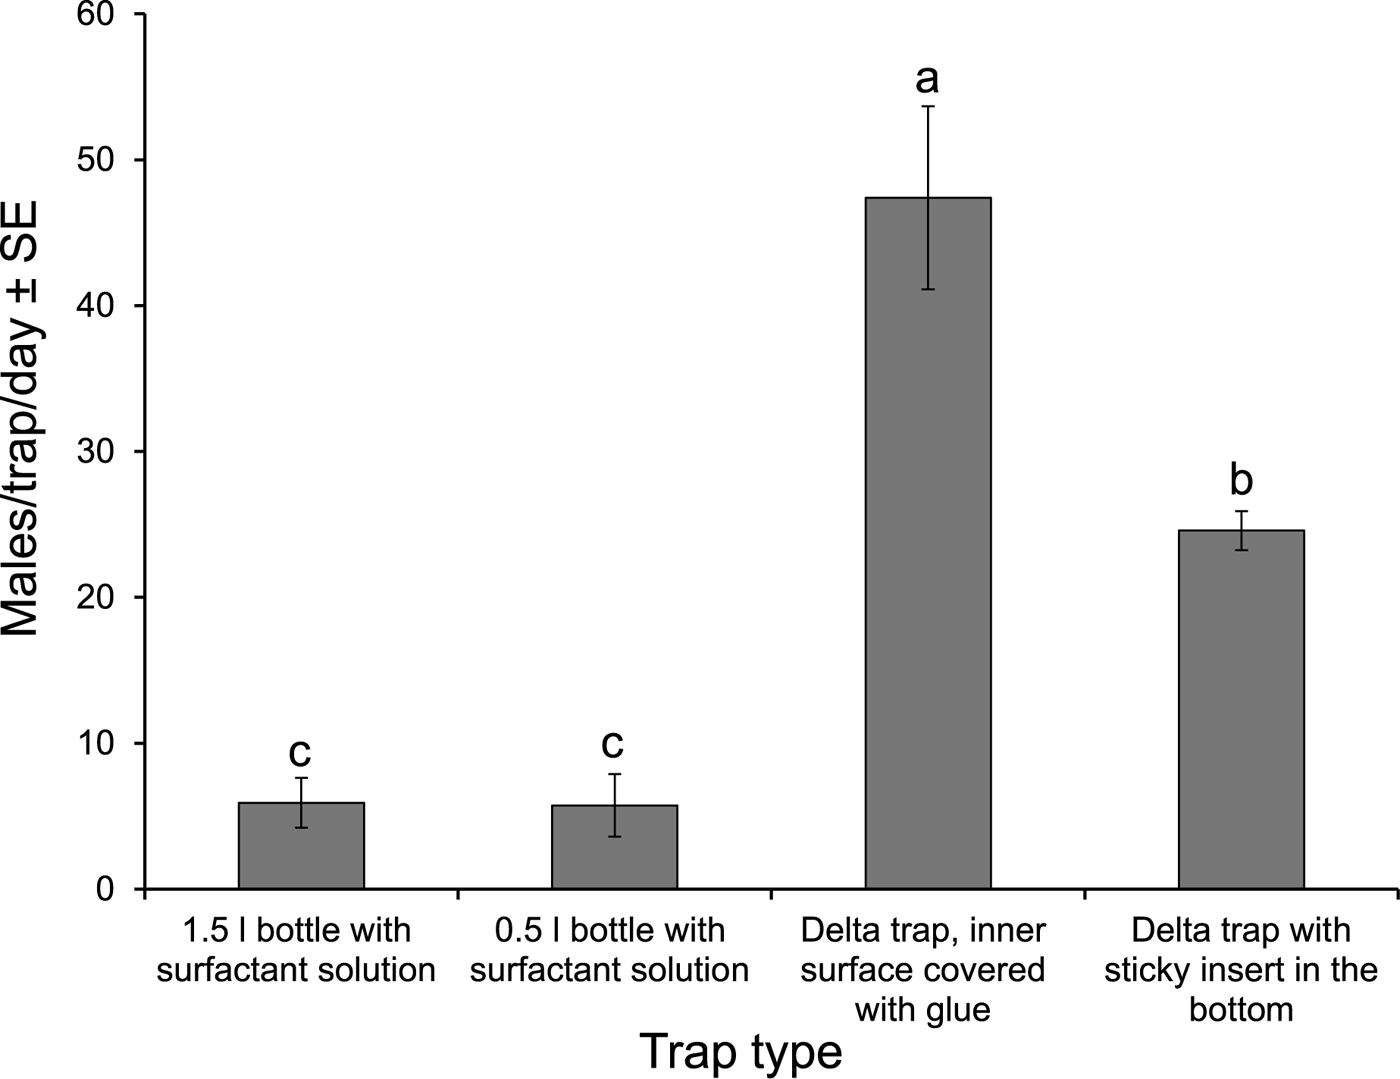
In the first trial, delta traps with their inner surfaces completely covered in adhesive caught the highest number of moths among the four trap types (fig. 3). Transparent plastic bottles with surfactant solution caught less males than the other two types of delta traps. In another trial, red and white delta traps were compared and their catches were similar (34 ± 15 and 40 ± 10 males/trap/day, respectively). Seven different colours of delta sticky trap were tested in Deglet nour plantations for 3 weeks during summer of 2013. The results indicate that trap colour does not affect the male's preference for the pheromone. Since white traps are commercially available in Israel, they were used in subsequent experiments.
Average catches of LDM males (per trap per day) on 1 mg lures in different trap types in a date plantation in Southern Arava.

LDM diurnal and seasonal activity and larval monitoring
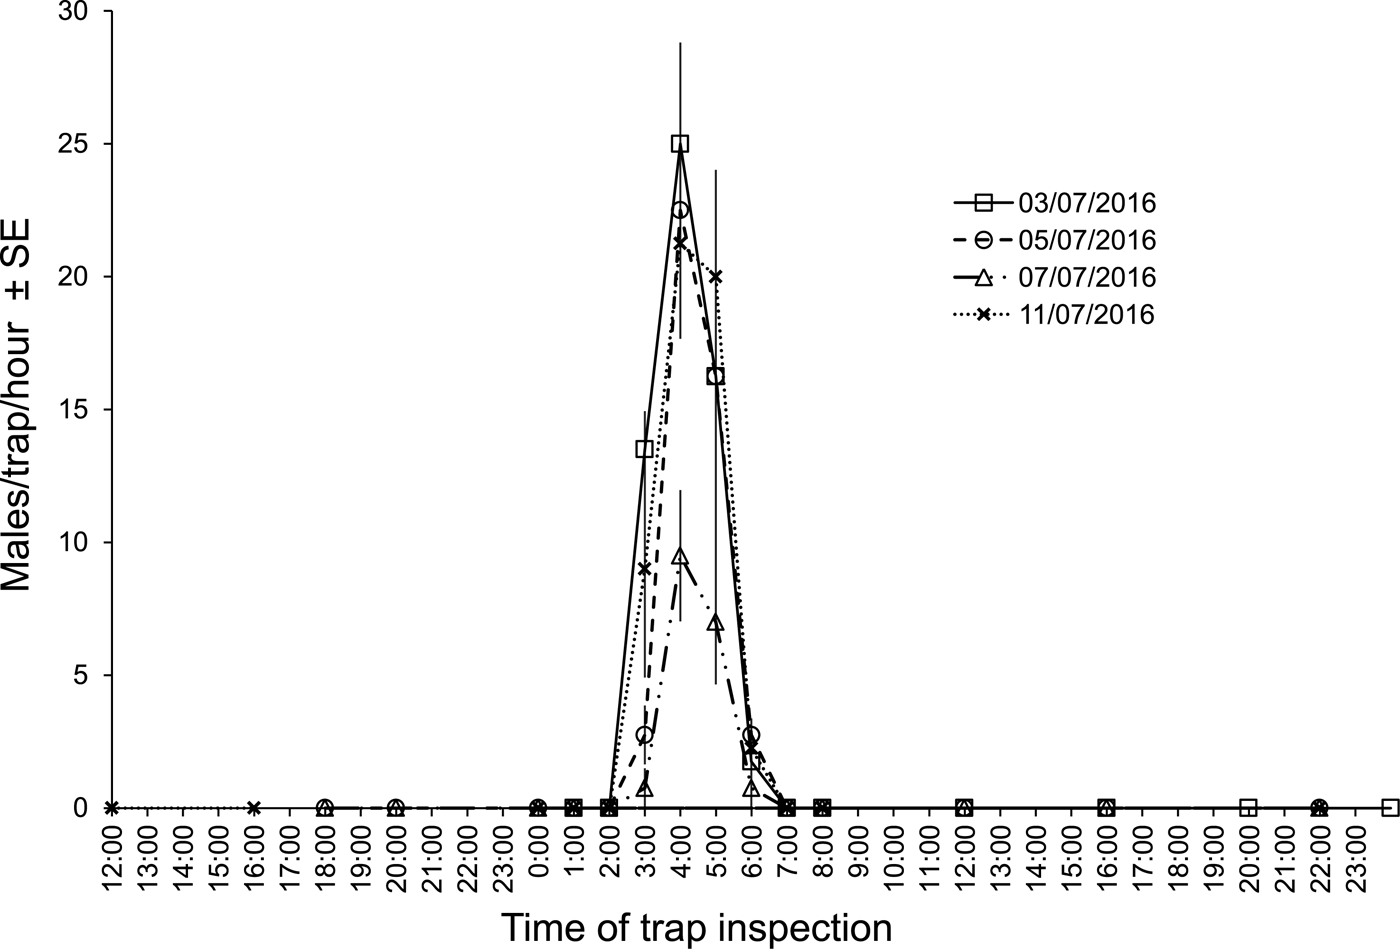
Traps collected every hour indicate that males begin flight towards pheromone traps shortly after 02:00 AM and end by 06:00 AM. Most of the flight occurs between 03:00 and 05:00 AM (fig. 4). An earlier experiment (1 September 2014) in which traps were inspected every 2 h (data not shown), similarly indicated male flight starting between 01:00 and 03:00 AM, and ending between 05:00 and 07:00 AM, with a peak between 03:00 and 05:00 AM.
Average catches of LDM males (per hour on delta sticky trap) on 1 mg bait in a date plantation in Southern Arava in early July 2016 (n = 4) during 4 days.

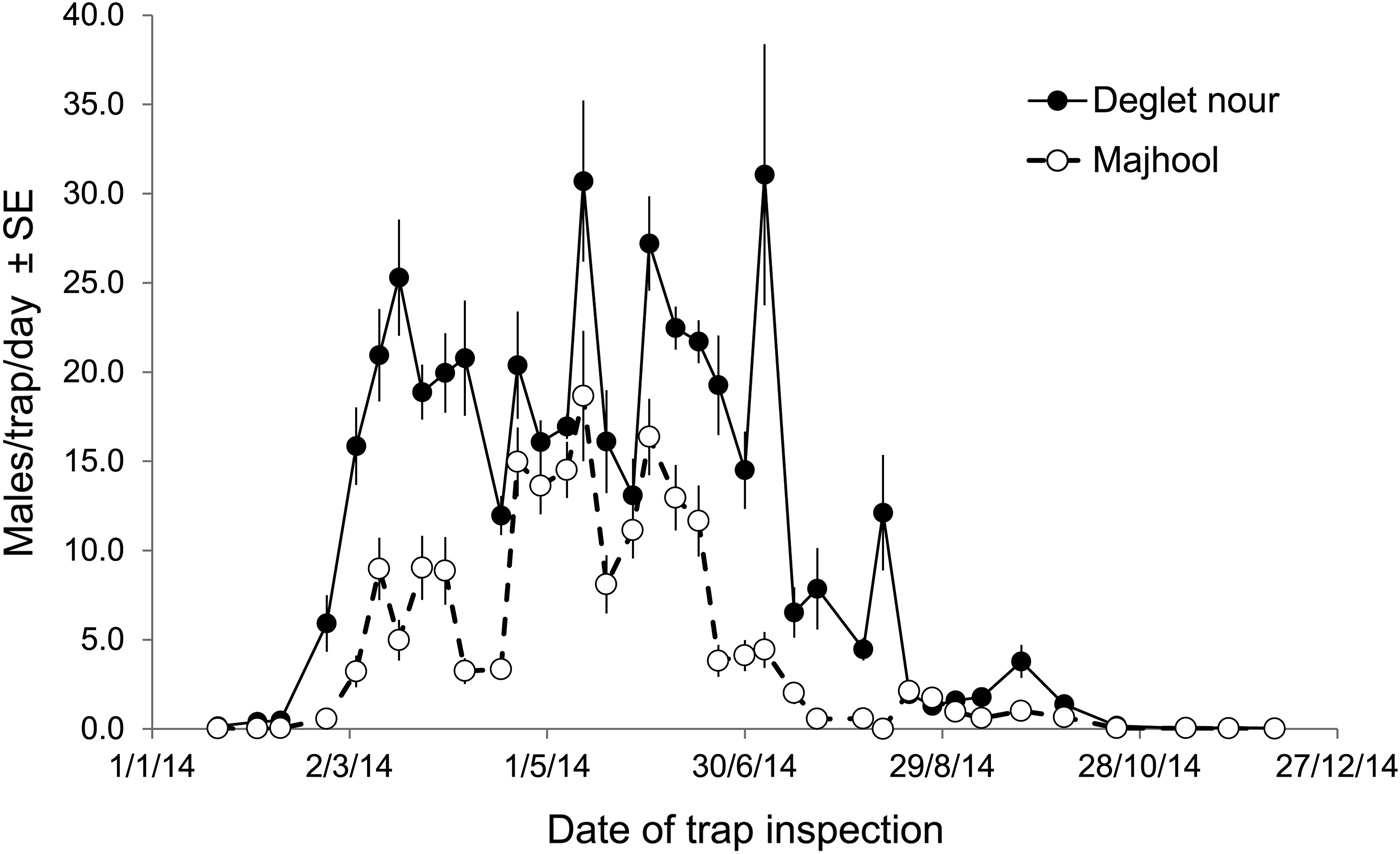
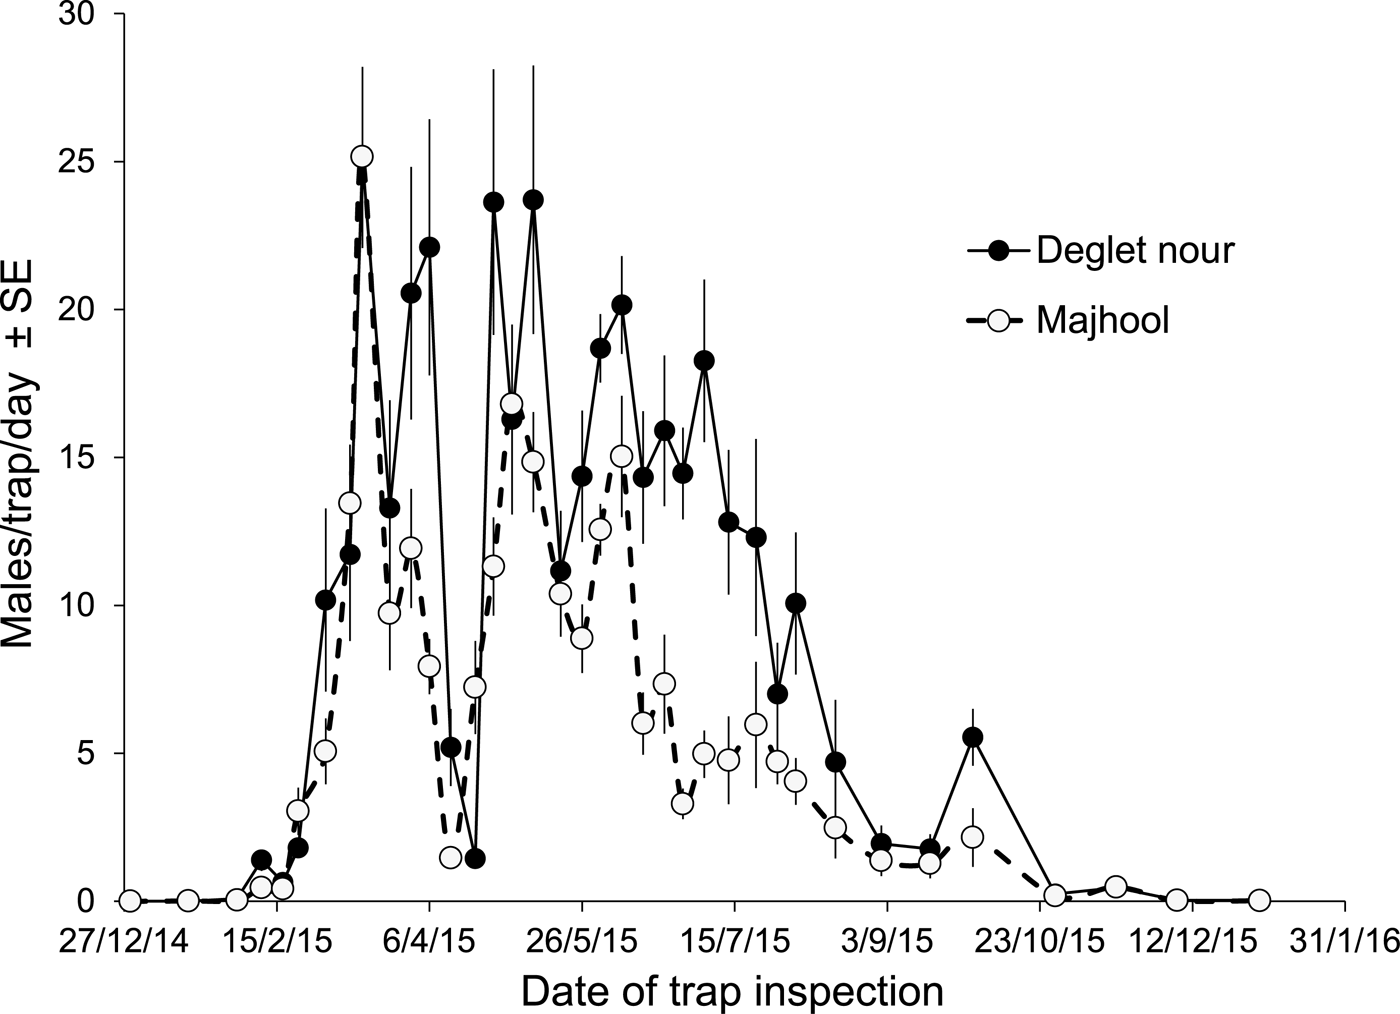
Seasonal flight activity of males was monitored in date plantations of Majhool and Deglet nour varieties in Southern Arava valley over 3 years 2013–2015. In 2013 the flight started at the beginning of March and ended at the end of September with three overlapping major activity peaks in (1) mid-March to mid-April, (2) May and (3) end of June to mid-July (data not shown). In 2014 the flight also started at the beginning of March and ended in mid-September with three overlapping major peaks (1) March to mid-April, (2) May and (3) June to mid-July (fig. 5). In 2015, however, the flight started again at the beginning of March but ended in mid-November with three major overlapping peaks in (1) March, (2) mid-April to the end of May and (3) June to end of July (fig. 6). In addition to the three major generations in each of the years 2013–2015, two smaller generations were observed in August and September. The flight activities in the Deglet nour date variety plantations were nearly always higher than in Majhool plantations (figs 5 and 6).
Average seasonal male capture on 1 mg baited pheromone traps (per trap per day ± SE) in four Majhool and four Deglet nour date plantations in Southern Arava during 2014.

Average seasonal male capture by pheromone traps (per trap per day ± SE) in six Majhool and four Deglet nour date plantations in Southern Arava during 2015.

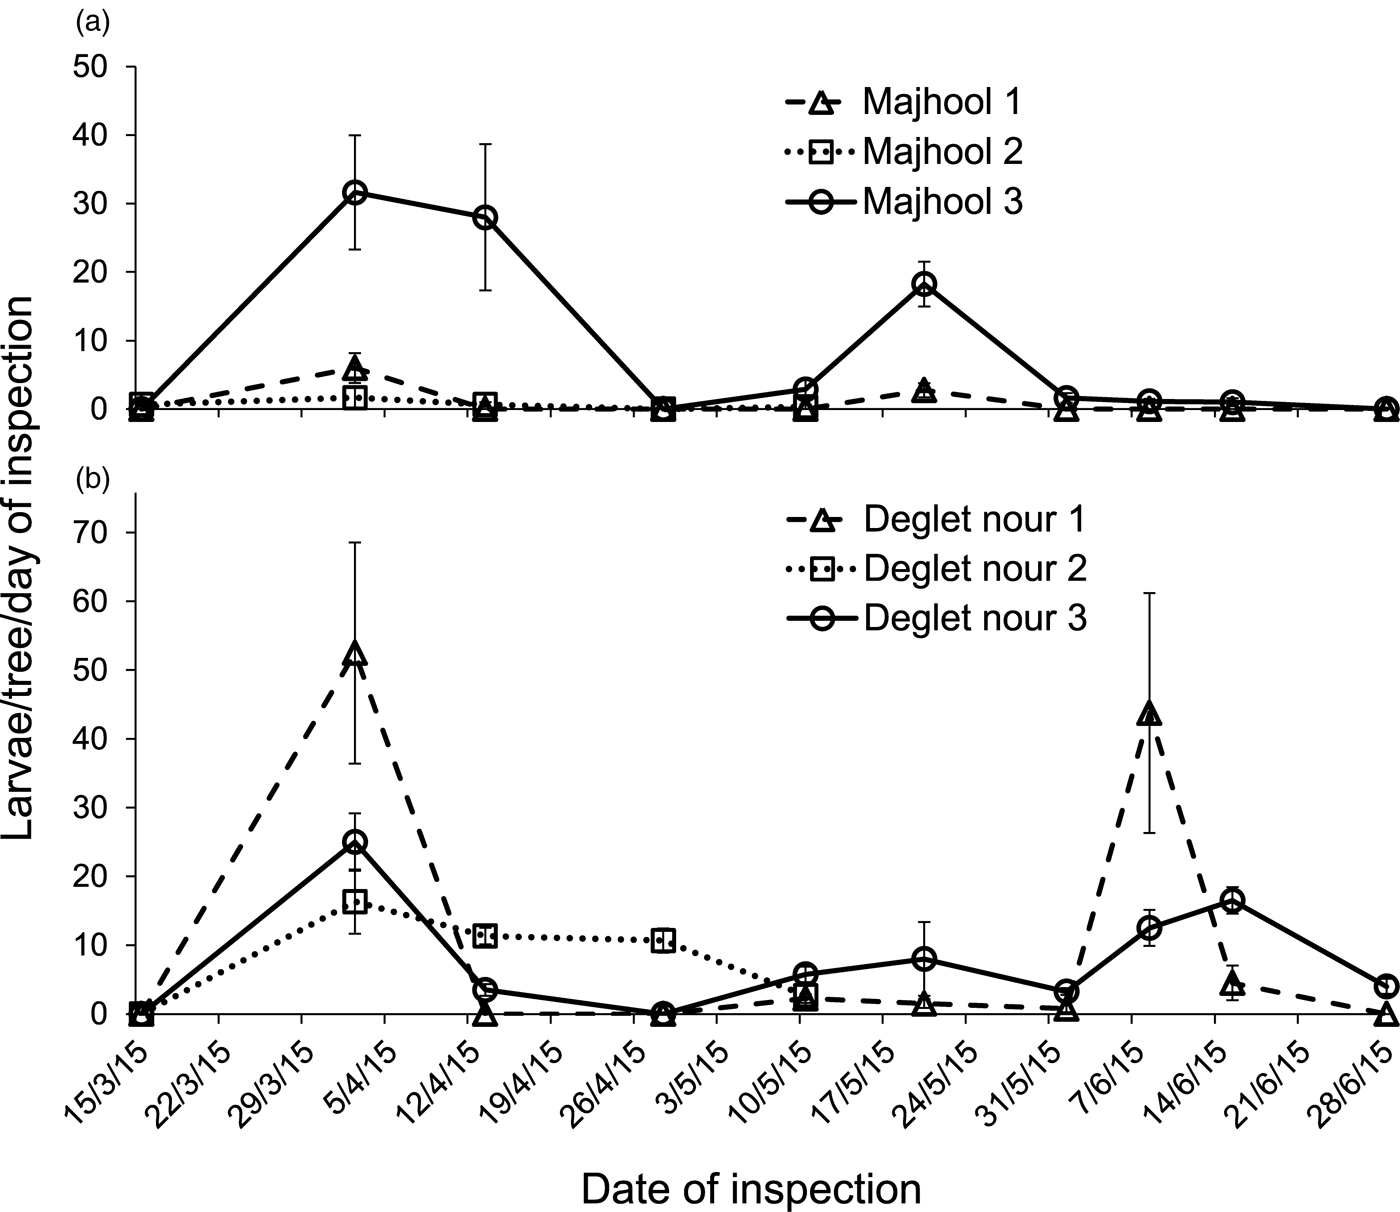
Sampling for larvae was conducted in several plantations in 2013 and 2014 beginning in April according to previously established protocols, i.e. when 60% of the flowers had opened. Since larvae were found in April 2014, sampling in 2015 was started earlier, in mid-March, but no larvae were found. Two weeks later, on 2 April, the first peak of larval infestation was observed (fig. 7), followed by two additional peaks in mid-May and in early to mid-June. Usually in April there is a reduction in larval numbers due to insecticide sprays and finding the larva after this depends on whether the treatment was effective. It is not possible to inspect for LDM larvae after the end of June, at the beginning of the ripening season, because the date bunches are usually tied to the leaf and covered with net to prevent sap beetle damage (Blumberg, Reference Blumberg and Bernstein2004, Reference Blumberg2008).
Seasonal larvae sampled (per tree per day of inspection, n = 4) in (a) three Majhool and (b) three Deglet nour date plantations in Southern Arava from mid-March to July 2015.

Design of ‘FD’ bait
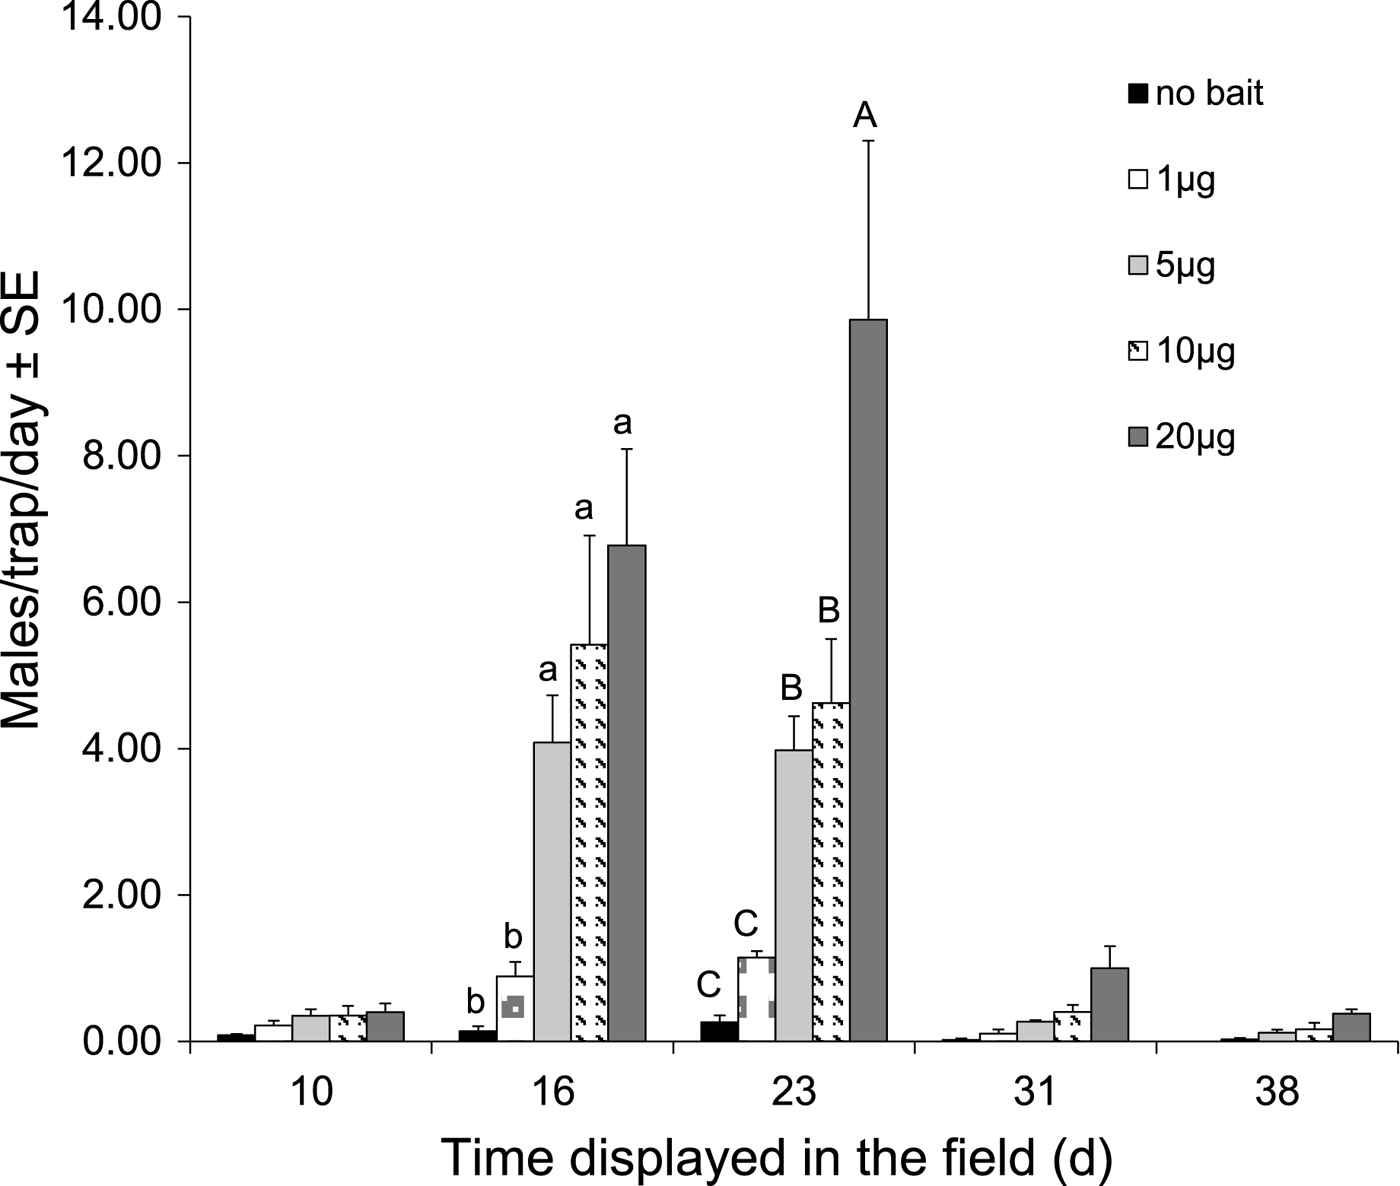
We attempted to develop a FD lure that would imitate a ‘calling’ female by performing a dose–response experiment of the pheromone compared with an unbaited trap as control. The estimated release of the major pheromone component Z5–10:Ac of a single LDM female (n = 6) is about 1 ng/night (Levi-Zada et al., Reference Levi-Zada, Sadowsky, Dobrinin, David, Ticuchinski, Fefer, Greenberg and Blumberg2013). This small amount placed on a rubber septum would not be adequate as bait in the extreme field conditions of Southern Arava. Considering the performance of the rubber lures, which release about 60% of the pheromone in the first 2 weeks (fig. 2), four pheromone dosages of 1, 5, 10 and 20 µg were evaluated that may mimic a ‘calling’ female. Generally, the attractiveness of all these low dosages was higher than those of the control traps, however, after 1.5–3 weeks the dosages of 5, 10 and 20 µg attracted significantly more males than the 1 µg dosage, which was always close to that of the control trap (fig. 8). After 4 weeks the catches declined due to decreased release of pheromone, despite the fact that LDM males were still caught in large numbers in MT traps in nearby plantations (data not shown). Baits of 20 µg attracted the most males after 3 weeks, although nearly as much attractiveness was shown for baits of 5 and 10 µg (fig. 8). Therefore, it was decided to use the 10 µg dosage as the FD bait to imitate a ‘calling female’. This dosage is 100 times less than that of the MT lure used for monitoring and mass trapping.
Average catches of LDM males (per trap per day ± SE) on low dosages (1, 5, 10 and 20 µg) pheromone lures in delta sticky traps in a date plantation in Southern Arava over 38 days (6 April–14 May 2014).

Monitoring trap distance of influence estimated with FD traps
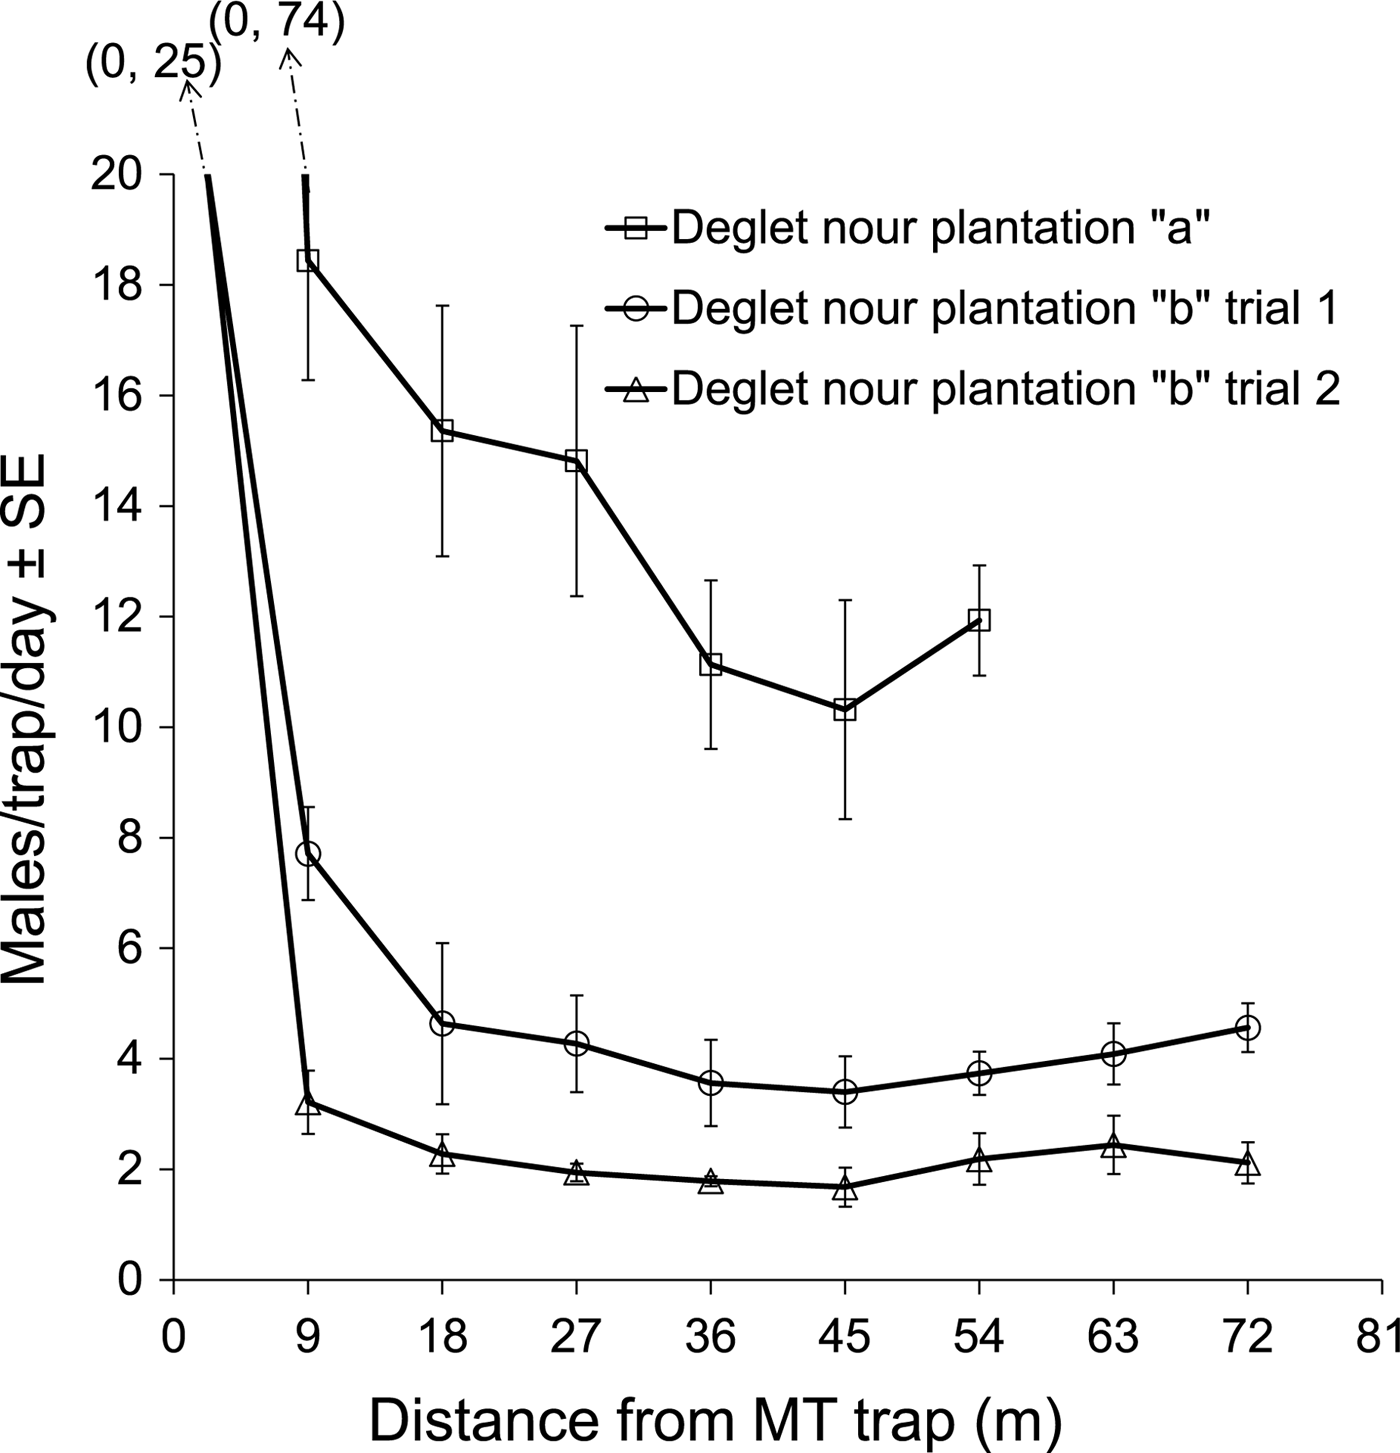
The goal of this test was to determine the minimum appropriate spacing of the MT traps for monitoring in order to optimize efficiency (cost per area). In a plot with a high population of LDM in a Deglet nour plantation ‘a’ (fig. 9), the catches of FD traps, placed at different distances around a central MT trap, reached a minimum at a distance of 36 m from the MT trap. In a second plot of lower moth population, a Deglet nour plantation ‘b’, trials 1 and 2, a minimum for the curve was found approximately at 18 m distance from the MT trap. In plantation ‘a’ (fig. 9) the catches of FD traps 9 m from the MT trap were 24% that of the nearby MT trap, while in ‘plantation b trial 1 or 2’ the FD traps at 9 m distance caught 30 and 12% respectively as compared with the central MT trap. When FD traps stand further than 9 m away from MT traps (fig. 9 and data not shown), or stand alone, they attract even less males.
LDM male catches (per trap per day ± SE) on FD pheromone traps in a radial arrangement away from an MT trap (at x = 0, as described in Methods) in two Deglet nour date plantations in Southern Arava. Catches in plantation ‘a’ were from 27 April to 31 May 2015, and in plantation ‘b’ from 11 to 31 May 2015 from 31 May to 5 July 2015; FD = 10 µg pheromone dosage, MT = 1 mg dosage.

EAR of baited trap and LDM vertical flight distribution
LDM moths were intercepted passively by unbaited sticky bottles (20–26 May 2014) at six heights: catching four at 1 m, four at 2 m, eight at 3 m, five at 4 m, two at 5 m and three at 6 m yielding a mean flight height of 3.23 m and SD of 1.53 m (95% CI of 1.20–2.11 m, n = 26), similar to the height of the date bunches in this plantation of young trees. The EAR was calculated from the average catch of 0.143 (n = 14) of the unbaited sticky bottles after 1 week while the mean catch (n = 4) of the high-dose MT delta trap was 137.25 and of the low-dose FD delta trap was 10.5. During the same period we caught a mean of 230.25 males in the MT Suttera trap and nine males in the FD Suttera trap. In addition to these catches, calculation of EAR requires that the silhouette area of the passive-catch plastic bottle be determined. This was done by image analysis software (Byers, unpublished) giving the silhouette area as 0.0274 m2. Thus, the EAR is estimated at 2.89 m for the MT delta trap (1 mg, sticky floor), 0.80 m for the FD delta trap (10 µg), 3.75 m for the MT Suttera trap (1 mg, entire inner surface covered with glue), and 0.74 m for the FD Suttera trap (10 µg). The SD and the EAR values were then used to calculate EARc needed in the encounter rate equations. The EARc was 3.43 m for the MT delta trap, 0.26 m for the FD delta trap, 5.76 m for the MT Suttera trap and 0.23 for the FD Suttera trap.
Using equation (1) with an EARc = 3.43 m for the MT delta trap, such a trap that caught either 1, 10, 100 or 1000 would predict an initial population of about 2, 24, 237 or 2368 males in the 9 ha area, respectively, which means that about 42% of the male population would be caught by the monitor trap in this area regardless of initial density. Equation (2) can indicate how many traps are needed to detect LDM in a large 100 km2 area in which there are 2, 10 or 100 invasive LDM. This equation predicts that 1403 traps are needed to detect LDM if two enter this area, while if 10 males entered the area, then 213 traps are needed to detect a male, but only 20 traps for 100 initial males (one trap per 5 km2). Equation (3) predicts that 10 traps in a 100 km2 area with populations of 10, 100 or 1000 would catch a total of 0.05, 0.5 or 4.9 while using 100 traps would catch a total of 0.5, 4.8 or 48, respectively (about 10 times higher as there are 10 times more traps). However, if the number of traps is increased to 1000 then total catch is predicted to be about 3.9, 39 or 390, respectively, for the three population levels. This is about 8.1 times higher catch even though using 10 times higher number of traps because of greater competition among the 1000 traps in the area.
Discussion
Pest monitoring with an optimized pheromone-trap system would improve the sensitivity of detecting low-density invasive pests and indigenous infestations. Moreover, mass trapping requires the use of a highly efficient pheromone trap in order to remove most of the males before they encounter females and mate. Following the identification of the complete blend of LDM sex pheromone components (Levi-Zada et al., Reference Levi-Zada, Sadowsky, Dobrinin, David, Ticuchinski, Fefer, Greenberg and Blumberg2013), we began examining pheromone dosage and trap parameters for optimal monitoring and mass trapping. Our results indicate that the most efficient and economic pheromone dosage is 1 mg. Increases in pheromone dosage above 1 mg did not improve the trap catch sufficiently to justify a higher cost. The grey rubber dispensers loaded with 1 mg pheromone can be used for about 4 weeks in the harsh summer conditions of the Arava desert, although the catches of aged lures decreased to ~20% after 4 weeks as compared with fresh baits (fig. 2). Our previous work compared funnel IPS traps with two sizes of delta traps for monitoring and we concluded that a small delta trap was adequate because of its low cost and convenient application (Levi-Zada et al., Reference Levi-Zada, Sadowsky, Dobrinin, David, Ticuchinski, Fefer, Greenberg and Blumberg2013). Various delta traps were evaluated in order to improve trapping efficiency. Delta traps with their entire internal surface covered with adhesive gave the best performance: with a 100% higher catch than the same traps with adhesive only on the floor (fig. 3). The colour of the trap did not affect the catch.
Knowledge of flight rhythm periodicity is required for time-regulated application of pheromone (e.g., large-scale atomizing puffers) in mating disruption in order to save expensive pheromone or to allow longer periods of treatment between recharges. Flight period parameters also can give insights about detection, monitoring and mass-trapping trials when used in software simulations (Byers, Reference Byers2012b ). Our results indicate that LDM fly near the date bunches and male flight peaks between 03:00 and 05:00 AM in early July 2016 (fig. 4), starting 3 h before sunrise (darkness at 19:44 PM and sunrise at 05:45 AM) meaning the male's flight began after 6 h of scotophase and ended at sunrise. In September 2014, darkness started at 19:02 PM and the sun rose at 06:18 AM so males start to fly 6 h into the scotophase (data not shown).
The phenology of LDM was studied in the past. Three generations were recorded in Israel: the first generation appeared at the end of March to end of April, the second from mid to end of May, and the third generation from beginning of June to its end (Blumberg, Reference Blumberg1975, Reference Blumberg2008; Blumberg et al., Reference Blumberg, Swirski and Greenberg1977). In Pakistan the adult stage was reported to last until the end of August (Kakar et al., Reference Kakar, Nizamani, Rustamani and Khuhro2010). Our monitoring of LDM by pheromone traps in the Southern Arava area confirmed the presence of three major overlapping generations from mid-February until August (figs 5, 6 and 7). However, low flight activity could continue from August to mid/end of October and sometimes even until mid-November, followed by diapause for about 3 months until the next season. Larval infestations in 2015 occurred in mid-March while the flight started earlier in mid-February (figs 6 and 7). As the season progresses, infestation levels can decrease because of pesticide treatments that are directed at the larvae. In mid-May and mid-June, two more peaks of larval infestation were observed, probably because of inadequate insecticide treatments and/or partial resistance, as well as migration of moths from other areas.
Mass trapping of LDM with pheromone may be more cost-effective than mating disruption because the former requires smaller amounts of pheromone (Witzgall et al., Reference Witzgall, Kirsch and Cork2010). In addition, simulations indicate that mass trapping should be more effective than mating disruption since males removed by traps cannot mate again (Byers, Reference Byers2007). In the literature, there are more studies of mating disruption than of mass trapping for moths, although sometimes the methods are combined (Yamanaka, Reference Yamanaka2007; Suckling et al., Reference Suckling, Stringer, Stephens, Woods, Williams, Baker and El-Sayed2014). We believe that mass trapping may be appropriate for control of LDM for several reasons: (1) The LDM pheromone is very potent – catching hundreds of males per trap in a few nights (Levi-Zada et al., Reference Levi-Zada, Sadowsky, Dobrinin, David, Ticuchinski, Fefer, Greenberg and Blumberg2013) with a relatively large EARc. (2) The date palm is the only host of LDM (Blumberg, Reference Blumberg2008; El-Shafie, Reference El-Shafie2012). (3) Mass trapping has proven effective on isolated populations (Schlyter et al., Reference Schlyter, Zhang, Liu and Lan-Zhu2001) and date plantations are usually isolated from other plots in the desert causing lower survival of migrating females and males. (4) LDM emerges in the spring, therefore, mass trapping can be applied early in the season when populations are low and mass trapping is more effective (El-Sayed et al., Reference El-Sayed, Suckling, Wearing and Byers2006, Reference El-Sayed, Suckling, Byers, Jang and Wearing2009; Byers, Reference Byers2007). LDM mass-trapping experiments in the Middle East were reported by Kinawy et al. (Reference Kinawy, Arissian and Guillon2015) using an incomplete blend of LDM pheromone components (Levi-Zada et al., Reference Levi-Zada, Fefer, Anshelevitch, Litovsky, Bengtsson, Gindin and Soroker2011). Later, the complete ternary pheromone blend, showing very high attractiveness, was identified (Levi-Zada et al., Reference Levi-Zada, Sadowsky, Dobrinin, David, Ticuchinski, Fefer, Greenberg and Blumberg2013) and this was used in our present studies.
Usually the initial distance between traps in monitoring and mass trapping is chosen arbitrarily. In mass trapping, both trap catch and damage are evaluated to determine which trap density is adequate as balanced by costs of deployment. This trial-and-error approach requires massive amounts of labour. The highest density of MT traps that does not cause mutual interference (when total trap catch begins to decline and possible mating disruption starts) is the most effective for mass trapping (Suckling et al., Reference Suckling, Stringer, Kean, Lo, Bell, Walker, Twidle, Jiménez-Pérezg and El-Sayed2015). In order to assess the effect of such a density of MT traps, we introduced the use of FD-baited traps. These traps were baited with a very low amount of pheromone (FD), imitating a LDM ‘calling’ female as a tool to evaluate effects of spacing of the MT traps on competing females when monitoring as well as to assess the efficacy of mass trapping in future work. Since the amount of pheromone that a female releases is very low, about 1 ng/night (Levi-Zada et al., Reference Levi-Zada, Sadowsky, Dobrinin, David, Ticuchinski, Fefer, Greenberg and Blumberg2013), the catches of the FD bait should be somewhat greater than a control trap but much less than an MT trap baited with 1000 µg. For practical application, the release from the FD bait should be attractive for a few weeks in the field. Thus, the most appropriate pheromone dosage on a rubber lure that fulfils these conditions is 10 µg (fig. 8). Delta traps baited with 10 µg pheromone usually caught 1–5 males/day when exposed away from other traps (fig. 8), while control traps only caught 0–0.1 males/day when hung at 2 m height (fig. 8; Levi-Zada et al., Reference Levi-Zada, Sadowsky, Dobrinin, David, Ticuchinski, Fefer, Greenberg and Blumberg2013).
As mentioned above, inter-trap distance causing significant bait interference should be avoided. FD traps were placed at increasing distances from an MT trap in order to study the radial distance of influence of this trap. The results indicated that the FD traps caught fewer LDM males with increasing distance from the central MT trap (fig. 9). It appears that FD traps that are only 9 m away from the MT trap catch more males as compared with FD traps that are farther out, probably due to a higher concentration of males in the vicinity of the potent MT trap. The similar catches in FD traps at distances from 18 to 72 m from the MT trap at lower LDM densities indicate that males flew about uniformly at random inside the date plantation when not near a MT trap (fig. 9). The higher catches on FD traps near the MT trap indicate that females in this vicinity would be more likely to mate, while males here would have higher trap mortality. We conclude that an intermediate spacing of 27 m between two MT traps in a grid appears to be an appropriate initial distance for tests of mass trapping.
Our field trial results are supported by mathematical simulation models. EARc is a circular radius catching 100% of intercepting insects in 2D-simulation models that is of sufficient size to catch the same number as was caught on a baited trap in the field (Byers, Reference Byers2011, Reference Byers2012a , Reference Byers b ). In independent tests, we found that the EARc of the FD trap (0.26 m) was 7.6% that of the EARc of the MT trap (3.43 m). The 3.43 m EARc of the MT trap indicates this trap–bait combination is potent. For example, the best bait for pink bollworm, Pectinophora gossypiella, a major pest of cotton had an EARc = 2.61 m (Byers & Naranjo, Reference Byers and Naranjo2014). The EARc of LDM is the most attractive of any insect calculated to date (Byers, Reference Byers2012a ).
The trap density can be varied in simulations based on knowledge of the EARc of traps with MT or FD baits in order to estimate the percentage of females expected to mate as shown in our results. However, many biological factors, such as the mean distance that males search, are crucial to these predictions (Byers & Naranjo, Reference Byers and Naranjo2014). Simulation models are perhaps most valuable to gain insights on mass trapping and to determine if the number of traps in the treated area would have any chance of control. The initial trap densities needed for control predicted from simulations and from pilot experiments can be adjusted in subsequent trials to further improve the efficacy of a mass-trapping programme. Generally, we suggest performing a preliminary test for a few weeks with the MT and FD baited traps to obtain the most appropriate spacing of the MT traps before employing any practical mass trapping.
Our results suggest monitoring traps warn of infestation much earlier than the previous method of inspecting for larvae. The pheromone trap monitoring method is convenient and inexpensive as no lifting equipment is required. Monitoring can show when males begin to fly and provides relative population estimates. MT pheromone traps of significant EARc can reduce the number of males that are flying in the plot as shown with the encounter rate equations and with simulations (unpublished). Our method of using MT and FD lures is helpful to estimate the minimum efficient distance between MT traps that are displayed for monitoring and mass trapping. This method would be useful in mass trapping and successful control of B. amydraula and some other pests. Experiments are underway to deploy mass trapping of LDM throughout the Southern Arava of Israel.
Acknowledgements
This work was supported by the Chief Scientist Ministry of Agriculture grant # 1719–131. The authors thank the date growers in Southern Arava for helping them in monitoring the pest in their orchards. They thank ‘Makhteshim – Adama’ company for donating traps for their tests.