


I. Introduction
Since Coase (Reference Coase1937) first raised the questions of why firms exist and what determines the boundaries of a firm, these questions remain central in the economics of organizations. Coase’s fundamental insight that firm boundaries can be explained by efficiency considerations in minimizing transaction costs has triggered extensive research, particularly on what has come to be known as the “hold-up problem,” that is, forcing the transacting party to accept worse effective terms of the relationship by demanding renegotiation after relationship-specific investments have been made or new considerations have arisen (see, e.g., Holmstrom and Roberts (Reference Holmstrom and Roberts1998) for a review).
The potential for hold-ups increases transaction costs by inducing parties to invest in unproductive improvements in postcontractual bargaining positions while simultaneously underinvesting in relationship-specific assets (Klein, Crawford, and Alchian (Reference Klein, Crawford and Alchian1978), Williamson (Reference Williamson1979), (Reference Williamson1985), Grossman and Hart (Reference Grossman and Hart1986), and Hart and Moore (Reference Hart and Moore1990)). A natural solution to this problem is vertical integration, expanding operations along the supply chain. While vertical integration minimizes the risk of appropriation of quasi-rents in specialized assets by opportunistic trading partners, it suffers from inefficiencies arising from nonmarket-based allocation and opportunistic behavior within firms.Footnote 1 These tradeoffs help explain why supply chains in practice routinely use third parties for many strategic activities such as manufacturing and R&D that often include relationship-specific investment (Holmstrom and Roberts (Reference Holmstrom and Roberts1998), Henke and Zhang (Reference Henke and Zhang2010)). A large strand of research has explored other explicit or implicit long-term contractual solutions to hold-up problems (detailed in Section II.B).
In this article, we study a previously underexplored mechanism, the role of social capital, in mitigating hold-up problems along the supply chain. In particular, we examine whether and how social capital in customer firms’ headquarters counties affects suppliers’ relationship-specific investments.Footnote 2 In economics, social capital is predominately viewed as an environmental factor that captures the confluence of the strength of shared common beliefs and values that promote cooperation (hereafter “cooperative norms”) and the density of social networks that facilitate collective actions (Woolcock (Reference Woolcock2001), Guiso, Sapienza, and Zingales (Reference Guiso, Sapienza, Zingales, Benhabib, Bisin and Jackson2011), and Hasan, Hoi, Wu, and Zhang (Reference Hasan, Hoi, Wu and Zhang2017a), (Reference Hasan, Hoi, Wu and Zhang2017b)). Notably, Guiso et al. (Reference Guiso, Sapienza, Zingales, Benhabib, Bisin and Jackson2011) argue that social capital is the missing ingredient in explaining economic and social outcomes.
In high social capital communities, cooperative norms induce people to dislike actions that obtain private benefits at high social costs (Guiso et al. (Reference Guiso, Sapienza, Zingales, Benhabib, Bisin and Jackson2011)). Postcontractual opportunistic behavior, such as engaging in a hold-up, is contrary to the prescribed values associated with cooperative norms. These norms become innate such that managers located in high social capital communities would bear more personal cognitive costs from engaging in opportunism (Elster (Reference Elster1989), Erard and Feinstein (Reference Erard and Feinstein1994)). Dense social networks, by enhancing information sharing among community members and accelerating the dissemination of their impaired reputation due to opportunistic behavior, further intensify the external social sanction, such as social ostracism (Uhlaner (Reference Uhlaner1989)) and stigmatization (Posner (Reference Posner2000)), and heighten innate negative moral sentiment (Coleman (Reference Coleman1988), (Reference Coleman1994), Hasan et al. (Reference Hasan, Hoi, Wu and Zhang2017b)). Suppliers anticipating the constraining forces imposed by their major customers’ social environment are consequently less concerned with hold-up risks. This implies that suppliers are more willing to make relationship-specific investments when transacting with customer firms located in high social capital areas.
To test this prediction, we construct proxies for the customer firm’s social capital using the county-level social capital data from the Northeast Regional Center for Rural Development at the Pennsylvania State University. We measure the supplier firm’s relationship-specific investments based on the cross-citation patterns of its approved patent applications, specifically the occurrence and intensity of citations to the customer’s patents by the supplier in a given year (we also examine alternative measures such as patent tradability, technological proximity, and R&D comovement).
Using a sample containing 17,837 supplier–customer–year observations of U.S.-listed firms from 1990 to 2010, we find a positive and statistically significant association between the customer’s social capital and the supplier’s relationship-specific investments. Our results imply that a 1-standard-deviation increase in the customer’s social capital is associated with a 0.76 percentage point increase in the supplier’s likelihood of citing the customer’s patents (9.5% of the sample mean) and a 23.5% increase in the expected citations to the customer’s patents by the supplier.
Next, we conduct cross-sectional analyses to examine whether the impact of the customer’s social capital varies as predicted by theory. We start by examining situations where the risk of expropriation is greatest: when the supplier is in a relatively weaker bargaining position, when the supplier’s investment has lower salvage value outside the relationship (i.e., high asset specificity), and when the customer is facing financial difficulty. If social capital constrains expropriation, its effect should be most detectable in these settings. Consistent with predictions under a causal relationship, we find that the effect of the customer’s social capital on suppliers’ willingness to make relationship-specific investments is strongest when those investments would otherwise be at greatest risk of expropriation.
We then present more evidence supporting the assumption that customers’ social capital mitigates the hold-up risk faced by supplier firms, thereby fostering improved cooperation within mutual relationships. Specifically, we find that high social capital customers partially shield their suppliers from negative shocks and that their trading relationships tend to last longer.
Our analyses further show that when transacting with customers located in high social capital areas, suppliers produce more nontradable patents, exhibit a greater overlap in the technological scope of innovation activities with these customers, and make R&D investment more responsive to that of the customers. These results further corroborate our baseline findings that customers’ social capital is positively associated with suppliers’ relationship-specific investments. In addition, we find that high social capital firms are less likely to be vertically integrated and that the largest concentration of significant customer–supplier relationships forms between firms that both have high social capital, consistent with a reduced need for internalization when relational contracting is facilitated.
Finally, we perform a battery of robustness checks. Our main findings are robust to instrumental variable estimation and to alternative measures for social capital and suppliers’ relationship-specific investments. Furthermore, our results remain qualitatively unchanged after controlling for suppliers’ own social capital, customers’ social performance, social interactions between suppliers and customers, customers’ innovation characteristics, and local economic conditions of customers’ headquarters counties. Overall, as is typical in this literature, perfect identification is difficult to achieve; however, the combined evidence from cross-sectional tests, mechanism analyses, and extensive robustness checks tightly constrain plausible alternative explanations.
Our study contributes to the existing literature in the following ways. First, resolving hold-up problems to facilitate cooperation between trading partners has important implications for economic efficiency and development. A large body of research focuses on market mechanisms in mitigating hold-up problems through future rewards and punishments in repeated interactions (detailed in Section II.B). Nunn (Reference Nunn2007) shows that a country’s formal judicial enforcement system has comparative advantages in the production of goods requiring relationship-specific investments. We shed new light on the nature and solutions to hold-up problems by examining a previously underexplored informal mechanism—social capital, an environmental factor that values cooperative norms—in mitigating hold-up risk. In a contemporaneous study, Kang, Nemani, and Raman (Reference Kang, Nemani and Raman2024) find that supplier firms exhibit higher (overall, undirected) R&D intensity when their major customers are located in high social capital states. However, higher R&D intensity does not necessarily imply more relationship-specific investment as this measure captures overall R&D spending without distinguishing between relationship-specific and general R&D. More importantly, the firm-level R&D intensity does not reveal whether the investment is directed toward customers with high or low social capital. Our study, by examining cross-citations of patents and conducting analyses at the supplier–customer pair level, provides convincing evidence for the positive effect of social capital on relationship-specific investment.
Second, we add to the literature on the role of social capital in economic and financial development. Early studies examine its role in promoting trust and cooperation among economic agents from a macroeconomic perspective. For example, Knack and Keefer (Reference Knack and Keefer1997) find that social capital has a positive impact on economic growth. Guiso, Sapienza, and Zingales (Reference Guiso, Sapienza and Zingales2004) find that social capital positively affects financial market development, an important mechanism through which social capital contributes to economic prosperity. Recent studies in accounting and finance further demonstrate the role of social capital in constraining opportunistic corporate behavior (e.g., Hasan et al. (Reference Hasan, Hoi, Wu and Zhang2017a), Hoi, Wu, and Zhang (Reference Hoi, Wu and Zhang2018), (Reference Hoi, Wu and Zhang2019), and Jha (Reference Jha2019)). Our article extends this line of literature by demonstrating the positive role of social capital in mitigating hold-up risk in the supply chain relationship, a central issue in modern contract and organization theory.Footnote 3
Third, this article contributes to the innovation literature. Innovation is a crucial driver of long-run growth at both firm and national levels (Solow (Reference Solow1956)). Gupta, Raman, and Shang (Reference Gupta, Raman and Shang2020) find that firms headquartered in states with high social capital are associated with more in-house innovation. Recent studies suggest that, in addition to in-house innovation, manufacturing firms rely on their parts and material suppliers for relationship-specific innovation (Henke and Zhang (Reference Henke and Zhang2010)), and innovation by upstream suppliers has become increasingly important for downstream firms’ competitiveness (Huston and Sakkab (Reference Huston and Sakkab2006)). We complement these studies by identifying the role of social capital in promoting innovation outside firm boundaries.
The remainder of this article proceeds as follows: Section II reviews the related literature and develops our main hypothesis. Section III describes the data source, sample construction, and empirical methodology. Section IV provides empirical analyses of the impact of customers’ social capital on their suppliers’ relationship-specific investments. Section V concludes.
II. Literature Review and Hypothesis Development
A. Related Literature on Social Capital
Social capital is one of the informal institutions that has gained wide attention from various social science disciplines (Guiso et al. (Reference Guiso, Sapienza, Zingales, Benhabib, Bisin and Jackson2011)). In political science and economics, the predominant approach is to view social capital as a collective good embedded in the firm’s environment that all individuals in a given community can benefit from (e.g., Coleman (Reference Coleman1990), Putnam (Reference Putnam2000), and Guiso et al. (Reference Guiso, Sapienza, Zingales, Benhabib, Bisin and Jackson2011)). Political scientists define social capital as “features of social organization such as networks, norms, and social trust that facilitate coordination and cooperation for mutual benefits” (Putnam (Reference Putnam1995), p. 67). They emphasize that social structures and dense networks serve as enforcing mechanisms that foster cooperative actions (Fukuyama (Reference Fukuyama1995)). Economists emphasize a “norm” view of social capital, defining it as the shared cultural norms and beliefs that foster cooperation in the pursuit of socially valuable activities, that is, cooperative civic norms (Guiso, Sapienza, and Zingales (Reference Guiso, Sapienza and Zingales2008)). The values and beliefs are shared by a community and persist over time, often passed on to its members through intergenerational transmissions, formal education, or socialization (Guiso et al. (Reference Guiso, Sapienza and Zingales2004), (Reference Guiso, Sapienza, Zingales, Benhabib, Bisin and Jackson2011), Ichino and Maggi (Reference Ichino and Maggi2000)).
In recent years, there has been an emerging consensus in the economics literature to define social capital as the confluence of the strength of cooperative norms and the density of social networks that facilitate collective actions (Woolcock (Reference Woolcock1998), (Reference Woolcock2001), Guiso et al. (Reference Guiso, Sapienza, Zingales, Benhabib, Bisin and Jackson2011), Jha and Chen (Reference Jha and Chen2015), and Hasan et al. (Reference Hasan, Hoi, Wu and Zhang2017a), (Reference Hasan, Hoi, Wu and Zhang2017b)). Early studies examine the role of social capital in promoting trust and cooperation among agents from a macroeconomic perspective. Putnam (Reference Putnam1993) uses social capital to explain differences in the economic and government performance between northern and southern Italy. Knack and Keefer (Reference Knack and Keefer1997) find that social capital positively impacts economic growth. Guiso et al. (Reference Guiso, Sapienza and Zingales2004) show that social capital and the trust it engenders play an essential role in financial development, one crucial factor underlying economic prosperity.
Building on Ichino and Maggi’s (Reference Ichino and Maggi2000) finding in the northern/southern Italian context that employees quickly adhere to the norms of the location they find themselves in, a growing literature shows that the social norms of a firm’s location affect its managers’ behavior, even if they did not grow up there.Footnote 4 In particular, existing studies find that firms located in high social capital communities are less likely to engage in tax avoidance activities (Hasan et al. (Reference Hasan, Hoi, Wu and Zhang2017a)), expropriate nonshareholder stakeholders (Hoi et al. (Reference Hoi, Wu and Zhang2018)), commit fraud by misrepresenting financial information (Jha (Reference Jha2019)), and extract rent in CEO compensation (Hoi et al. (Reference Hoi, Wu and Zhang2019)). These findings suggest that social capital constrains corporate narrow self-interest and opportunism. Several studies document the economic benefits of social capital for firms. Jha and Chen (Reference Jha and Chen2015) find that auditors charge lower auditor premiums to firms located in high social capital regions. Hasan et al. (Reference Hasan, Hoi, Wu and Zhang2017b) show that lenders charge less on loans to firms in high social capital regions. Notably, these two studies show that outsiders (auditors and lenders) recognize and price the impact of social norms on firms. Gupta et al. (Reference Gupta, Raman and Shang2020) find that firms headquartered in states with high social capital are associated with more innovation.
B. Related Literature on the Hold-Up Problem
An extensive line of the economics literature on property rights and transaction costs has centered on what is commonly known as the “hold-up problem” (e.g., Williamson (Reference Williamson1979), (Reference Williamson1985), Grossman and Hart (Reference Grossman and Hart1986), Hart and Moore (Reference Hart and Moore1990)). At the core of the hold-up problem is a relationship-specific asset together with incomplete contracting. The presence of relationship-specific investments is pervasive in the economy. Within the supply chain, both suppliers and customers could be subject to hold-up risk by their trading partners (Klein et al. (Reference Klein, Crawford and Alchian1978)). Upstream and downstream firms often need to make relationship-specific investments to maximize economic efficiency when entering supply chain relations, exposing themselves to the risk of postcontract opportunism by the owner of the other assets, which a quasi-rent stream highly depends upon (Williamson (Reference Williamson1985)).Footnote 5 Contract incompleteness necessitates ex post renegotiation, which provides an opportunity to the trading partner to expropriate the quasi-rent by engaging in a hold-up (Klein et al. (Reference Klein, Crawford and Alchian1978)). The potential for hold-ups increases transaction costs by inducing parties to invest in “safeguards” to improve postcontractual bargaining positions and by leading to underinvestment in relationship-specific assets (Klein et al. (Reference Klein, Crawford and Alchian1978)). In either case, inefficiency results (Holmstrom and Roberts (Reference Holmstrom and Roberts1998)).
Vertical integration, cross-equity stakes, and overlapping institutional ownership have all been studied as possible solutions to the hold-up problem, each with advantages and disadvantages (Fee, Hadlock, and Thomas (Reference Fee, Hadlock and Thomas2006), Chen (Reference Chen2024), and Freeman (Reference Freeman2025)). Any contractual solution to the hold-up problem requires an enforcement mechanism, either explicit through the legal system or implicit through repeated interactions and market-based enforcement mechanisms. The key to the implicit enforcement mechanism is the long-term, repeated nature of the interaction. However, MacLeod (Reference MacLeod2007) suggests that the informal mechanism ensuring parties abide by their agreements need not rely on repeated trade with the same agent. Instead, it can be enforced in a sequence of one-off trades through community enforcement, where the tarnished reputation of the party engaging in hold-ups affects the transaction terms of the other participants in the market.Footnote 6 Along this line of research, a recent study by Dasgupta, Zhang, and Zhu (Reference Dasgupta, Zhang and Zhu2021) finds that social connections between the senior managers and board members of suppliers and customers help increase reputation premiums and mitigate hold-ups in bilateral relationships. In particular, socially connected individuals face greater reputation losses from breaching implicit contracts because they are more likely to interact repeatedly across various spheres, even beyond their current business relationships. In addition, they often share common third parties in their respective networks and tend to have longer business relationships.
C. Hypothesis Development
North (Reference North1990) argues that institutions, including both formal rules and informal rules, shape how humans interact with each other, and many informal rules influence actions more pervasively than formal rules. In this study, we examine a previously underexplored informal institution, social capital, an environmental factor that fosters cooperative norms, in mitigating hold-up problems along the supply chain.
Norms, or shared values and beliefs, make a group more than simply the sum of its individual members (Durkheim (Reference Durkheim1953)). They are often passed on to members through intergenerational transmissions, formal education, or socialization (Guiso et al. (Reference Guiso, Sapienza, Zingales, Benhabib, Bisin and Jackson2011)). Prior literature provides ample support for the assumption that local norms affect a firm’s organizational culture and its managers’ decisions. First, managers, regardless of their origins, are susceptible to the influence of social peers surrounding corporate headquarters, such as neighbors and social club members, through socialization (Hasan et al. (Reference Hasan, Hoi, Wu and Zhang2017a)). Similarly, employees converge to the norms of a new community when they move to it (Ichino and Maggi (Reference Ichino and Maggi2000)). Second, the personnel psychology literature suggests that particular kinds of persons will remain in an organization through “attraction to an organization, selection by it, and attrition from it” (Schneider (Reference Schneider1987)). Thus, managers sharing cooperative norms are more likely to be attracted to and retained in companies located in high social capital communities. Third, local residents born and raised in the community are more likely to be hired as managers at different levels of the organization.
In high social capital communities, norms of cooperation induce people to dislike actions that obtain private benefits at high social costs (Guiso et al. (Reference Guiso, Sapienza, Zingales, Benhabib, Bisin and Jackson2011)). Postcontractual opportunistic behaviors such as engaging in hold-ups are contrary to the prescribed values associated with cooperative norms. Managers in firms located in high social capital communities would bear more negative self-perceptions when perpetrating opportunistic behavior (Elster (Reference Elster1989), Erard and Feinstein (Reference Erard and Feinstein1994)), even if the actual opportunistic behavior is unobserved (Elster (Reference Elster1989), Mazar, Amir, and Ariely (Reference Mazar, Amir and Ariely2008)). Dense social networks, by enhancing information sharing among community members, further heighten innate negative moral sentiment and intensify the external social sanction when the opportunistic behavior is revealed. Thus, one’s own conscience, coupled with the external sanctions in the case of noncompliance, increases the costs of engaging in hold-ups.
In summary, social capital constrains expropriating hold-up behavior. Importantly, as discussed earlier, Jha and Chen (Reference Jha and Chen2015) and Hasan et al. (Reference Hasan, Hoi, Wu and Zhang2017b) provide evidence that outsiders interacting with firms located in areas with different levels of social capital are aware of the difference and incorporate it into their decisions. Thus, when suppliers make transactions with customer firms located in high social capital areas (hereafter high social capital customers), they have fewer concerns regarding hold-up risks compared to transactions with low social capital customers. The reduction in perceived risk incentivizes suppliers to make more relationship-specific investments. We formalize our main hypothesis as follows:
Hypothesis 1. Supplier firms make more relationship-specific investments when transacting with high social capital customer firms.
III. Research Design and Sample
This section introduces the measures for the two main variables of our study, customer firms’ social capital and supplier firms’ relationship-specific investments, and then describes the regression models and sample selection procedures.
A. Measures of Social Capital
We use the county-level social capital data provided by the Northeast Regional Center for Rural Development (NRCRD) at the Pennsylvania State University.Footnote 7 The NRCRD collects county-level data on voter turnouts in presidential elections (Pvote), response rates in U.S. census surveys (Respn), the total numbers of nonprofit organizations (Nccs), and the total numbers of 10 types of social organizations (Assn) for all U.S. counties in the years of 1990, 1997, 2005, 2009, and 2014. Following Rupasingha, Goetz, and Freshwater (Reference Rupasingha, Goetz and Freshwater2006), we use Pvote and Respn to capture the strength of county-level cooperative norms and use Nccs and Assn to capture the density of social networks in a county. Collectively, these four dimensions provide a general pattern of a county’s social capital that reflects the confluence of effects from social norms and associational social networks (Rupasingha et al. (Reference Rupasingha, Goetz and Freshwater2006), Hasan et al. (Reference Hasan, Hoi, Wu and Zhang2017a), (Reference Hasan, Hoi, Wu and Zhang2017b), and Hoi et al. (Reference Hoi, Wu and Zhang2018), (Reference Hoi, Wu and Zhang2019)).
We construct the local county’s social capital measure, SC, as the first principal component from a factor analysis based on Pvote, Respn, Nccs, and Assn, where the four factors are standardized to have a mean of 0 and a standard deviation of 1. Since the NRCRD only provides social capital data for 1990, 1997, 2005, 2009, and 2014, we fill in the data for missing years by using the most recent available data (although interpolation produces similar results). For example, we use the data of 1990 for the years 1991–1996.Footnote 8 The variable SC also serves as the proxy for the social capital of focal firms (supplier firms) headquartered in the county. Accordingly, the social capital of a specific customer of the focal firm, Customer Social Capital, is measured as the social capital of the county where the customer firm is headquartered.
B. Measures of Relationship-Specific Investments
Following recent studies (e.g., Dasgupta et al. (Reference Dasgupta, Zhang and Zhu2021), Freeman (Reference Freeman2025)), we focus on supplier innovation activities to infer relationship-specific investments. Our main relationship-specific investment measures rely on cross-firm patent citations along the supply chain. We use the patent database compiled by Kogan, Papanikolaou, Seru, and Stoffman (Reference Kogan, Papanikolaou, Seru and Stoffman2017), who downloaded the entire history of U.S. patent documents from Google Patents and carefully matched them to CRSP.Footnote 9 The granularity of the patent and citation data allows us to capture whether the supplier’s innovation is tailored to specific customers.
Specifically, we take advantage of the richness of patent data to construct pair-level measures that speak to the technological relatedness of innovation along the supply chain. The presence of cross-citations along the supply chain suggests that the supplier customizes its innovation to align with its customers’ technology. Such cross-citations capture the extent of relationship-specific investments made by suppliers and are used to construct two measures for suppliers’ relationship-specific investments. The first variable, Supp Cites Custi,j,t, is a dummy variable that takes the value of 1 if supplier firm i cites customer firm j’s patents in year t, and 0 otherwise. The second variable, # of Supp Citesi,j,t, is the number of cross-citations made by supplier i to customer j’s patents in year t.
C. Empirical Design
We estimate the following fixed-effect regression model to test whether there is a positive association between customers’ social capital and suppliers’ relationship-specific investments:
 $$ {RSI}_{i,j,t}={\beta}_1{Customer\ Social\ Capital}_{j,t-1}+{\mathbf{X}}^{\prime}\boldsymbol{\unicode{x03D5}} +{\mu}_i+{\nu}_t+{\varepsilon}_{i,j,t}, $$
where subscripts i, j, and t index supplier firm, customer firm, and year, respectively.
The dependent variable, RSIi,j,t, is supplier firm i’s relationship-specific investment with respect to customer firm j in year t, measured either by the cross-citation dummy Supp Cites Cust or cross-citation count # of Supp Cites. For a count-based outcome variable, Cohn, Liu, and Wardlaw (Reference Cohn, Liu and Wardlaw2022) show that the traditional linear regression approach with the “log-like” transformation of the variable, such as log(1 + # of Supp Cites), generates estimates that lack a natural interpretation and may have incorrect signs. By contrast, a fixed-effect Poisson model yields consistent and reasonably efficient estimates under more general conditions. Thus, throughout our empirical analyses, we estimate an OLS model when RSI is measured by Supp Cites Cust and a Poisson model when RSI is measured by # of Supp Cites.
Customer Social Capital j,t–1 is the main independent variable of interest in the regression, which reflects customer firm j’s social capital in year t – 1. According to our hypothesis, supplier firms are more willing to undertake relationship-specific investments with high social capital customers because they incorporate their customers’ potential opportunism into their investment decisions and higher social capital from customers is able to mitigate hold-up concerns. Therefore, our hypothesis predicts that β 1 is positive.
X is a vector of control variables lagged by 1 year. It includes the fraction of the supplier’s sales to the specific customer, Sales to Customer, capturing the importance of the customer to the supplier. It also includes the supplier firm’s characteristics as follows: Size is the natural logarithm of total assets; Leverage is the book value of long-term debt plus debt in current liabilities divided by book assets; MTB is the market to book ratio, defined as the market value of assets divided by the book value of assets; Tangibility is fixed assets divided by total assets; ROA is earnings before interest, tax, and depreciation divided by beginning-of-period assets; R&D is R&D expenses divided by beginning-of-period assets; CAPEX is capital expenditure divided by beginning-of-period assets; HHI is the Herfindahl–Hirschman index of the firm’s industry; and HHISQ is the squared value of HHI.
The customer firm’s characteristics such as its operating performance and financial condition could signal supply chain risk and affect the supplier’s corporate decisions and performance (Campello and Gao (Reference Campello and Gao2017)). Thus, X also includes the customer firm’s size, leverage, ROA, and R&D expenses (denoted as Customer Size, Customer Leverage, Customer ROA, and Customer R&D, respectively), all defined analogously to the corresponding variables of the supplier firm.
Finally, we include firm fixed effects μi to control for the influence of firm-level time-invariant characteristics and year fixed effects νt to control for the impact of macroeconomic factors. We cluster standard errors by firm to account for within-firm correlations.
D. Sample
We use the NRCRD data to construct customer firms’ social capital. We identify major customers for each firm using the Compustat segment files. Although FactSet Revere also provides information on supply chains, we use the Compustat segment files because they identify “principal customers” and provide sales data, which allows us to evaluate the economic importance of supplier–customer relationships. Under SFAS Nos. 14 and 131, public firms are required to disclose the identity of any customer who contributes more than 10% of their total sales. Firms’ historical headquarters location information is available from the EDGAR system.Footnote 10 Control variables are constructed using data from Compustat. After excluding financial and utility firms and observations with missing values, the final sample contains 17,837 supplier–customer–year observations from 2,465 supplier firms during the sample period of 1990 to 2010.Footnote 11
IV. Empirical Results
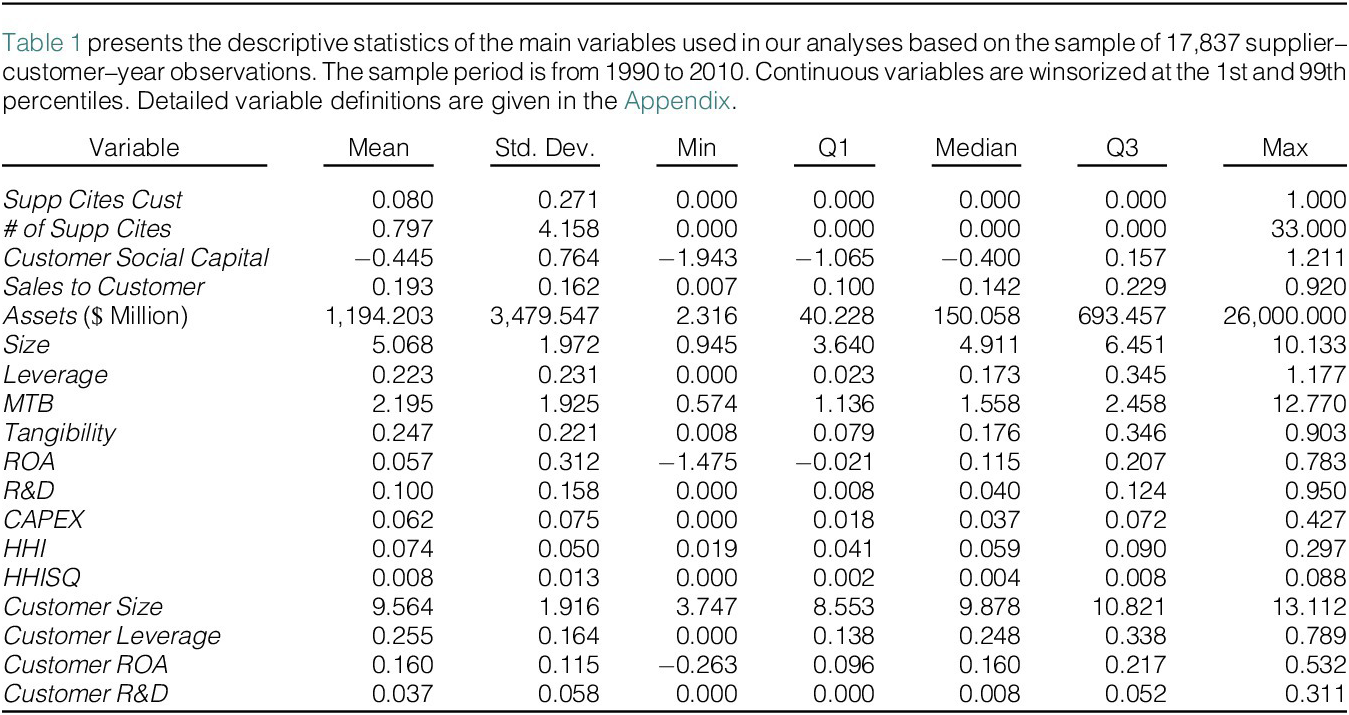
Table 1 presents the descriptive statistics for the sample. To avoid the influence of outliers, all continuous variables are winsorized at the top and bottom 1% levels. Unconditionally, suppliers cite their customers’ patents in 8.0% of supplier–customer–years, averaging 0.797 citations. Conditional on citing any patents, a supplier cites its customers’ patents 30% of the time, with an average of 8 citations to its customers’ patents (untabulated). The average value of customers’ social capital is −0.445 with a standard deviation of 0.764 (recall that Customer Social Capital is a principal component, so the level is not directly interpretable). The fraction of sales to an average major customer is 19.3%. The average supplier firm has total assets of $1,194 million, a leverage of 0.22, a market-to-book ratio of 2.195, and an ROA of 0.057.

A. Baseline Results
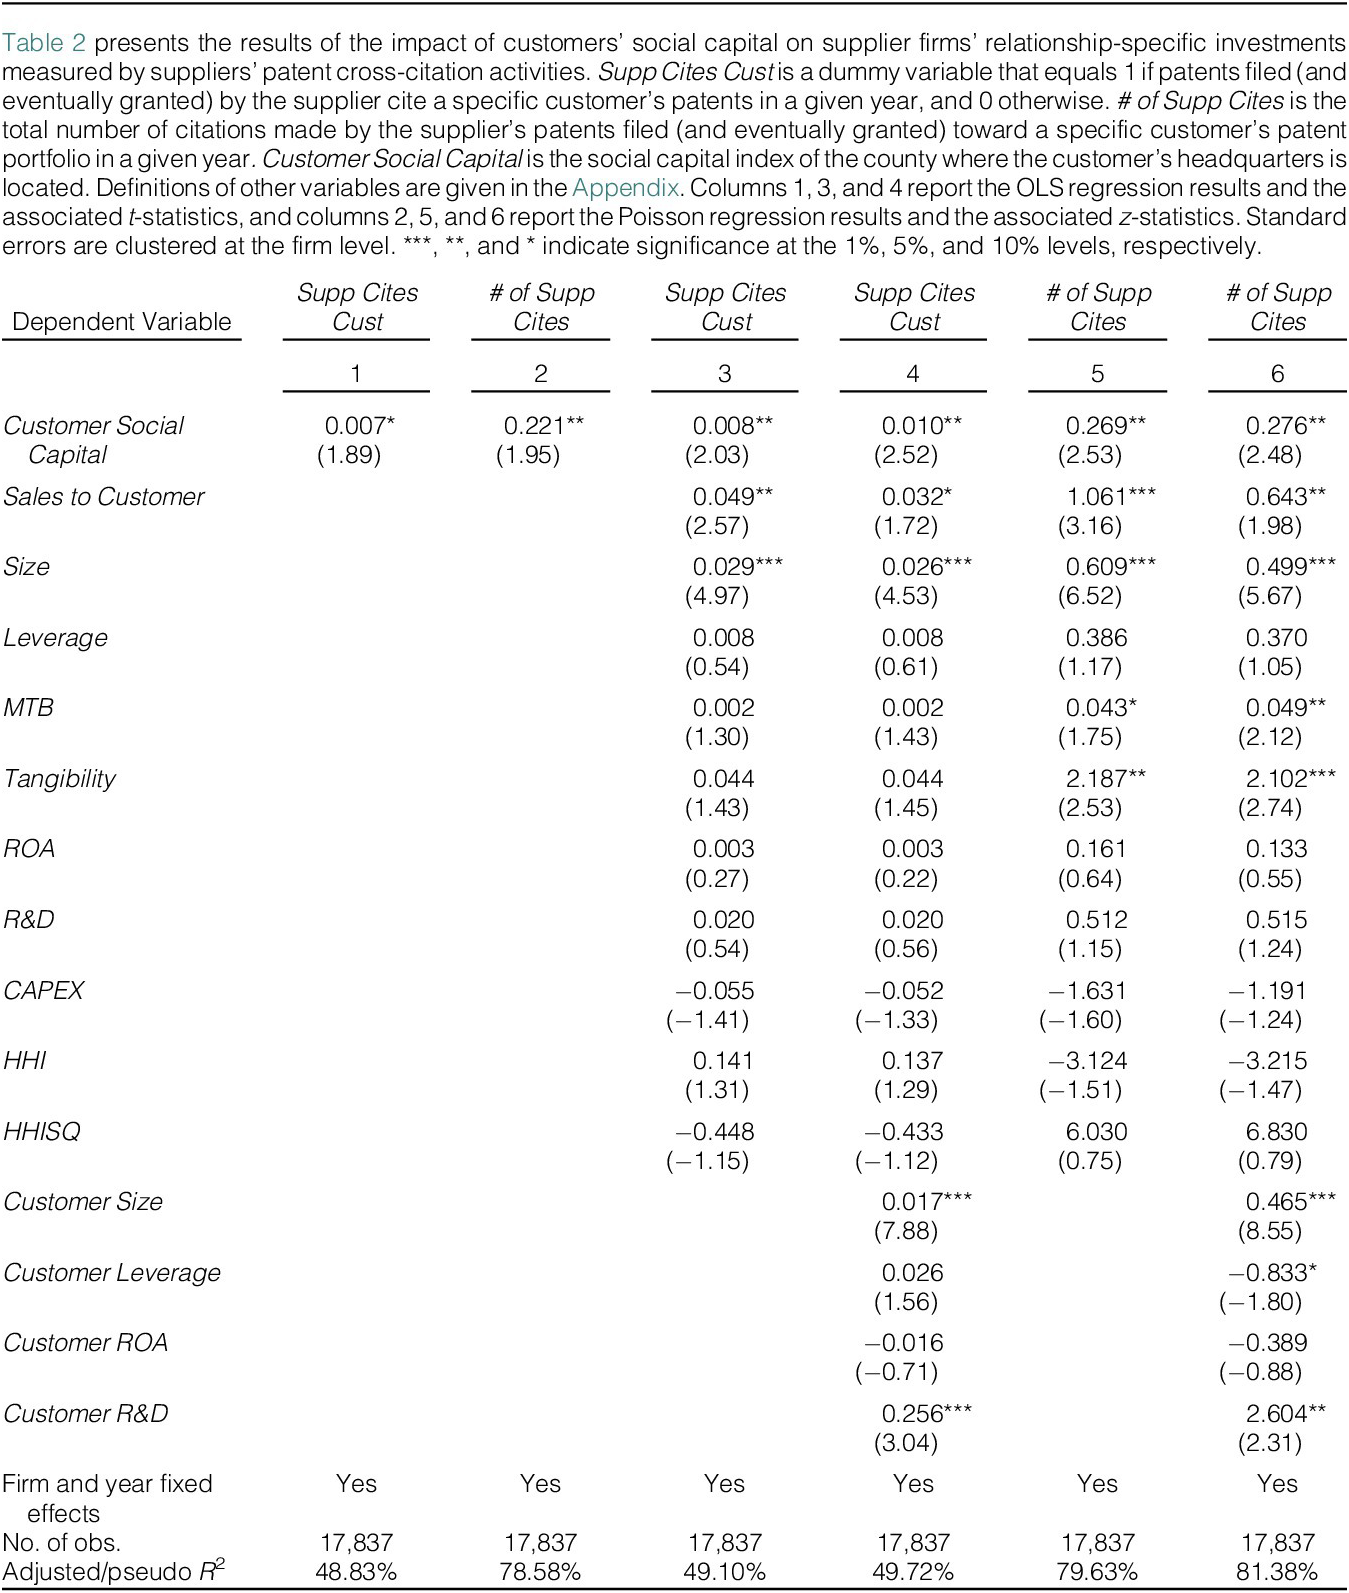
Table 2 presents the baseline regression results of model (1). Columns 1 and 2 present the results with only customer social capital and supplier firm and year fixed effects and establish that customer social capital explains relationship-specific investment even without additional controls. Column 3 uses Supp Cites Cust as the dependent variable and includes only the firm’s own characteristics as controls, while column 4 adds the customer firm’s characteristics as controls. Notably, all specifications include supplier firm fixed effects, so the variation comes from within the supplier across customers as customer social capital changes. In both columns, the coefficient estimates on Customer Social Capital are significantly positive (0.008, t-stat = 2.03 in column 3; 0.010, t-stat = 2.52 in column 4), suggesting that firms undertake more relationship-specific investments when making transactions with high social capital customers. The results are also economically meaningful. When the level of the customer’s social capital increases by 1 standard deviation (0.764), the estimated coefficient in column 4 translates into a 0.76 percentage point increase in the supplier firm’s likelihood of citing the customer’s patents, which is equivalent to 9.5% of the unconditional sample mean of Supp Cites Cust.

Columns 5 and 6 present the Poisson regression results using the number of the supplier’s citations to the customer’s patents, # of Supp Cites, to proxy for relationship-specific investment. Similarly, the coefficient estimates on Customer Social Capital are positive and statistically significant (0.269, z-stat = 2.53 in column 5; 0.276, z-stat = 2.48 in column 6). For 1 standard-deviation increase in the customer’s social capital, the estimated coefficient in column 6 indicates that the expected citations to the customer’s patents by the supplier increase by 23.5% (i.e., exp(0.764 × 0.276) – 1). Our baseline results thus confirm that suppliers undertake more relationship-specific investments (customer-oriented innovations) in relationships with high social capital customers.
We have shown that customers’ social capital is positively associated with corporate relationship-specific investments. However, this positive correlation does not necessarily imply causation. For example, a firm can select its customers, and customers’ social capital would be a result of this selection. Of course, endogenous selection of customers that are less likely to behave opportunistically is itself evidence of the mechanism we are testing. A more serious concern is that unobserved factors may simultaneously influence both customer selection and investment decisions, leading to spurious correlation. In the following sections, we conduct a series of tests to support a causal interpretation of our baseline results.
B. Cross-Sectional Tests
In this section, we test predictions of our proposed channel from social capital to relationship-specific investments. Evidence consistent with these predictions increases our confidence in the channel and limits alternative explanations to those that also vary in the same way in the cross section. If customers’ social capital indeed exerts a causal impact on suppliers’ relationship-specific investments by constraining customers’ opportunism, we expect that such effect would be more pronounced when other constraining mechanisms are weaker or the customers have stronger incentives to engage in hold-ups to begin with. Based on this argument, we derive several predictions and conduct cross-sectional tests as follows.
1. Influence of Suppliers’ Bargaining Power
Suppliers with strong bargaining power do not fear expropriation and thus do not need to rely on their customers’ social capital to protect their investment. By contrast, suppliers in a weak bargaining position are more vulnerable to trading partners’ opportunism (Hui, Klasa, and Yeung (Reference Hui, Klasa and Yeung2012)) and will have increased sensitivity to other constraints on such opportunism. Thus, we predict that the impact of customers’ social capital on suppliers’ relationship-specific investments will be more pronounced when suppliers lack bargaining power.
We use industry concentration and industry entry barriers to measure firms’ bargaining power (Kale and Shahrur (Reference Kale and Shahrur2007), Hui et al. (Reference Hui, Klasa and Yeung2012), and Campello and Gao (Reference Campello and Gao2017)). Firms operating in a concentrated industry or in an industry with high entry barriers possess stronger bargaining power relative to their customers since it is harder for the customer firms to find substitutes. The measure for industry concentration, HHI, is the Herfindahl–Hirschman index of the supplier firm’s industry, which is calculated using the refined text-based network industry classifications (TNIC) from Hoberg and Phillips (Reference Hoberg and Phillips2025).Footnote 12 The measure for the entry barrier of the firm’s industry is defined as the weighted average value of gross property, plant, and equipment of firms in the industry, where the weight is each firm’s market share of sales (Hui et al. (Reference Hui, Klasa and Yeung2012)). Using the medians of the two variables, we split our sample into high concentration (high entry barrier) and low concentration (low entry barrier) groups based on the sample median and re-estimate model (1) for the subsamples separately. We expect the association between customers’ social capital and corporate patent citations to be more pronounced among suppliers in industries with low concentration or with low entry barriers.
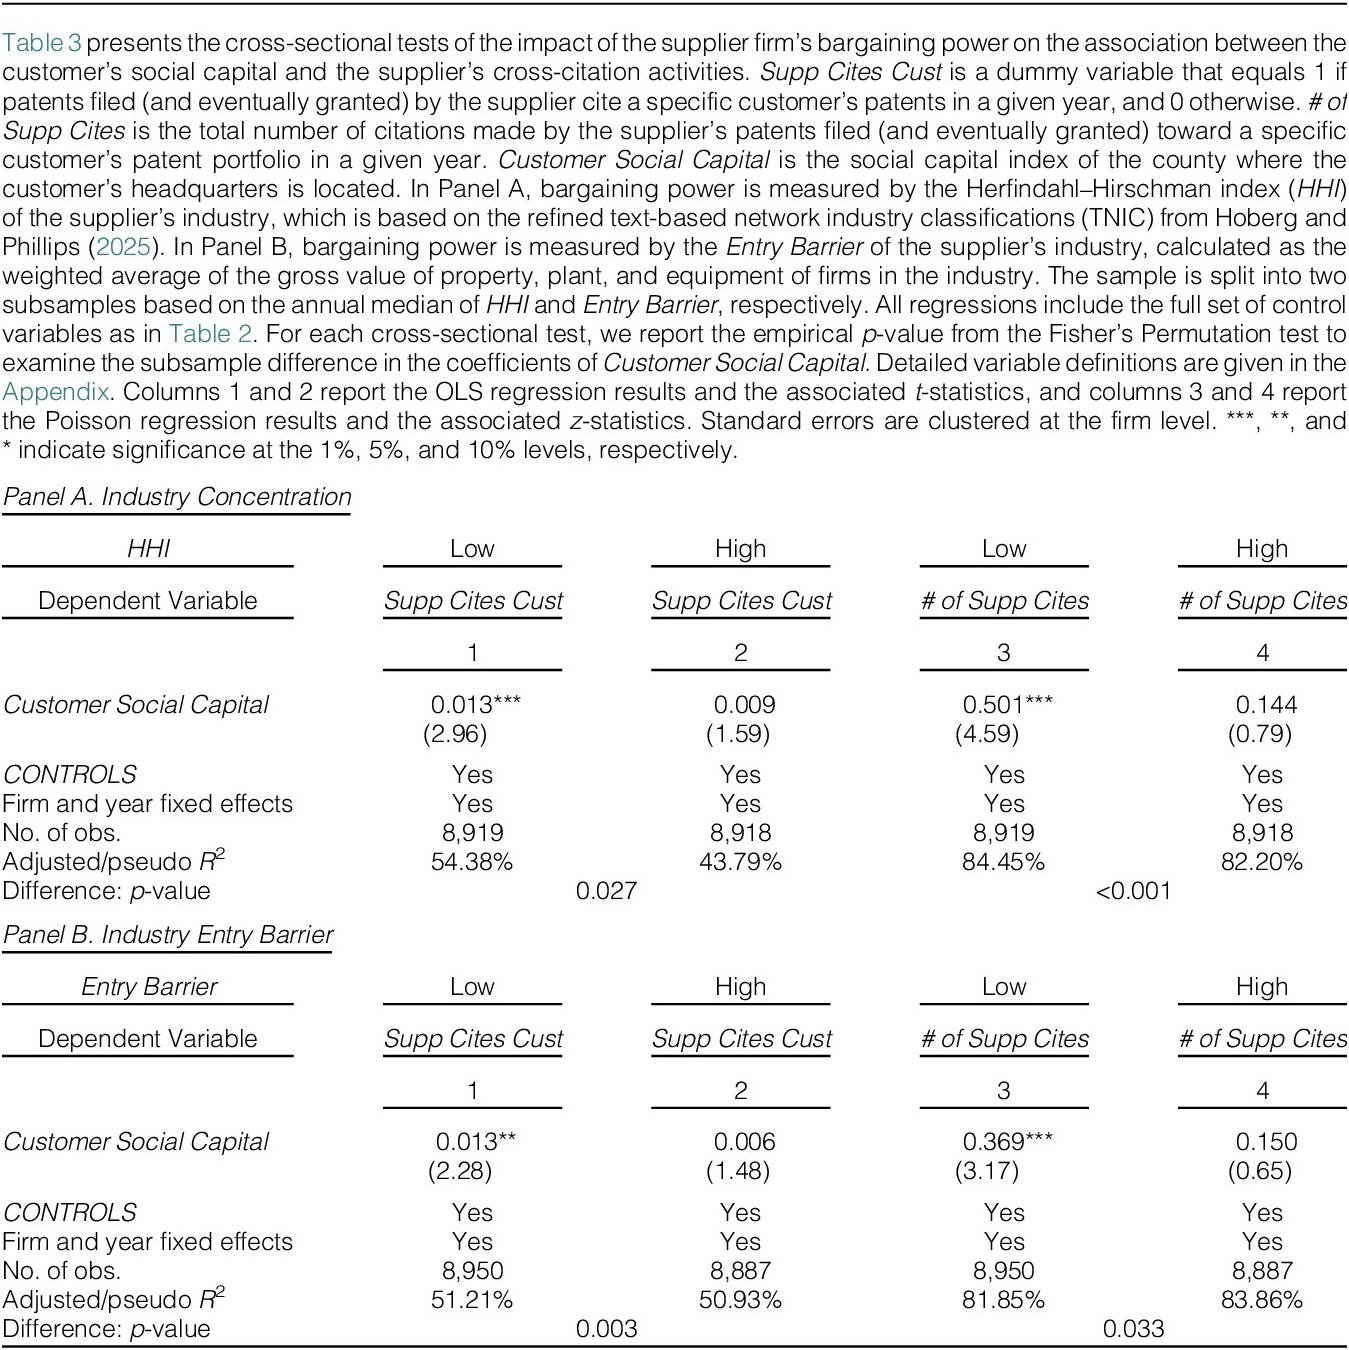
Table 3 presents the cross-sectional results of the influence of suppliers’ bargaining positions, with Panel A focusing on industry concentration and Panel B focusing on industry entry barriers. In Panel A, columns 1 and 2 use citation dummy Supp Cites Cust as the dependent variable, while columns 3 and 4 use citation count # of Supp Cites as the dependent variable. In the first two columns, the coefficient on Customer Social Capital is only significant in column 1 when firms are in low concentration industries (0.013, t-stat = 2.96 in column 1; 0.009, t-stat = 1.59 in column 2). This result suggests that firms’ relationship-specific investments are more sensitive to customers’ social capital when they have weak bargaining power. The p-value presented at the bottom of the panel confirms that the difference in the coefficients of Customer Social Capital between the two subsamples is significant at the 5% level. The two coefficient estimates suggest that a 1-standard-deviation increase in customers’ social capital will increase the likelihood of citing customers’ patents by 1 and 0.7 percentage points for supplier firms in the low and high concentration industries, respectively, which is equivalent to 12.5% and 8.6% of the sample mean. The regressions in columns 3 and 4 use citation count # of Supp Cites as the dependent variable and exhibit a similar pattern.

Panel B of Table 3 presents the results using the industry entry barrier as the proxy for corporate bargaining positions. The results are similar to Panel A; the relationship-specific investments of firms in the low entry barrier industries (i.e., with weak bargaining power) exhibit a stronger association with customers’ social capital. The coefficient differences between high and low entry barrier subsamples are also statistically significant and economically nontrivial.
2. Influence of Suppliers’ Asset Specificity
Hold-ups are especially tempting when the quasi-rent is large. The quasi-rent increases with asset specificity, which implies that a high degree of asset specificity subjects suppliers to greater hold-up risks. If social capital constrains the temptation to renege or behave opportunistically, we expect that the positive association between customers’ social capital and suppliers’ relationship-specific investments is more pronounced when suppliers have high levels of asset specificity.
To test this conjecture, we use two proxies of asset specificity. The first measures corporate asset redeployability, or the extent to which assets have alternative uses, as defined in Kim and Kung (Reference Kim and Kung2017).Footnote 13 Firms with high asset redeployability find it easier to sell their assets to alternative users or switch assets to alternative uses, thus having lower asset specificity. The second is a dummy variable that takes the value of 1 if a firm operates in durable-goods manufacturing industries, that is, industries with 3-digit SIC codes 245, 250–259, 283, 301, and 324–399, and 0 otherwise (Hui et al. (Reference Hui, Klasa and Yeung2012)). We split our sample into two subsamples based on whether a firm’s asset redeployability is above the sample median or whether a firm is a durable good producer, and then, we re-estimate the baseline model for the subsamples separately.
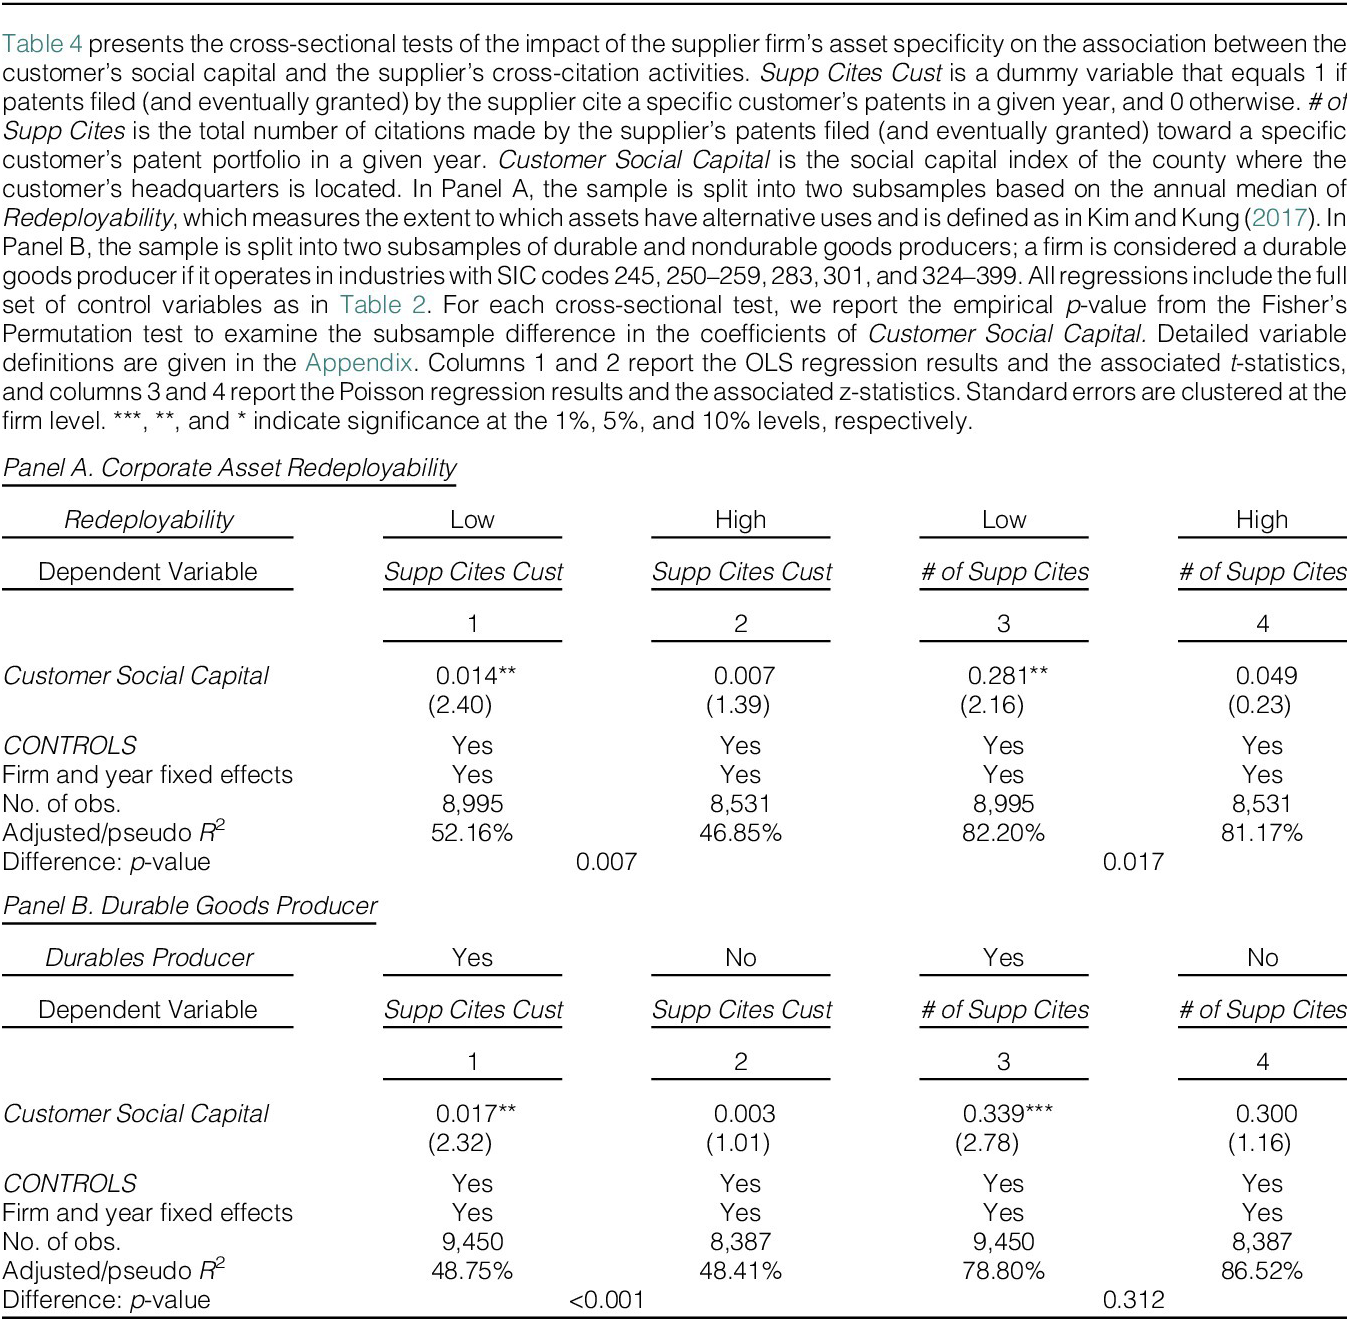
Table 4 presents the cross-sectional test results conditional on the supplier firm’s asset specificity, which is measured by asset redeployability in Panel A and by the durable goods producer dummy in Panel B. In columns 1 and 2 of each panel, the dependent variable is the citation dummy Supp Cites Cust, while in columns 3 and 4, it is citation count # of Supp Cites. Using either asset redeployability or the durable goods producer dummy to split the sample, the coefficient estimate on Customer Social Capital is only significant in columns 1 and 3 when firms have high asset specificity but insignificant in columns 2 and 4 when firms have low asset specificity. This implies that firms’ relationship-specific investments are more sensitive to their customers’ social capital when they have higher asset specificity.

3. Influence of Customers’ Financial Condition
Firms in weaker financial condition face pressure to maximize cash flow, even at the expense of devaluing long-term relationship benefits. These increased incentives for opportunistic behavior magnify the role of social capital in mitigating such opportunism. Thus, we predict that customer firms’ social capital will be even more important to suppliers considering relationship-specific investment, when those customers would otherwise be more likely to behave opportunistically.
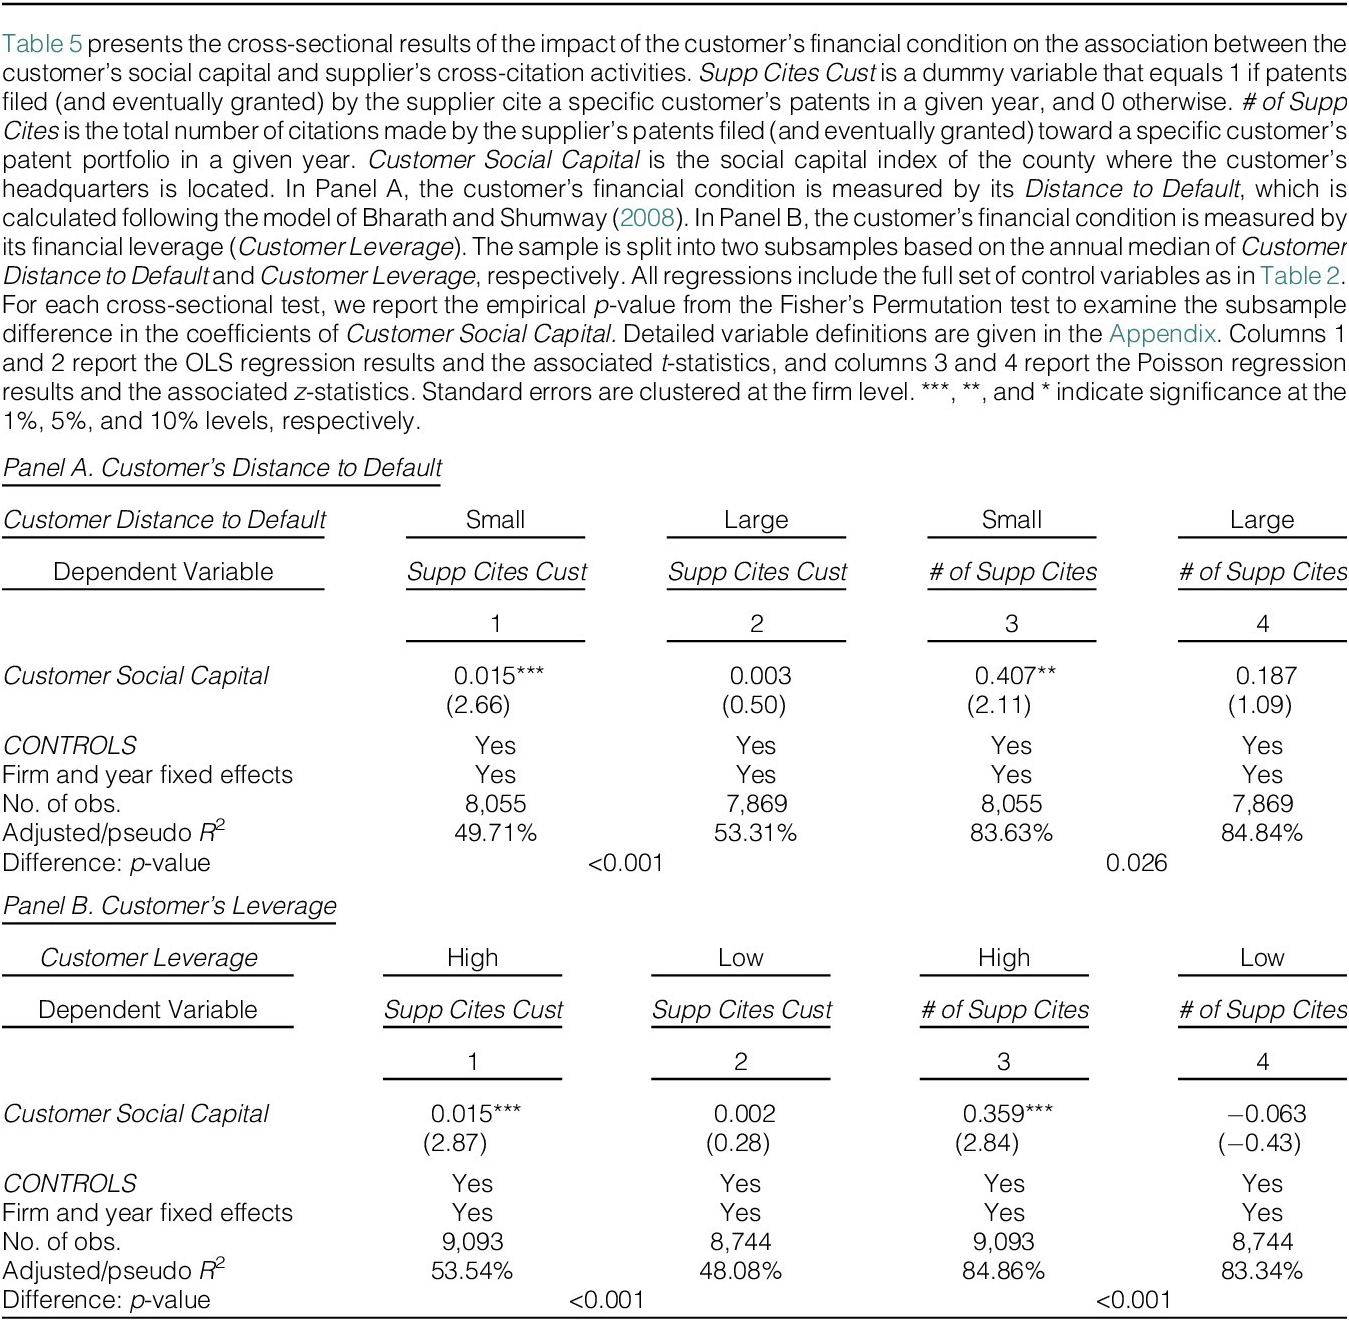
Following Campello and Gao (Reference Campello and Gao2017), we use customers’ distance to default and financial leverage (Customer Leverage) to measure their financial condition. We split the sample based on the sample median of the two variables and re-estimate model (1) for the subsamples separately. The results are presented in Table 5, with Panel A using customers’ distance to default and Panel B using customers’ leverage as the partitioning variable.

In Panel A, the dependent variable is citation dummy Supp Cites Cust in columns 1 and 2, while it is citation count # of Supp Cites in columns 3 and 4. The coefficient estimate of Customer Social Capital is positive and significant in columns 1 and 3 when the customer’s distance to default is small but is insignificant in columns 2 and 4 when the customer is far from default. The results confirm that the positive association between customers’ social capital and suppliers’ relationship-specific investments is more pronounced when customers have weak financial positions (i.e., small distance to default). The results in Panel B provide a similar pattern when we use customers’ leverage to measure financial condition.
C. Evidence on the Underlying Mechanism
1. Customers’ Social Capital and Transmission of Negative Shocks
Our main hypothesis is based on the assumption that suppliers transacting with high social capital customers are less likely to experience postcontractual opportunism by the customers, and thus, they are more willing to undertake relationship-specific investments. In this section, we provide some evidence to substantiate this argument by examining the transmission of negative economic shocks along the supply chain. Specifically, when customers experience negative shocks, they could pass on the shocks to captive suppliers (who have made relationship-specific investments) by demanding lower prices, reducing orders, or delaying payments. We expect that high social capital customers are less likely to do so if social capital mitigates hold-up risk in the supply chain relationship. To test this prediction, we estimate the following regression model:
 $$ {\displaystyle \begin{array}{c}{PERFORMANCE}_{i,t}={\lambda}_1{Customer\ Social\ Capital}_{j,t-1}\\ {}\hskip14em +{\lambda}_2Customer\hskip0.35em Negative\hskip0.35em {Shock}_{j,t}\\ {}\hskip15.5em +\hskip0.3em {\lambda}_3{Customer\ Social\ Capital}_{j,t-1}\\ {}\hskip13em \times Customer\hskip0.3em Negative\hskip0.35em {Shock}_{j,t}\\ {}\hskip6.5em +\hskip0.3em {\mathbf{X}}^{\mathrm{\prime}}\unicode{x03D5} +{\mu}_i+{\nu}_t+{\varepsilon}_{i,t}.\end{array}} $$
The dependent variable, PERFORMANCEi,t, is the performance of supplier firm i in year t, measured by either sales growth or return on assets (ROA). Customer Negative Shockj,t is a dummy variable that equals 1 if customer firm j experiences a negative shock in year t. X is a set of control variables as in model (1), excluding ROA. μi and νt are firm and year fixed effects, respectively.
When a negative shock hits the customer, we expect it to propagate along the supply chain and adversely affect the supplier’s performance, which predicts a negative coefficient on Customer Negative Shock (i.e., λ 2 < 0). Moreover, our earlier discussion suggests that high social capital customers are less likely to pass on negative shocks to their suppliers. If this prediction holds, the interaction term between the customer’s social capital and the shock dummy should have a positive coefficient (i.e., λ 3 > 0).
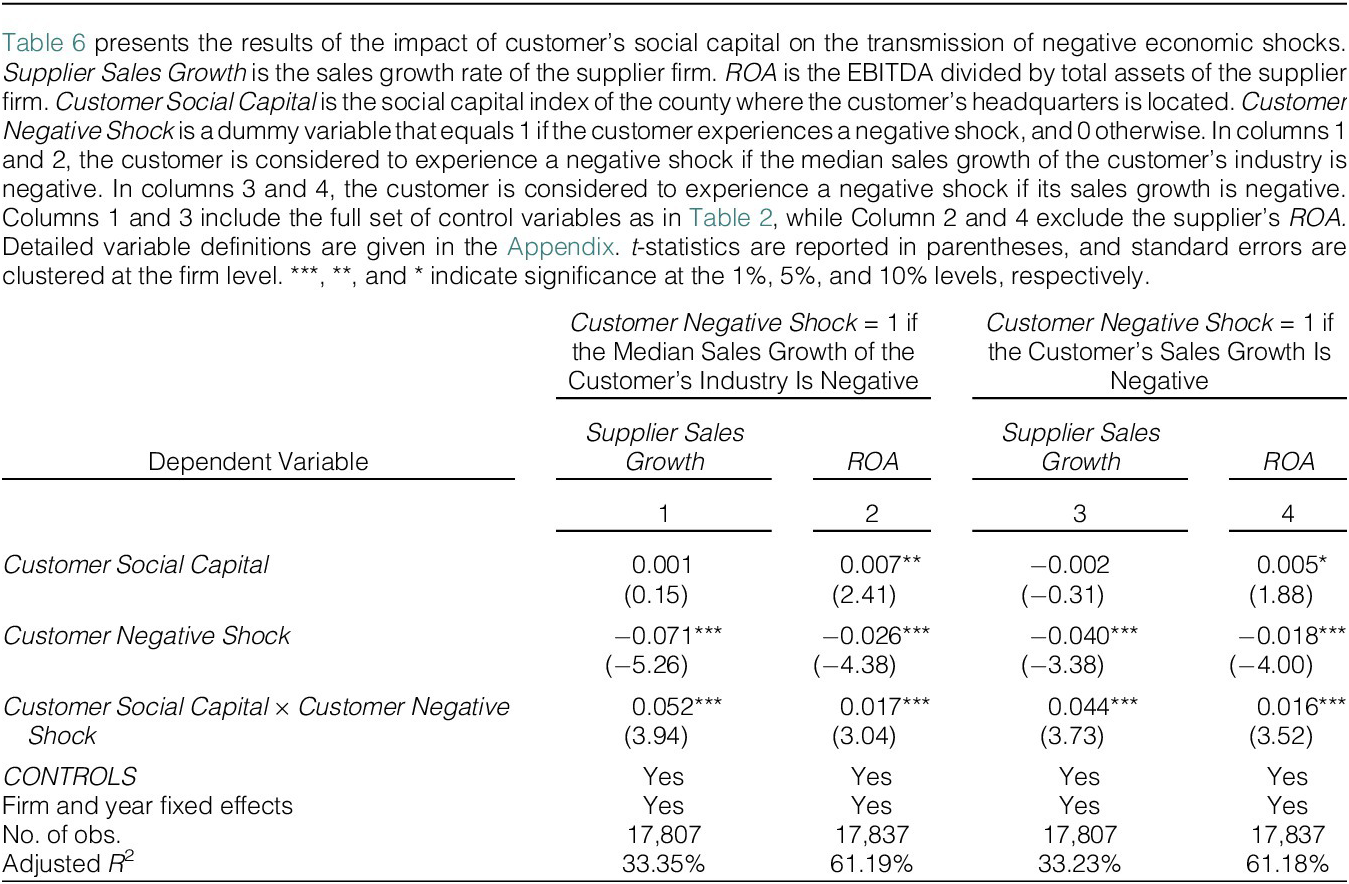
Table 6 presents the regression results, with the dependent variable being sales growth and return on assets in odd and even columns, respectively. In the first two columns, the customer firm is identified as experiencing a negative shock in a given year when the median sales growth of all listed firms in the customer’s industry is negative. As shown in columns 1 and 2, the coefficient of Customer Negative Shock is significantly negative, but that of Customer Social Capital × Customer Negative Shock is significantly positive. This implies that the supplier’s sales growth and ROA decrease significantly when the customer firm’s industry experiences a downturn, but the negative impact is smaller when the customer is located in a high social capital area, consistent with our prediction that high social capital customers are less likely to transmit negative shocks to their suppliers. This finding is notable since our main result suggests that suppliers make more relationship-specific investments when transacting with high social capital customers. The stronger bonding implies that, in the absence of mitigating actions by their customers, suppliers would be more adversely affected by the customers’ negative shocks.

One concern of using industry-level performance to construct the shock dummy is that the observed positive interaction between Customer Social Capital and Customer Negative Shock is driven by the superior performance of high social capital customers during industry downturns. To address this concern, we repeat the analysis using a shock measure based on firm-level performance. Specifically, the customer is considered to experience a negative shock if its sales growth is negative. As shown in columns 3 and 4, we continue to obtain negative coefficients on Customer Negative Shock and positive coefficients on Customer Social Capital × Customer Negative Shock.
2. Customers’ Social Capital and the Duration of Supplier–Customer Relationships
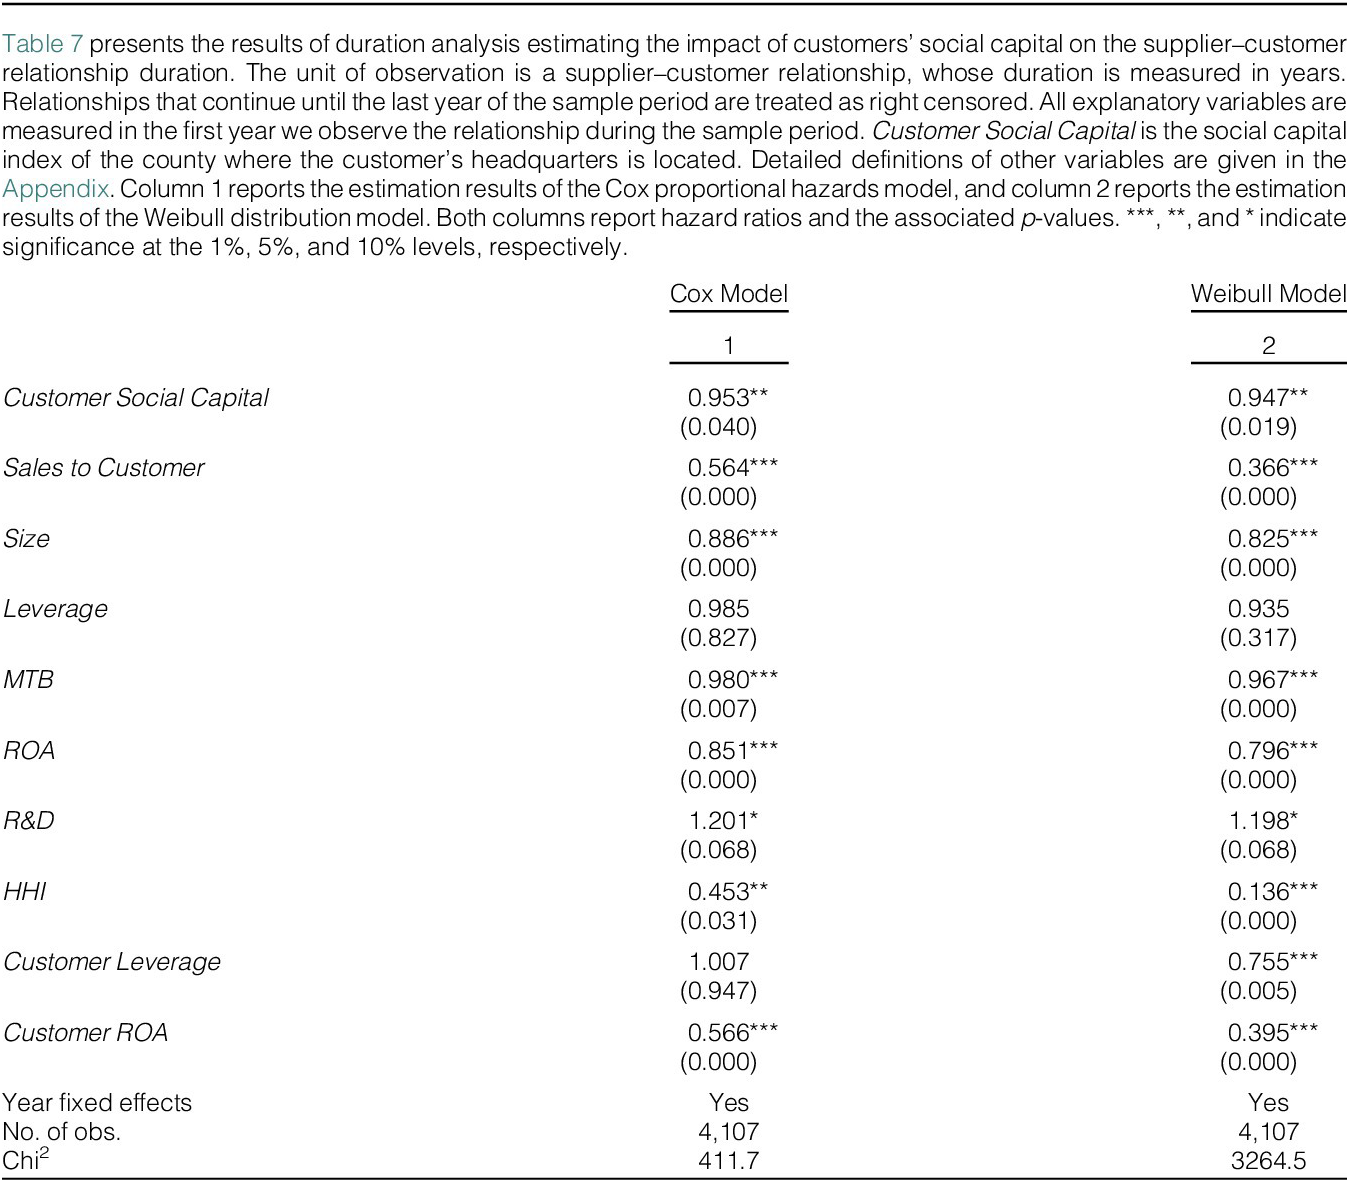
In this section, we examine the influence of customers’ social capital on the duration of supplier–customer relationships. If high social capital customers value cooperation and refrain from engaging in opportunistic activities, their trading relationships with suppliers are more likely to be sustained and have a longer duration. To test this prediction, we conduct a proportional hazard survival analysis of the length of supplier–customer relationships as in Dasgupta et al. (Reference Dasgupta, Zhang and Zhu2021). In this analysis, each business relationship serves as a unit of observation, and all explanatory variables are measured in the first year we observe the relationship within our sample. Relationships persisting until the final year of our sample are treated as right-censored. We conduct our analyses using the Cox proportional hazards and Weibull models. In each model, the main explanatory variable is the customer’s social capital (Customer Social Capital). We also control for a set of variables identified in prior literature that have an impact on relationship duration (Fee et al. (Reference Fee, Hadlock and Thomas2006), Dasgupta et al. (Reference Dasgupta, Zhang and Zhu2021)), including the fraction of sales to the customer, firm size, leverage, market-to-book ratio, ROA, R&D expenses, Herfindahl–Hirschman index of the firm’s industry, and the customer’s leverage and ROA. The estimated hazard ratio and p-value for each variable are reported in Table 7.

In duration analysis, a hazard ratio above (below) 1 implies that the explanatory variable shifts the hazard function upward (downward), thus increasing (decreasing) the hazard rate, that is, the likelihood of relationship termination. Consistent with our prediction, the hazard ratio of Customer Social Capital is significantly lower than 1 under both models (0.953, p-value = 0.040 for the Cox model; 0.947, p-value = 0.019 for the Weibull model), indicating that customers’ social capital helps decrease the hazard of relationship termination.Footnote 14 This evidence further supports the premise that customers’ social capital mitigates postcontractual opportunism and fosters improved cooperation within mutual relationships.
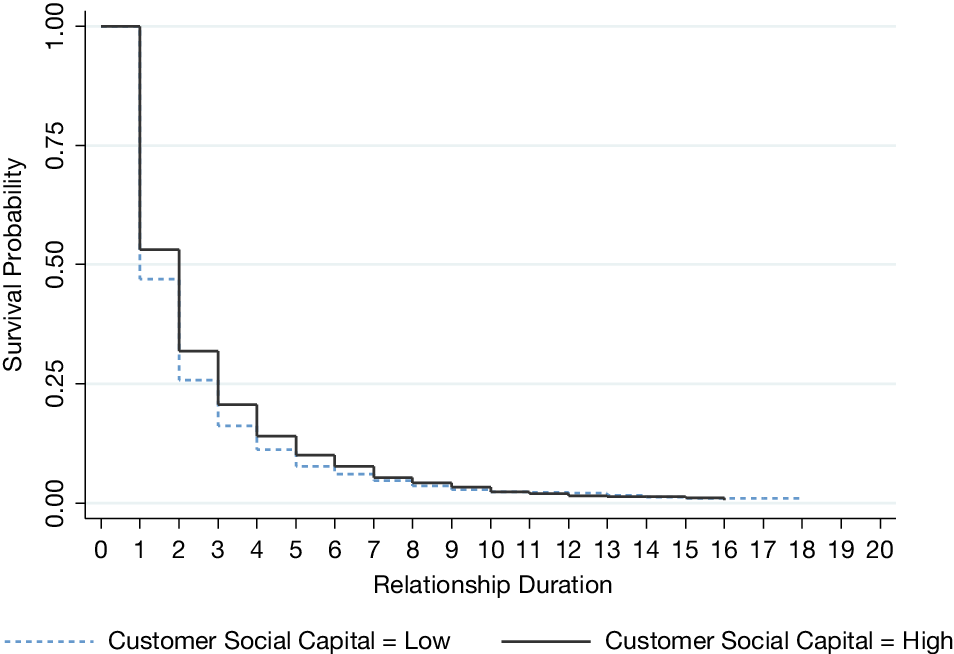
Figure 1 plots the Kaplan–Meier survival function of the supply chain relationship separately for firms with low and high levels of customer social capital. The figure shows that firms whose customers have high social capital exhibit higher survival probability, while those with low social capital customers have lower probability in the early years. This pattern is also consistent with the proportional hazard survival analysis above. Over time, the differences in survival probability diminish; social capital plays a more important role when suppliers and customers have limited prior interactions, whereas repeated interactions gradually substitute for location-based trust.
Figure 1 plots the Kaplan–Meier survival function for supply chain relationships, separately for firms with low social capital (below the median) and high social capital (above the median). The y-axis denotes survival probability, and the x-axis denotes relationship duration in years.

D. Further Analyses
In this section, we provide additional evidence of the impact of the customer’s social capital on the supplier’s relationship-specific investment. First, we investigate whether the customer’s social capital affects other aspects of the supplier’s innovation specificity, including the tradability of the supplier’s patents, the technological proximity between the supplier and the customer, and the sensitivity of the supplier’s R&D investment to that of the customer. As a complementary analysis, we then examine how social capital impacts vertical integration and the formation of customer–supplier relationships. If social capital mitigates hold-up concerns and promotes relationship-specific investments along the supply chain, we expect that high social capital firms will be less vertically integrated and rely more on trading partners for supplies.
1. Tradable Versus Nontradable Patents
If a higher level of the customer’s social capital incentivizes the supplier to engage in innovation tailored to the customer, the supplier is likely to produce patents that are less generalized to other applications and thus less easily traded. To measure the tradability of a patent, we obtain the patent reassignment data from the USPTO and calculate the percentage of patents that are reassigned among all patents in each technology class for each year. As in Dasgupta et al. (Reference Dasgupta, Zhang and Zhu2021), we classify a patent as tradable (nontradable) if the reassignment rate of its technology class is higher (lower) than the annual median of all technology classes. The rationale is that patents are likely more generalized if they can be reassigned to other firms. We then construct the variable Num Tradable (Num Nontradable) as the total number of tradable (nontradable) patents produced by the supplier firm in each year.
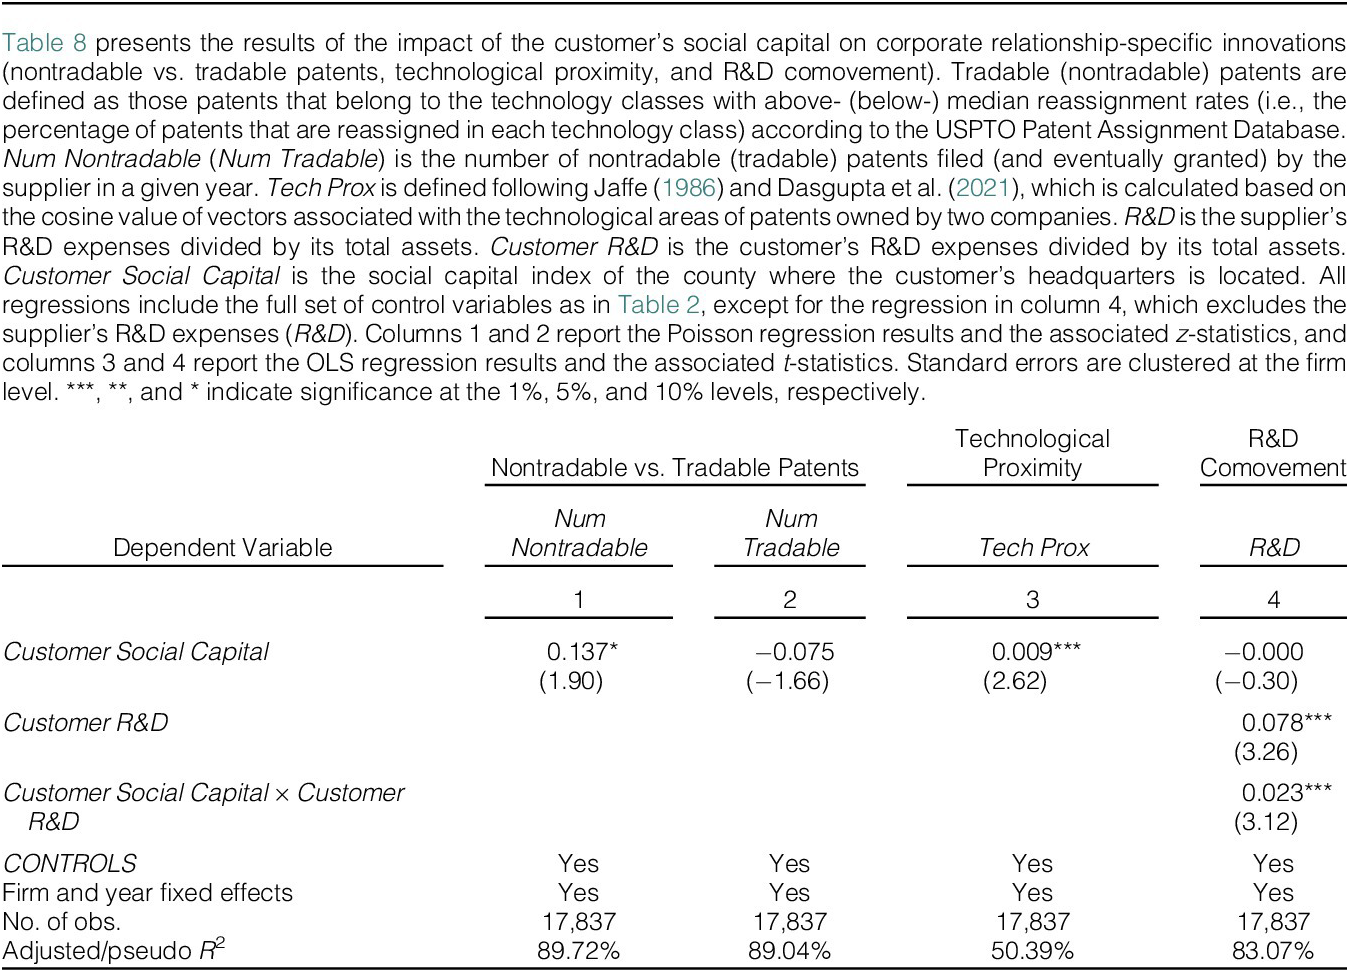
Using Num Tradable and Num Nontradable as the dependent variables, we estimate a fixed-effect Poisson model with the same set of explanatory variables as in our baseline model to examine the influence of customers’ social capital on their suppliers’ tradable and nontradable patents, respectively. Consistent with our prediction, the estimation results presented in columns 1 and 2 of Table 8 show that firms tend to produce more nontradable patents, but not more tradable patents, when transacting with high social capital customers.

2. Technological Proximity
Next, we examine the technological proximity between the supplier’s applied-for patents and the customer’s existing patent portfolio. If a customer’s social capital positively affects its supplier’s relationship-specific investments, the two firms’ technological proximity should increase. Following Jaffe (Reference Jaffe1986) and Bena and Li (Reference Bena and Li2014), the technological proximity measure is constructed based on the overlap of technology distribution classes between the two firms as follows:
 $$ {Tech\ Prox}_{i,j,t}=\frac{N_i{N}_j^{\prime }}{{\left({N}_i{N}_i^{\prime}\right)}^{\frac{1}{2}}{\left({N}_j{N}_j^{\prime}\right)}^{\frac{1}{2}}}, $$
where subscripts i and j index supplier and customer firms, respectively. Ni = (Ni1, N i2, N i3, …, N i37) is a vector documenting the technology distribution of the supplier firm in a given year. Each element in this vector is the share of patents applied for (and eventually granted) in each technology class. We use the mapping provided by Hall, Jaffe, and Trajtenberg (Reference Hall, Jaffe and Trajtenberg2001) to match the 426 technology classes from the USPTO to 37 subcategories. Nj is the technology distribution vector of the customer firm based on its existing patent portfolio produced in the past 5 years.
We then regress Tech Prox on customers’ social capital, controlling for the same set of covariates as in model (1). The results reported in column 3 of Table 8 show that the coefficient on Customer Social Capital is significantly positive (0.009, t-stat = 2.62), indicating that customers’ social capital has a positive effect on suppliers’ innovation specificity.
3. R&D Comovement Between the Supplier and Customer
In our baseline analyses, we measure a firm’s relationship-specific investment based on innovation output, that is, patents. Not all innovation produces patents, either due to failure, or secrecy. Thus, innovation input, particularly R&D spending, has also been used to proxy for relationship-specific investment, such as in Raman and Shahrur (Reference Raman and Shahrur2008). However, R&D spending may not be a suitable measure for relationship-specific investment; it only reflects the total firm-level R&D and does not differentiate between relationship-specific and general R&D, nor does it specify the investment directed toward a particular trading partner. To address these concerns, we follow Dasgupta et al. (Reference Dasgupta, Zhang and Zhu2021) and use the comovement of R&D spending between the supplier and customer to indicate the level of the supplier’s relationship-specific investment. If the supplier’s R&D spending is more sensitive to the customer’s R&D spending, we infer that the supplier is making investments more tailored to the customer. This implies that, if customers’ social capital increases suppliers’ relationship-specific investments, there should be stronger R&D comovement between suppliers and customers with higher social capital.
To test the above prediction, we estimate the following regression model:
 $$ {\displaystyle \begin{array}{c}R\&{D}_{i,t}={\gamma}_1{Customer\ Social\ Capital}_{j,t-1}+{\gamma}_2Customer\ R\&{D}_{j,t}\\ {}\hskip5em +{\gamma}_3{Customer\ Social\ Capital}_{j,t-1}\times Customer\ R\&{D}_{j,t}\\ {}\hskip-17em +{\mathbf{X}}^{\mathrm{\prime}}\unicode{x03D5} +{\mu}_i+{\nu}_t+{\varepsilon}_{i,t}.\end{array}} $$
The dependent variable R&D is the ratio of the supplier’s R&D expenses to total assets. The variables Customer Social Capital and Customer R&D measure the customer’s social capital and R&D (deflated by total assets). Our variable of interest is the interaction term of Customer Social Capital and Customer R&D. If customers’ social capital encourages supplier firms to undertake relationship-specific investments, the R&D of suppliers should co-move more strongly with high social capital customers than with low social capital ones. This implies that the coefficient of the interaction term, γ 3, should be positive. X is a vector of control variables that includes the same set of suppliers’ and customers’ characteristics as in our baseline regression, excluding R&D expenses. μi and νt are firm and year fixed effects, respectively.
Column 4 in Table 8 presents the results of the R&D comovement regressions. The coefficient estimate of customers’ R&D (Customer R&D) is positive and significant, implying a positive comovement between supplier and customer R&D investments. More importantly, the interaction term of Customer Social Capital and Customer R&D enters the regression positively and significantly, suggesting that firms’ R&D is more responsive to their customers’ R&D when the customers have higher levels of social capital. Again, the results echo our main findings using patent citation-based measures for relationship-specific investments.
4. Vertical Integration
Firms always face the make-or-buy decision, that is, whether to produce inputs in-house or purchase them from the marketplace. If a high social capital firm’s suppliers are less concerned about postcontractual opportunism and are more willing to make relationship-specific investments, the firm should have less incentive to vertically integrate than its low social capital peers.
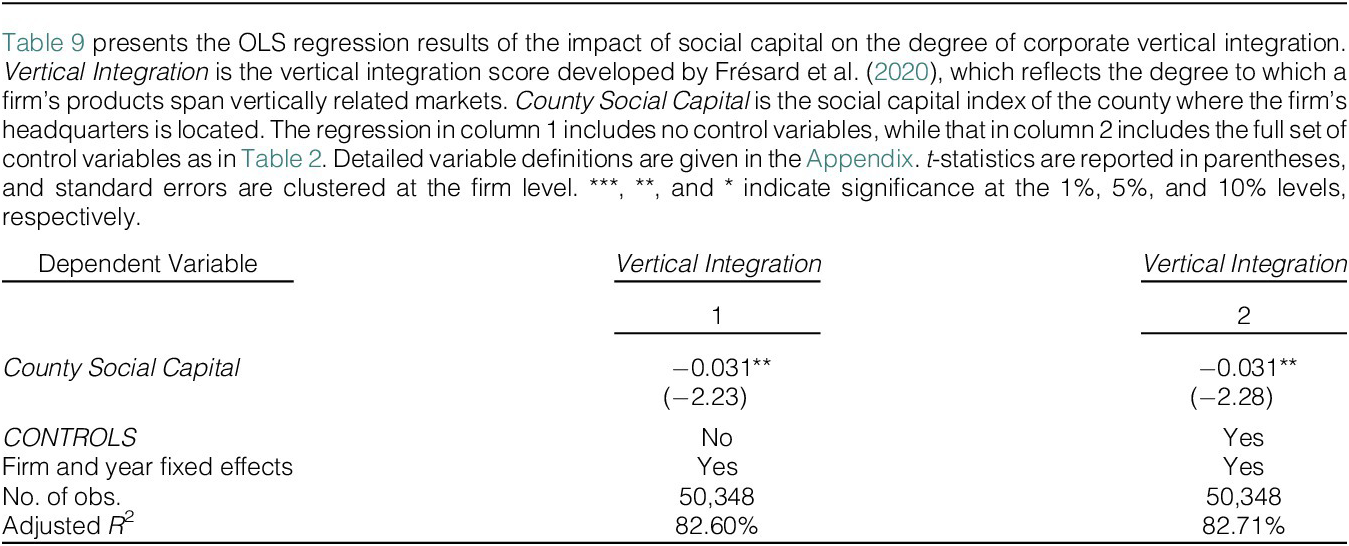
To test this prediction, we adopt the measure developed by Frésard, Hoberg, and Phillips (Reference Frésard, Hoberg and Phillips2020) to assess the extent to which firms’ products span vertically related markets. This measure maps product descriptions in firms’ 10-K filings to product vocabularies from the Bureau of Economic Analysis input–output tables, which report the vertical relatedness of any input–output commodity pairs.Footnote 15 Using this vertical integration measure as the dependent variable and the social capital measure as the main explanatory variable, our empirical analysis shows that high social capital firms are indeed less vertically integrated. The regression results are reported in Table 9.

Social capital not only affects a firm’s vertical integration decision but may also influence the formation of trading relationships. In supplementary analyses (untabulated), we divide our sample firms into high and low social capital groups based on the median social capital measure within their respective industries and years. We find that half of all observed significant customer–supplier relationships are between two high social capital firms, whereas only 8% are between two low social capital firms. This evidence reinforces the notion that high social capital firms can rely more on arm’s length transactions for inputs instead of resorting to vertical integration.
E. Robustness Tests
We conduct a battery of tests to ensure the robustness of our main findings. For brevity, we summarize these robustness checks here and present the full analyses in the Supplementary Material.
1. Instrumental Variable Estimation
Our cross-sectional tests, along with the evidence on the mechanism and the additional analysis, provide supporting evidence for the causal impact of customers’ social capital on suppliers’ relationship-specific investments, or at least severely restrict the set of plausible alternative explanations. To further address potential endogeneity concerns, we implement an instrumental variable approach using the customer firm’s distance to the U.S.-Canada border as an instrument for its social capital (Putnam (Reference Putnam2001), Hasan et al. (Reference Hasan, Hoi, Wu and Zhang2017a)). The estimation results confirm the positive impact of customer social capital on suppliers’ relationship-specific investments (Table OA1 in the Supplementary Material).
2. Alternative Measures
We verify that our results are robust to alternative variable constructions. First, instead of measuring relationship-specific investments using same-year cross-citations to customer patents, we use a 3-year citation window to account for potential lags between innovation and patenting. The results remain consistent (Table OA2, Test 1 in the Supplementary Material). Second, because county-level social capital data are available only in selected years, our baseline regressions use the most recent value to fill missing years. Using linear interpolation instead yields similar results (Test 2). Third, following Hasan et al. (Reference Hasan, Hoi, Wu and Zhang2017a), (Reference Hasan, Hoi, Wu and Zhang2017b), we use state-level organ donation rates from the Organ Procurement and Transplantation Network (OPTN) as an alternative social capital measure and find that this measure also predicts suppliers’ relationship-specific investments (Test 3).
3. Additional Controls
We further include several additional controls to mitigate the concern of omitted variable bias. i) We add suppliers’ own social capital to address the concern that cooperative firms may self-select into relationships with similar customers (Test 4). ii) We include the customer’s CSR performance, constructed from MSCI/KLD data, to mitigate concerns that socially responsible customers both locate in high-social-capital regions and encourage suppliers’ investments (Test 5). iii) To account for inter-firm ties, we control for geographic proximity and for social connections between executives and directors (Tests 6–7). iv) Because social capital may also increase customer innovation output, we control for the customer’s patent stock and patent-portfolio diversity (Test 8). v) Finally, to alleviate concerns that local economic conditions drive both social capital and opportunism, we add county-level median household income and unemployment rates (Test 9). Overall, these additional control variables do not affect our main finding that customer social capital positively influences suppliers’ relationship-specific investments.
4. Nonlinearity of the Relationship
We have documented a positive relationship between customers’ social capital and suppliers’ relationship-specific investments. A natural question is whether this relationship is homogeneous or nonlinear across the distribution of social capital. To do so, we replace the continuous social capital measure in the baseline regression with a set of dummy variables indicating different portions of the customers’ social capital distribution. The regression results point to a nonlinear pattern. Specifically, we find that relationship-specific investment increases from low to medium social capital and for high social capital, although the incremental effect is smaller at the upper end (Table OA3 in the Supplementary Material).
V. Conclusion
This study investigates the ability of social capital to mitigate opportunistic behavior in an arm’s-length supply chain relationship, thus influencing the boundaries of the firm. Customers located in communities with high social capital share the social norm that promotes cooperation (Guiso et al. (Reference Guiso, Sapienza, Zingales, Benhabib, Bisin and Jackson2011)) and suffer significant internal and external sanctions associated with behavior in conflict with that norm (Coleman (Reference Coleman1990), Knack and Keefer (Reference Knack and Keefer1997)). Thus, we argue that transacting with high social capital customers can reduce suppliers’ concerns about customers’ opportunism and the corresponding hold-up risks, enabling them to undertake more relationship-specific investments.
Our empirical analyses support the hypothesis that suppliers are more willing to make relationship-specific investments when dealing with customers located in high social capital communities. This finding is more pronounced in situations where suppliers would otherwise be most concerned about being expropriated: when suppliers are in relatively weak bargaining positions, have high asset specificity, or trade with financially weak customers. We show direct support of the assumption that high social capital customers behave cooperatively and with a long-term view: such customers maintain business relationships with their suppliers over a longer time span and are less likely to pass on negative economic shocks to them.
Further analyses show that customer firms’ social capital is positively associated with the technological proximity between suppliers and customers, the fraction of suppliers’ patents that are nontradable, and the sensitivity of suppliers’ R&D investment to that of customers. These results strengthen our baseline findings that supplier firms tend to make more relationship-specific investments when transacting with high social capital customers. In addition, we find that high social capital firms are less likely to vertically integrate and more likely to establish trading relationships with each other.
Previous studies on social capital mainly investigate its influence from a macroeconomic perspective (e.g., Knack and Keefer (Reference Knack and Keefer1997), Guiso et al. (Reference Guiso, Sapienza and Zingales2004)) or from the viewpoint of individual firms (e.g., Jha and Chen (Reference Jha and Chen2015), Hasan et al. (Reference Hasan, Hoi, Wu and Zhang2017a), (Reference Hasan, Hoi, Wu and Zhang2017b), Hoi et al. (Reference Hoi, Wu and Zhang2019)). Our study sheds new light on the role of social capital by examining its impact on the supply chain, an inter-organizational relationship, and hence the boundaries of the firm. We also offer a novel dimension to the supply chain literature by identifying social capital originating outside a given relationship as an important informal institution that mitigates the hold-up problem and reduces the deadweight losses arising from the lack of mutual trust.
Appendix. Variable Definitions
Dependent Variables
- Supp Cites Cust:
-
A dummy variable that equals 1 if patent applications filed (and eventually granted) by the supplier firm cite a specific customer firm’s patents in a given year, and 0 otherwise.
- # of Supp Cites:
-
The total number of citations made by the supplier firm’s patent applications filed (and eventually granted) toward a specific customer’s patent portfolio in a given year.
Main Explanatory Variable
- Customer Social Capital:
-
Social capital index in the county where the customer firm’s headquarters is located. The data used to construct social capital are collected from the website of the Northeast Regional Center for Rural Development (NRCRD) at the Pennsylvania State University.
Control Variables
- Sales to Customer:
-
Sales made to a customer (salecs) divided by the firm’s total sales (sale).
- Size:
-
Logarithm of total assets (at).
- Leverage:
-
Long-term debts (dltt) plus debt in current liabilities (dlc) divided by total assets (at).
- MTB:
-
Market value of total assets (prcc_f × csho + at-ceq) divided by book value of total assets (at).
- Tangibility:
-
Total fixed assets (ppent) divided by total assets (at).
- ROA:
-
EBITDA, earnings (ib) before interest expense (xint), tax (txt), depreciation and amortization (dp), divided by lagged total assets (at).
- R&D:
-
Research and development expense (xrd) divided by lagged total assets (at); missing values are set as the industry median.
- CAPEX:
-
Capital expenditure (capx) divided by lagged total assets (at).
- HHI:
-
Herfindahl–Hirschman index, defined as the sum of squared market shares of firms in the same industry, is calculated using the refined text-based network industry classifications (TNIC) from Hoberg and Phillips (Reference Hoberg and Phillips2025).
- HHISQ:
-
Square of the Herfindahl–Hirschman index of the firm’s industry.
- Customer Size:
-
Customer’s size, where size is the logarithm of total assets (at).
- Customer Leverage:
-
Customer’s leverage, where leverage is the value of long-term debts (dltt) plus debt in current liabilities (dlc) divided by total assets (at).
- Customer ROA:
-
Customer’s return on assets, where return on assets is measured as EBITDA divided by lagged total assets (at).
- Customer R&D:
-
Customer’s R&D expenses (xrd) divided by lagged total assets (at); missing values are set as the industry median.
Funding Statement
Xing Li acknowledges financial support from the National Natural Science Foundation of China (No. 72302180) and the China Postdoctoral Science Foundation (Nos. 2025T180187 and 2021M692542). Jiaren Pang acknowledges financial support from the National Natural Science Foundation of China (No. 72173070). Wu acknowledges financial support from City University of Hong Kong.
Supplementary Material
To view supplementary material for this article, please visit http://doi.org/10.1017/S0022109026102798.


 Open access

