Introduction
The preservation and exploitation of livestock biodiversity is becoming an important issue in animal science (Miraglia et al., Reference Miraglia, Saastamoinen and Martin-Rosset2006; Fleurance et al., 2007). In some Mediterranean countries, many equine breeds exist that occupy special niches and contribute to safeguarding the biodiversity, thanks to their own genetic characteristics coming from adaptation mechanisms developed through centuries of evolution. These endangered equine autochthonous populations need to be re-evaluated, because they contribute to the exploitation of marginal areas and to the environmental safeguard too. Few autochthonous equine populations are still bred in Italy and, between them, some wild horses, located in the Molise region (Montenero Valcocchiara, Isernia district), that are named ‘Pentro horses’ and that have recently been included in the list of endangered horse populations (Ministero delle Politiche Agricole e Forestali – MIPAF-, 2003). Previous papers (Lucchese, Reference Lucchese1995; Miraglia et al., 1999, 2001, 2002 and 2005; Iamartino et al., 2004) showed the genetic characteristics of these horses, the zootechnical practices and the environmental aspect of the areas concerning vegetation and forage production. The breeding area includes a broad plane surrounded by wooden hills characterised by the presence of pet-bog residue, an extremely rare feature in the Apennine area, and by some rare plants such as Salix pentandra and Dactyloriza incarnata (Lucchese, Reference Lucchese1995). For this reason the area has been included in the ‘Corine Biotope list.’
The presence of an endangered equine population in this special area needs particular attention to limit possible problems of compatibility between grazing and the rare plants (Miraglia et al., 2001; Carrère, 2007).
Previous studies (Duncan, Reference Duncan1983 and Reference Duncan1992; Putman et al., Reference Putman, Pratt, Ekins and Edwards1987; Moulin, Reference Moulin1997; Cosyns et al., Reference Cosyns, Degezelle, Demeulenaere and Hoffmann2001; Fleurance et al., Reference Fleurance, Duncan and Mallevaud2001; Menard et al., Reference Menard, Duncan, Fleurance, Georges and Lila2002; Lamoot et al., Reference Lamoot, Vandenberghe, Bauwens and Hoffmann2005; Morhain et al., 2007) reported the influence of seasonality and vegetation features on the grazing behaviour of horses in temperate regions, but little information exist about the exploitation of natural pastures characterised by low-quality forages, often typical of Mediterranean areas (Thériez et al., Reference Thériez, Petit and Martin-Rosset1994; Edouard and Fleurance, 2007; Fleurance et al., 2007).
This paper is the result of a long-term programme of research, carried out over a 2-year period, concerning the valorisation of the area in relation to safeguarding the horse population and to the environment to prevent pasture and soil degradation. It is necessary to preserve, on the one hand, some rare botanical species and, on the other hand, the endangered Pentro horses (Miraglia et al., 2001).
The aim of this research was to evaluate over a 2-year period the availability and the nutritional characteristics of the pasture in order to meet horse requirements and to plan a correct stocking rate to avoid pasture degradation, to improve the management of the herd and to balance the ratio between horses and vegetation.
Materials and methods
Environmental conditions, vegetation and sampling areas
The breeding area (total area 2200 ha), sited in the Molise region (Montenero Valcocchiara, Isernia district), is a natural pasture located between 800 and 900 m of altitude, which includes a broad flat land surrounded by wooden hills.
The climate of the region is cool Mediterranean, with a mean annual temperature of 11.9°C, ranging between 3.6°C in January and 21.1°C in July. The monthly rainfall data were taken at a rain gauge station located close to the breeding area.
The flora was completely identified through continuous examination of the area throughout the experimental period. The examination of the vegetation was conducted using the Brown-Blanquet phytosociological method (Brown-Blanquet, Reference Brown-Blanquet1932), which made it possible to identify the most relevant vegetation units. We applied some measures to determine the better way of interventions for the protection of two very rare populations: D. incarnata, an orchid that is at risk of extinction in the Apennine area, and S. pentandra, a species of willow that in the whole Apennine area is present only in two other regions (Lazio and Abruzzo) other than in this plane.
The presence of many species has been pointed out in the grazing meadow system. The dominant species, usually linked to livestock presence, include Lolium perenne, Cynosorus cristatus, Poa pratensis, Phleum pratense, Anthoxanthum odoratum, Alopecurus rendlei among Gramineae (Poaceae) and Trifolium repens, Trifolium pratense, Lotus corniculatus among Legume (Fabaceae). These two families represent 80% of all species observed, with a clear prevalence of Gramineae, helped by the annual mowing. In the pasture system, some species are outlined for the grazing meadow system, but with a smaller prevalence of Gramineae than Legume and, moreover, a large presence of weeds, among which the most typical are Juncus articulatus and Ranunculus acris.
The forage samples were collected over a 2-year period (2000 to 2001) from five experimental areas that represent the prevalent land typology previously identified by specialists in planning the experimental procedure. Two of these areas, P1 (ca. 175 ha) and P2 (ca. 216 ha), were placed in the part of the land destined to grazing only (pasture system); these two areas were characterised by the presence of a pet-bog residue and by the rare plants previously described such as S. pentandra and D. incarnata (Lucchese, Reference Lucchese1995). The other three sampling areas, G1 (ca. 398 ha), G2 (ca. 94 ha) and G3 (ca. 94 ha), were placed in an area that was grazed only from July till April because of the hay production in this part of the plane (grazing meadow system). The sampling technique referred to the Corral and Fenlon method (Corrall and Fenlon, Reference Corrall and Fenlon1978). The experimental patches of each area (10 m2) were divided into two groups of three patches of 0.5 m2 each. They were alternatively mowed every 2 weeks with a regeneration time of 28 days. The mowing started at the beginning of the vegetative activity (May) for the pasture system and after harvesting (July) for grazing meadow system; it ended in October, with the vegetative fallow.
Animals
The Pentro horses (28 barren mares, 112 lactating mares, 30 young horses of 1 to 2 years old and 80 foals of 4 to 6 months old) spent most of their time in the land from the beginning of the vegetative activity, corresponding to spring time (April/May) till October because of the considerable availability of forage. The spatial behaviour of the horses were observed 2 days/week all over the year to determine the time spent in the land and in the hills. From November to April, the horses move to the surrounding hills because of the abundant overflow of the land. In this period, they satisfy their nutrient requirements from the copious deciduous wood and shrubby vegetation and come to the plane only for water. A part of the land is managed using the grazing meadow system, which includes a first cut of hay followed by grazing. But the hay production is never destined to horses but to dairy cows that are bred close to the land. Herds are kept wild all throughout the year and no support (food supplies or health care) is provided. At present, foals are sold mainly for meat production. In recent years, the Molise region passed a by-law for Pentro horses that provides money to the breeders to safeguard mares, foals and yearlings.
The requirements of the herd have been calculated according to the Institut National de la Recherche Agronomique (INRA) systems (Martin-Rosset et al., Reference Martin-Rosset, Vermorel, Doreau, Tisserand and Andrieu1994) and INRA recommendations (INRA, 1990).
Chemical analyses and nutritive value
Whole-plant samples were immediately dried in a forced-draft oven to constant weight at 65°C to determine the dry matter (DM) content and were then air equilibrated, ground in a Cyclotec mill (Tecator, Herndon, VA, USA) to pass a 1 mm screen and stored for later analyses. Dried samples were analysed to determine total N content (Association of Official Analytical Chemists (AOAC), 2004) ash by ignition to 550°C, crude fibre (CF) according to the Weende method, neutral-detergent fibre (NDFom) without sodium sulphite and α-amylase, and acid-detergent fibre (ADFom) as described by Van Soest et al. (Reference Van Soest, Robertson and Lewis1991) expressed exclusively of residual ash, acid-detergent lignin (ADL) determined by solubilisation of cellulose with sulphuric acid as described by Robertson and Van Soest (Reference Robertson and Van Soest1981), and gross energy (GE) by means of an adiabatic calorimeter bomb (IKA C7000, Staufen, Germany). The nutritive value, expressed in horse feed units (HFU), was determined by regression equation (Martin-Rosset and Vermorel, 2002), using crude protein (CP) and CF percentage. The monthly productions of DM, HFU and horse-digestible crude protein (HDCP) referred to the vegetative season (May to October) were determined and compared with the total nutrient requirements of the herds increased by 20% quota because of the considerable daily physical activity (INRA, 1990; Martin-Rosset et al., Reference Martin-Rosset, Vermorel, Doreau, Tisserand and Andrieu1994).
Statistical analyses
Data were analysed by one-way two-factor ANOVA, using month, area and their interaction as factors. The Bonferroni t-test was used for mean comparisons, and the level of significance (α) was set at 0.05. Before statistical analysis, data were examined for normality and variance equality. In cases of unequal variance, the transformed (logarithmic) data were analysed to confirm the conclusions. All analyses were conducted using Statistical Package for the Social Sciences (SPSS) program (release 12.0.1, copyright© SPSS Inc., Chicago, IL, USA, 1989–2003).
Results and discussion
Vegetation and environmental conditions
A total of 265 botanical species have been found; among them, the greatest interest for their rarity in Central Apennine and the Molise region are Caltha palustris, Catabrosa aquatica, D. incarnata, Eleocharis uniglumis, Epipactis palustris, Phragmites communis, Iris pseudacorus, Juncus inflexus, J. articulatus, Juncus subnodulosus, Lysmachia nummularia, Menyanthes trifoliata, Myosotis caespitosa, Myosotis scorpioides, Myosotis sicula, Oenanthe fistulosa, R. acris, S. pentandra, Teucrium scordium, Thalictrum simplex, Veronica scutellata. Two species (Bidens cernua, Potentilla erecta) result to be new for the Molise flora. Of these species about 10% are rare, while 7% are protected species. Another distinction shows the presence of a numerous group of spiny species (64%) and poisonous species (25%) as a probable result of overgrazing verified some years ago depending on a higher concentration of horses and bovines.
The Brown-Blanquet phytosociological method permitted to identify the following principal vegetation units: (1) populations of arid grasses with the prevalence of Bromus erectus and Sideritis syriaca, (2) aquatic sheltering populations of Sparganium erectum in the channels, (3) aquatic populations of submersed vegetation with Callitriche stagnalis, (4) aquatic populations of the springs with Nasturtium officinale, (5) sheltering willow populations of Salix alba, (6) populations of wet grasses (cut meadows) with Glyceria plicata and Alopecurus utriculatus, (7) populations of wet grasses (pasture) with J. articulatus and R. acris and (8) population of infesting vegetation with Urtica dioica and Onopordum acanthium.
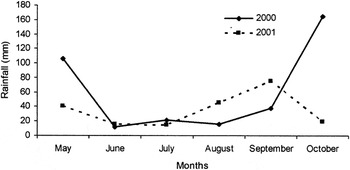
Figure 1 shows the monthly rainfall trend over 2 successive years; in spring and autumn periods the rainfall was abundant, while the water scarcity occurred from June to September. The comparison between the 2 years shows that the most important differences occurred in this period, when water use was highest. In the first year, in fact, from June to September the rainfall recorded was 85.2 mm, while in the second year it was 150.4 mm. Therefore, in 2000 meadow grass suffered a greater water scarcity; besides, in the first year this trend is more distinct and also areas’ means are greater than in the second one, confirming a water deficit in the first year. The differences among the areas could be due to the different draining capacity of the soil and due to the different management of the grazing land: in the pasture system the average DM content and the monthly variations are lower than in the grazing meadow system. This is probably due to the greater impoverishment of water reserves in the grazing meadow system before harvesting and due to the stress caused by mowing. Particularly, it is important to underline that the considerable water deficit of the first year increased the differences among the areas, while the high water availability of the second year decreased them.
Rain gauge records over the 2 years.

Chemical composition and total production of the pasture
Months effect in the year
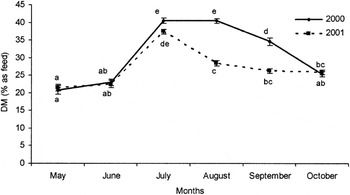
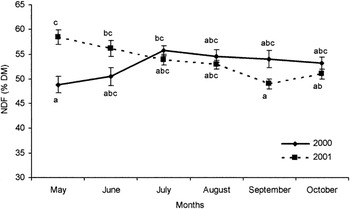
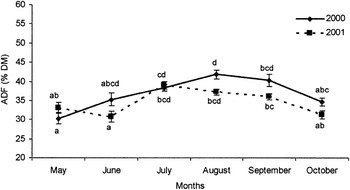
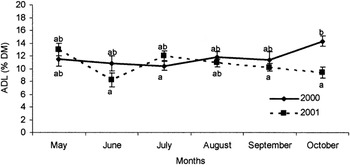
Figures 2–7 show the comparison between the average values of DM, CP, CF, NDF, ADF and ADL referred to the 2 years. In both years, there was a progressive increase of DM content (Figure 2) in the summer period and a decrease in the autumn period. Available data (Catalano and Miraglia, 1985 and Reference Catalano and Miraglia1986; Catalano et al., Reference Catalano, Miraglia, Martuzzi and Blanco1989) support this trend. In the case of OM, in 2000 there were no significant differences among the months, while in 2001 there were significant differences only between May and July, with higher organic matter (OM) content in July (88.5% in May v. 91.4% in July) than in other months. These data confirm that OM is not a good indicator of nutritive value and that the natural pastures in marginal areas have specific characteristic highly influenced by the environmental factors (Catalano and Miraglia, Reference Catalano and Miraglia1986; Catalano et al., Reference Catalano, Miraglia, Martuzzi and Blanco1989).
Dry matter (DM, % as feed) content of the whole pasture (mean value ± s.e.) over the 2 years. a–e Values with different superscripts are significantly different at P < 0.05.

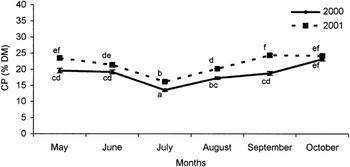
Crude protein (CP, % DM) content of the whole pasture (mean value ± s.e.) over the 2 years. a–f Values with different superscripts are significantly different at P < 0.05.

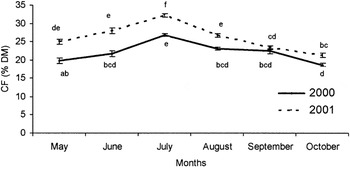
Crude fibre (CF, % DM) content of the whole pasture (mean value ± s.e.) over the 2 years. a–f Values with different superscripts are significantly different at P < 0.05.

Neutral-detergent fibre (NDF, % DM) content of the whole pasture (mean value ± s.e.) over the 2 years. a–c Values with different superscripts are significantly different at P < 0.05.

Acid-detergent fibre (ADF, % DM) content of the whole pasture (mean value ± s.e.) over the 2 years. a–d Values with different superscripts are significantly different at P < 0.05.

Acid-detergent lignin (ADL, % DM) content of the whole pasture (mean value ± s.e.) over the 2 years. a,b Values with different superscripts are significantly different at P < 0.05.

In the case of CP (Figure 3), the seasonal effect on determined averages is important. There is evidence of a decrease during the hot weather and then a recovery of the values in autumn. CP content is significantly higher in 2001 than in 2000. The observed values are close to those reported in the literature (Catalano and Miraglia, Reference Catalano and Miraglia1986).
Figures 4–7 report CF and fibrous fraction (NDF, ADF and ADL) contents, respectively. Monthly means of CF and ADF content increase till July and then decreased in both years, whereas the variation of CP content is opposite, which is consistent with the general knowledge of the variation of the chemical composition of forage with the vegetative season. NDF decreases continuously while the variation of ADL is limited and not linked to the influence of the season. The observed values for the different fibrous fractions agree with the data available in the literature (Catalano and Miraglia, Reference Catalano and Miraglia1986), ADL values are on average higher, but they are still acceptable due to the environmental conditions.
The GE content of the pasture does not show any clear seasonal trend and confirms that this parameter is not a good indicator of nutritive value as in the case of OM. The outcome is comparable to available data in some Mediterranean forages (Peiretti, Reference Peiretti2005).
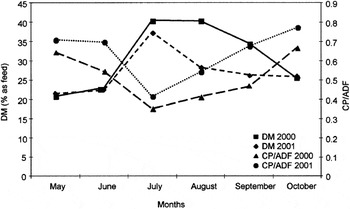
The chemical components that are the most affected by season, area and different pasture leading system effects are DM, CP and ADF contents during the pasture period. As a result, the nutritive value of pasture is influenced, because it is positively related to the CP content and negatively to the ADF content (Duncan, Reference Duncan1992; Martin-Rosset et al., Reference Martin-Rosset, Loiseau and Molénat1981); in fact, during decreasing of CP content between May and August, a reduction of 6.5% and 14.5% was also observed for HFU and HDCP (average values over the 2 years), respectively. The comparison between DM percentage and CP/ADF ratio is reported in Figure 8: during the summer period, DM content increases while the CP/ADF ratio decreases. As a result, the DM content could be a relevant predictor of the nutritive value of grass in a natural pasture.
Comparison between dry matter (DM, % as feed) and crude protein (CP)/acid-detergent fibre (ADF) ratio (average values of the five areas) over the 2 years.

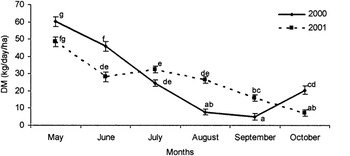
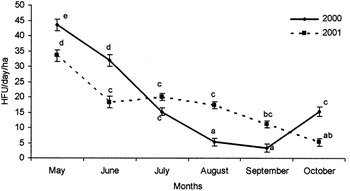
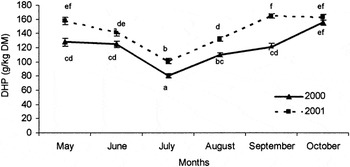
DM, HFU and HDCP production is low and decreases (Figures 9, 10 and 11, respectively) from early spring to autumn except for CP, which rises in the late summer and autumn. Our data are comparable with those observed in similar conditions (Catalano and Miraglia, Reference Catalano and Miraglia1986; Catalano et al., Reference Catalano, Miraglia, Martuzzi and Blanco1989). Most part of the evolution is explained by the variation of climatic conditions during the vegetative season and the different years.
Dry matter (DM, kg/day per ha) production of the whole pasture (mean value ± s.e.) over the 2 years. a–g Values with different superscripts are significantly different at P < 0.05.

Horse feed units (HFU per day per ha) production of the whole pasture (mean value ± s.e.) over the 2 years. a–c Values with different superscripts are significantly different at P < 0.05.

Horse-digestible crude protein (DHP, g/kg DM) production of the whole pasture (mean value ± s.e.) over the 2 years. a–f Values with different superscripts are significantly different at P < 0.05.

System effect
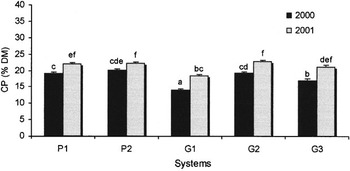
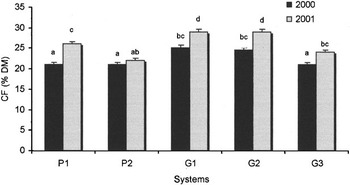
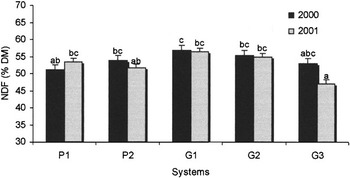
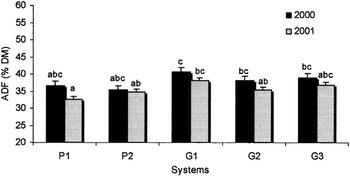
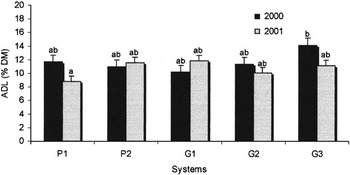
Figures 12–17 show some differences regarding the system effect on the composition of DM, CP, CF, NDF, ADF and ADL. There is significant effect of the management system on DM CF and CP content, likely due to the diversity of plant species in the two types of areas. The differences between the areas are more marked in the first year than in the second; this is probably linked to the greater drought in the first year that could have favoured the increase in weeds that are extremely xerophytic (non-water-loving) and have a lower protein content.
Dry matter (DM, % as feed) content of the pasture (P1 and P2) and of the grazing meadow systems (G1, G2 and G3) over the 2 years (mean value ± s.e.). a–f Values with different superscripts are significantly different at P < 0.05.

Crude protein (CP, % DM) content of the pasture (P1 and P2) and of the grazing meadow systems (G1, G2 and G3) over the 2 years (mean value ± s.e.). a–f Values with different superscripts are significantly different at P < 0.05.

Crude fibre (CF, % DM) content of the pasture (P1 and P2) and of the grazing meadow systems (G1, G2 and G3) over the 2 years (mean value ± s.e.). a–d Values with different superscripts are significantly different at P < 0.05.

Neutral-detergent fibre (NDF, % DM)) content of the pasture (P1 and P2) and of the grazing meadow systems (G1, G2 and G3) over the 2 years (mean value ± s.e.). a–c Values with different superscripts are significantly different at P < 0.05.

Acid-detergent fibre (ADF, % DM)) content of the pasture (P1 and P2) and of the grazing meadow systems (G1, G2 and G3) over the 2 years (mean value ± s.e.). a,b Values with different superscripts are significantly different at P < 0.05.

Acid-detergent lignin (ADL, % DM)) content of the pasture (P1 and P2) and of the grazing meadow systems (G1, G2 and G3) over the 2 years (mean value ± s.e.). a,b Values with different superscripts are significantly different at P < 0.05.

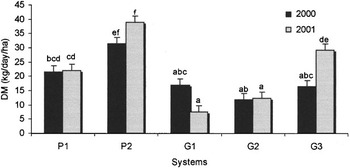
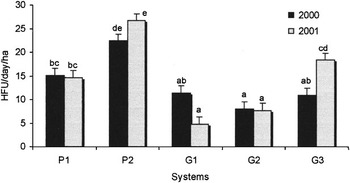
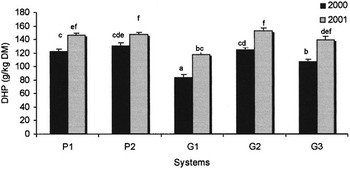
Differences are consistent also considering the different productions of the areas (Figures 18–20): DM, HFU and HDCP productions of the pasture system are on average higher than those of the grazing meadow systems. The differences between the two areas of pasture systems are probably due to the considerable water availability of the P2 area, because it is close to a hill torrent.
Dry matter (kg/day per ha) production of the pasture (P1 and P2) and of the grazing meadow systems (G1, G2 and G3) over the 2 years (mean value ± s.e.). a–f Values with different superscripts are significantly different at P < 0.05.

Horse feed units (HFU per day per ha) production of the pasture (P1 and P2) and of the grazing meadow systems (G1, G2 and G3) over the 2 years (mean value ± s.e.). a–d Values with different superscripts are significantly different at P < 0.05.

Horse-digestible crude protein (HDCP, g/kg DM) production of the pasture (P1 and P2) and of the grazing meadow systems (G1, G2 and G3) over the 2 years (mean value ± s.e.). a–f Values with different superscripts are significantly different at P < 0.05.

Nutritive value of the pasture
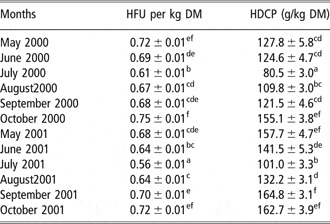
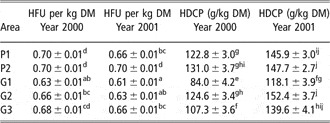
The HFU and HDCP values (Table 1) of the pasture are high but close to a similar environment (Catalano and Miraglia, Reference Catalano and Miraglia1986; Catalano et al., Reference Catalano, Miraglia, Martuzzi and Blanco1989). HFU and HDCP outcomes show a clear decrease during the driest period (July and August) in both the years: 13% and 28%, respectively. For HDCP, the differences are higher in the second year (2001). The HFU and HDCP of the pasture system P1 and P2 are on average higher: 6% and 12% than those observed in the grazing meadow systems (G1, G2, G3) (Table 2).
Comparison between the average values ± s.e. of net energy (horse feed units (HFU) per kg dry matter (DM)) and horse digestible horse protein (HDCP) (g/kg DM) over the different months in the 2 years

a–fValues within column with different superscripts are significantly different at P < 0.05.
Comparison between the average values ± s.e. of net energy (horse feed units (HFU) per kg dry matter (DM)) and horse digestible crude protein (HDCP) (g/kg DM) referred to the systems pasture (P1 and P2) and grazing meadows (G1, G2 and G3) over the 2 years

a–dValues within column and row with different superscripts are significantly different at P < 0.05.
e–jValues within column and row with different superscripts are significantly different at P < 0.05.
Requirements and stocking rates
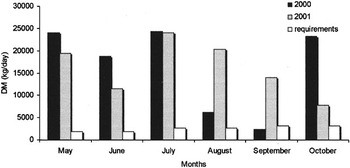
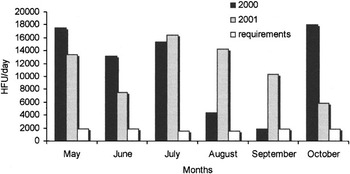
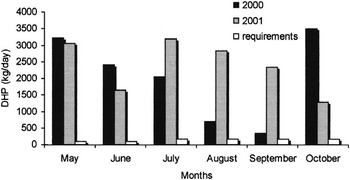
The total daily nutrient requirements of the herd for DM, HFU and HDCP (INRA, 1990; Martin-Rosset et al., Reference Martin-Rosset, Vermorel, Doreau, Tisserand and Andrieu1994) are compared with the total grass production in the 2 years (Figures 21–23). The requirements increased progressively from May till September because of the physiological changes of the mares with pregnancy and lactation status and because of the increase in the foals’ nutrient requirement as well. In this period, the DM and HFU requirements increased from 18% to 26% while the DHP requirements increased from 23% to 28%.
Total dry matter (DM, kg/day) production over the 2 years and DM requirements of the herd (INRA, 1990; Martin-Rosset et al., Reference Martin-Rosset, Vermorel, Doreau, Tisserand and Andrieu1994).

Total horse feed units (HFU per day) production over the 2 years and HFU requirements of the herd (INRA, 1990; Martin-Rosset et al., Reference Martin-Rosset, Vermorel, Doreau, Tisserand and Andrieu1994).

Horse-digestible crude protein (HDCP, kg/day) production over the 2 years and HFU requirements of the herd (INRA, 1990; Martin-Rosset et al., Reference Martin-Rosset, Vermorel, Doreau, Tisserand and Andrieu1994).

The limited available pasture surface in the period from May to June is compensated by the highest production, and the following decrease of production due to dryness is balanced by the increase of the pasture surface (after harvesting, from July onwards). However, in the case of long drought, forage yield did not meet the horse requirements, as it did in August and, particularly, in September 2000. Therefore, the most important limiting factor to satisfy the nutrient requirements is the water availability in the summer months. The total nutrient requirements of the herd are met as the apparent body condition of mares and foals is good in October because the stocking rate is low: 0.6 head per ha from April to June and 0.3 head per ha from July to October. Hence the pasture can sustain the present stocking rate; however, in case of limited rainfall in the summer months, grass production could be inadequate at the short term and the considerable differences of grass production from one year to another might not entirely be balanced by the low stocking rate values.
Conclusions
Conflicts between horse grazing and high-vulnerability plants could arise where the preservation of some rare botanical species and endangered population of breed such as Pentro horses species is increasingly concerned in the same fragile area. It arises from our study that a compromise is met if the stocking rate is limited and monitored. But the system is very fragile as it is highly dependent on yearly rainfall, mainly in the summer period. The horse population might be increased slightly as there is in our situation the facility to balance the system feeding horses with extra surface at the expense of hay harvest on very close improved surface. Such management has been already experimented by others (Martin-Rosset et al., Reference Martin-Rosset, Loiseau and Molénat1981). A relevant monitoring of the pasture, using botanical, DM, CP/ADF indicators, is then necessary to control the weeds diffusion in areas submitted to low grazing or to prevent compaction problem and degradation of the vegetative cover from high grazing, particularly during the hot weather.
The necessity to preserve both Pentro horses and the rare and vulnerable plant species of the area needs the creation of inaccessible areas to animals or the application of particular methods so that the pasture could match the compromise between the necessity to preserve both Pentro horses and the rare and vulnerable plant species in this fragile area. A partial grazing exclusion could involve the areas of diffusion of orchids (conservation in situ); other orchid-safeguard techniques involve the culture of some plants in a protected area near the land (conservation ex situ), with the successive transplant of individuals with the aim of reinvigorating the population of the land, whenever this undergoes a drastic reduction.
Our data are a contribution to the definition of natural park with a safeguard design and strategy for horses and plants that might match with the improvement of the whole system.
Acknowledgements
Research carried out with Molise region contribution (POP Molise 1994/99). All the authors contributed equally to the work described in this paper.