


Introduction
Snow-accumulation rates on the Antarctic ice sheet are known to be highly variable over short distances (e.g. Reference Black and BuddBlack and Budd, 1964; Reference Gow and RowlandGow and Rowland, 1965; Reference WhillansWhillans, 1975; Reference Richardson, Aarholt, Hamran, Holmlund and IsakssonRichardson and others, 1997; Reference Richardson and HolmlundRichardson and Holmlund, 1999; Reference Vaughan, Bamber, Giovinetto, Russell and CooperVaughan and others, 1999b) and over short time intervals (e.g. Reference Mosley-ThompsonMosley-Thompson and others, 1995; Reference KaspariKaspari and others, 2004). However, accumulation rates in Antarctica are not well characterized, because they have only been assessed using compilations of widely spaced point measurements and low-resolution (∼25 km) passive microwave data (e.g. Reference Vaughan, Corr, Doake and WaddingtonVaughan and others, 1999a; Reference Giovinetto and ZwallyGiovinetto and Zwally, 2000), which do not capture the full range of accumulation variability, and may not produce an accurate spatial mean (e.g. Reference Richardson, Aarholt, Hamran, Holmlund and IsakssonRichardson and others, 1997; Reference Richardson and HolmlundRichardson and Holmlund, 1999). This observation has important implications for studies of ice-sheet mass balance and sea-level rise, because snow accumulation is a key quantity for mass-balance calculations (e.g. Reference Shabtaie and BentleyShabtaie and Bentley, 1987; Reference Hamilton, Whillans and MorganHamilton and others, 1998; Reference Wingham, Ridout, Scharroo, Arthern and ShumWingham and others, 1998; Reference Joughin and TulaczykJoughin and Tulaczyk, 2002; Reference Rignot and ThomasRignot and Thomas, 2002).
The objectives of this study are to develop a better understanding of the spatial distribution of snow accumulation on the West Antarctic plateau, to investigate how topography and ice flow influence measurements of accumulation rate, and to examine the spatial persistence of temporal variations observed in accumulation records. To address these issues, accumulation rates are derived from ground-penetrating radar (GPR) profiling of firn stratigraphy (Reference Arcone, Spikes, Hamilton and MayewskiArcone and others, 2004) and dated ice cores (Reference Dixon, Mayewski, Kaspari, Sneed and HandleyDixon and others, 2004). The results are interpreted using elevation data from global positioning system (GPS) surveys (Reference Hamilton and SpikesHamilton and Spikes, 2003). We demonstrate that the continuous reflections identified in this particular 400MHz radar profile have an isochronal accuracy of <1 year when dated and traced between ice-core sites. This result justifies the use of these horizons for determining the spatial distribution of historical accumulation rates.
Study Area
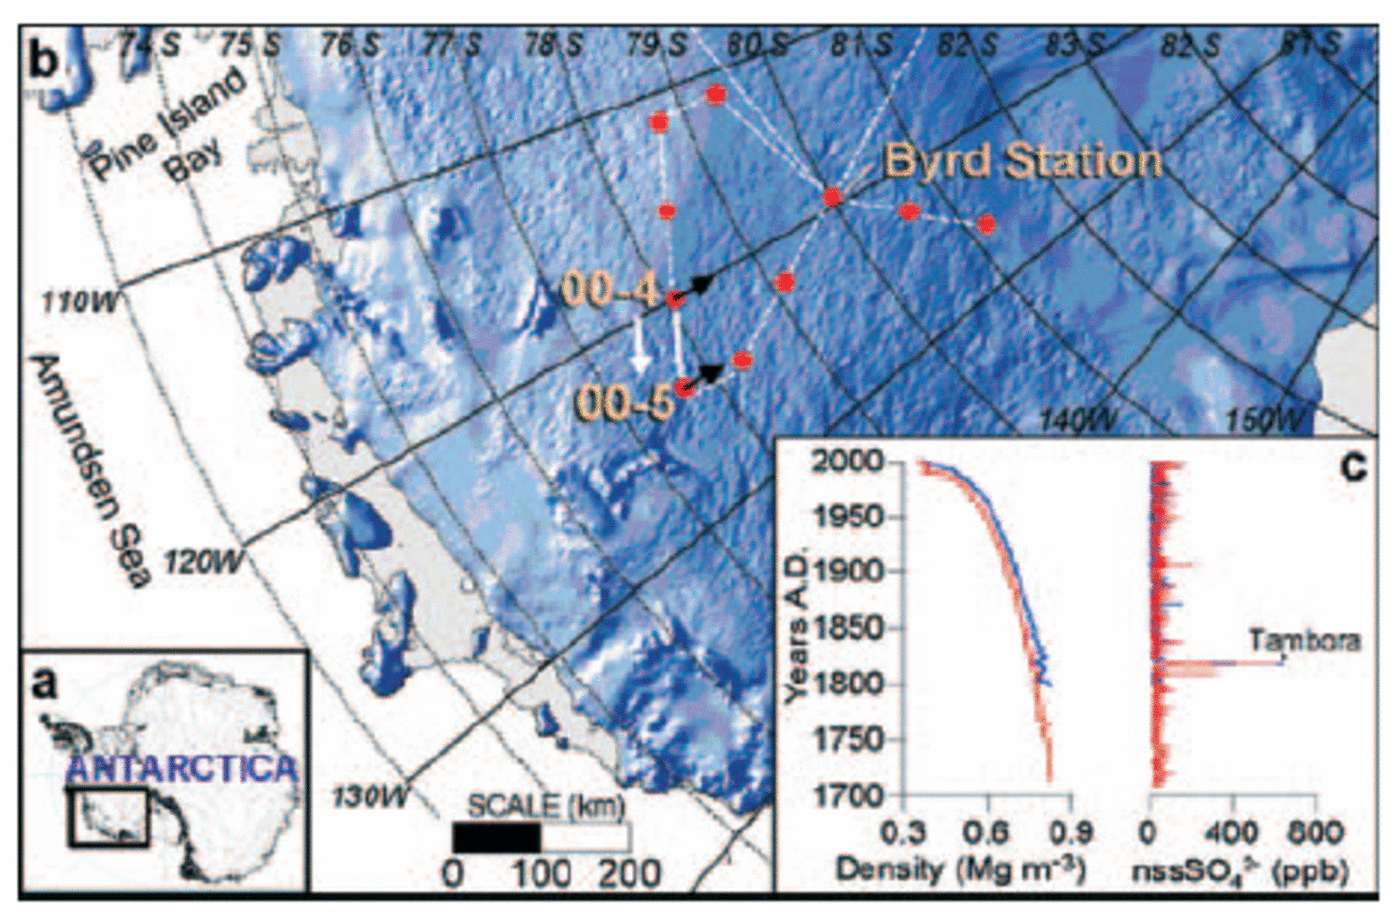
The data described here were collected in December 2000 along a 100 km transect across the West Antarctic ice sheet (WAIS) and represent a small portion of the data collected during the United States component of the International Trans-Antarctic Scientific Expedition (US ITASE) (Fig. 1). The GPR and GPS data were collected while traveling (azimuth of 290˚) between two ice-core sites, 00-4 to 00-5 (Fig. 1b). This transect is located >400km from open water and is situated near the ice divide that separates the Ross and Amundsen Sea drainage basins. Based on elevation contours from a digital elevation model (Reference Liu, Jezek and LiLiu and others, 1999), ice flows across this transect at an azimuth of ∼180˚, which is nearly perpendicular (∼20˚ from normal) to the orientation of the profile (Fig. 1b). Estimated ice thickness in this region exceeds 2000 m (Reference Lythe and VaughanLythe and others, 2000). According to Reference Tzeng, Bromwich and ParishTzeng and others (1993), the winds in this region are katabatic, or gravity-driven, and are therefore approximately parallel to the direction of ice flow. The net elevation difference between 00-4 and 00-5 is 140 m. A discussion of the source for and mechanisms of precipitation in this region is presented in a related paper by Reference KaspariKaspari and others (2004).
Location maps and ice-core data. (a) Continent-scale map of Antarctica. (b) Portion of West Antarctica (boxed region in (a)) showing some of the US ITASE traverse routes (white lines). Red circles indicate where ice cores were collected. The solid white line represents the transect along which the radar profile was collected between 00-4 and 00-5. The white arrow indicates the direction of travel during data acquisition. The shaded relief map was generated from a digital elevation model (Reference Liu, Jezek and LiLiu and others, 1999), which was also used to estimate ice-flow directions at 00-4 and 00-5 (black arrows). (c) Ice-core density and chemistry (nssSO4 2–) profiles for 00-4 (blue) and 00-5 (red).
Simplifying the Radar Pulse
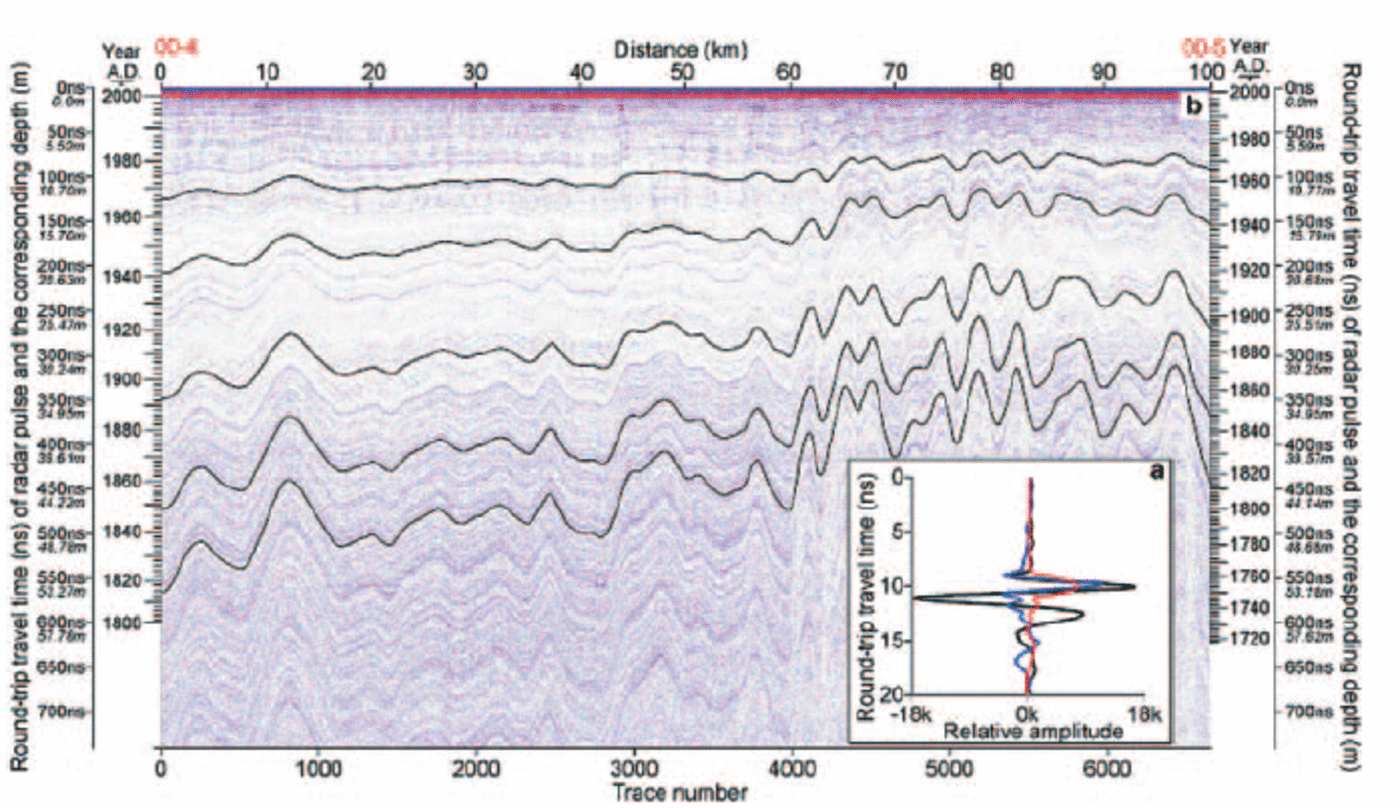
A 400 MHz short-pulse radar system that radiates a 1.5-cycle pulse (Fig. 2a) lasting about 3.8 ns was used to examine the internal stratigraphy along US ITASE traverses. The vertical resolution is approximately 35 cm in firn, and the system can track stratigraphy to depths of ∼100m (Reference Arcone, Spikes, Hamilton and MayewskiArcone and others, 2004). In firn of dielectric constant ε = 2.4 (typical value for dry polar snow) this pulse duration provides a layer interface separation resolution of approximately 35 cm. This spacing is generally greater than the separation of annual layers at depth in polar firn. The radar profile discussed here reveals numerous events represented by pulse shapes similar to that in Figure 2a, which are most likely responses to one or more closely spaced thin layers spanning a thickness of 10 cm or less. To simplify the appearance of the profile horizons, we deconvolved (spiked) the profile and applied a Hilbert magnitude transform, as shown in Figure 2a. The consistency of the phase structure of this pulse shape throughout the profile in Figure 2b provides the basis for our confidence that we have tracked the leading edge of an isochronal event or series of events.
Radar data collected between US ITASE sites 00-4 and 00-5. (a) 400 MHz pulse shape as reflected by a high-density layer in firn (black line). The pulse was deconvolved with a spiking routine (blue line) before performing the Hilbert magnitude transform (red line). (b) Radar profile after deconvolution and Hilbert magnitude transformation. The darkened horizons are tracked (black lines) to illustrate isochronal continuity between core sites. The deepest visible horizon at site 4 has been tracked the entire distance (~550km along-track) to Byrd Station. Signal fading related to surface undulations is apparent beyond 60 km.
Defining the Depth–Age Relationship
To determine the relationship between depth and age for the upper ∼60m of firn at each end of the radar profile, ice cores collected at 00-4 and 00-5 were analyzed for soluble major-ion content (e.g. Reference Dixon, Mayewski, Kaspari, Sneed and HandleyDixon and others, 2004) and density. High-resolution chemical analysis (30–50 measurements per meter) was used to define each core-chemistry year on the basis of a winter–spring peak in Na+, Cl–, Ca+, Mg2+ and K+ combined with spring–summer peaks in both NO3 – and excess non-sea-salt (nss) SO4 2– (Reference Whitlow, Mayewski and DibbWhitlow and others, 1992; Reference Legrand and MayewskiLegrand and Mayewski, 1997). Extreme events, such as the AD 1815 Tambora (Indonesia) volcanic eruption provide absolute age horizons within each core that are easily identified in nssSO4 2– profiles (Fig. 1c). The dimensions and mass of individual core sections (average length is ∼1m) were measured to develop a density profile for each site (Fig. 1c). The round-trip travel time of each returned radar pulse (maximum of 741 ns) was converted to depth using the density profiles and the well-known relationship between firn density and dielectric constant (Reference Kovacs, Gow and MoreyKovacs and others, 1993) which determines the radio-wave velocity (e.g. Reference Richardson and HolmlundRichardson and Holmlund, 1999). These procedures allow us to plot the depth and age of each ice-core sample against its corresponding radar horizon (e.g. Fig. 2b).
Tests of Isochronal Accuracy
We tested the five darkened horizons in Figure 2b for isochronal accuracy by tracking their leading edge from one dated core to the other. The maximum age difference found for all the horizons tested is <1 year, including the deepest horizon that dates to AD 1815. This high degree of isochronal accuracy suggests that there is little or no error induced by layer variations, which we attribute to our trace acquisition rate (∼1 trace/15 m), traverse speed (∼3ms–1), and stacking rate during acquisition. Each of the 6641 traces in our final profile represents a stack of approximately 150 traces so that layer variations are well averaged.
It is unlikely that our procedure for depth calibration introduces any significant error, despite the 1 m core lengths used for density calculations. For example, if the average density of a 1 m core section is 600 kg m–3, the round-trip delay of the radar signal is 10.051 ns. Assuming an exaggerated inhomogeneity of 550 kg m–3 for the top half and 650 kg m–3 for the bottom half of the core, the error in time delay through each meter of core is only –0.002 ns. The cumulative error at 60m depth would be 0.12 ns (∼1 cm) within the >600 ns record. In addition, we assume that the top 2 m are at the same density as the third meter (∼400 kg m–3) because our density profiles generally begin at 2m depth. An actual density of 300 kg m–3 for the top 2 m would give a time delay error of 1.1 ns (∼10 cm), which corresponds to <1 year at a depth of 50 m.
A more likely source of error is related to difficulties in tracking some of the deeper layers where undulations on the ice-sheet surface are more pronounced. The continuity of the horizons is most evident within 60km of site 00-4 (Fig. 2b), where the ice-sheet surface is relatively smooth (Fig. 3, top right). Beyond 60 km, surface undulations affect the local accumulation rate, as noted in previous studies (Reference Black and BuddBlack and Budd, 1964; Reference Gow and RowlandGow and Rowland, 1965; Reference WhillansWhillans, 1975; Reference Mosley-ThompsonMosley-Thompson and others, 1995; Reference Venteris and WhillansVenteris and Whillans, 1998; Reference Vaughan, Bamber, Giovinetto, Russell and CooperVaughan and others, 1999b). The folded appearance of the radar horizons indicates that more snow accumulates in depressions than on hills. As the apparent folding becomes amplified with depth, the incidence angle (stratigraphic dip) between radar pulses and stratigraphic layers increases. An incidence angle of only 0.4, which is typical for this profile, provides a round-trip phase delay of almost half a wavelength between consecutively recorded traces. Therefore, this delay reduces return strengths by causing destructive interference and may affect our ability to track an individual horizon. Given this effect, the discernible leading edges that we tracked may represent one of a few closely spaced historical events.
Spatial variability in accumulation rates from ice cores and GPR profiling. Left: Annual  for 00-4 (orange) and 00-5 (gray). Top right: Surface topography. Center right: Calculated
 for each digitized horizon shown in Figure 2 (see legend). The sloping black line (short dashes) is the linear fit through the long-term
 based on the 1815 horizon. The core- (dashed orange line) and radar-derived (dashed black line) means are also shown. Bottom right: Gradients along the elevation profile (black line) (top right) and the 1966–2000 accumulation rate profile (blue line) (center right).

Determining Snow-Accumulation Rates
To determine historical accumulation rates at any point along the profile, the position and density profile of each trace was first estimated. We digitized each of the darkened radar horizons in Figure 2b according to trace number (1-6641) and round-trip travel time (0–741 ns). Each trace was post-processed for position and elevation using simultaneously recorded GPS data (Reference Hamilton and SpikesHamilton and Spikes, 2003) that were recorded as the expedition moved across the ice sheet at ∼3ms–1. Maximum uncertainties in the GPS positions never exceed 0.2 m (Reference Hamilton and SpikesHamilton and Spikes, 2003). Based on the time when GPR data collection began (obtained from the kinematic GPS receiver) and the trace acquisition rate, we estimate the time when each trace was acquired, then interpolate the GPS data to each of these times. Density profiles for all 6641 traces between the two core sites were estimated using linear interpolation.
Accumulation rates,  for each trace were calculated as follows. The interpolated density profiles and round-trip travel times were used to calculate the water equivalent (w.e.) depth to each horizon, which is divided by the age of
the horizon to yield the time-averaged accumulation rate,  since that layer was deposited. This calculation was performed for all 6641 traces that make up each of the five horizons (Fig. 2b) to produce the along-track accumulation rate,
 for each horizon at each trace (subscript r). A long-term
 is calculated using the deepest digitized horizon, which corresponds to an age of AD 1815 The same calculation scheme is used to calculate
 for the intervals between consecutive horizons.
The uncertainties associated with each calculated  vary with depth. Estimated uncertainties are based on three components: layer thinning due to ice advection (0 at surface, 1 cm at 60 m firn depth), the cumulative uncertainty introduced by our procedure for depth calibration (10cm at 2 m firn depth, 11 cm at 60 m firn depth), and the isochronal accuracy of each horizon (1 year for all depths). All possible combinations of these uncertainties were used in sensitivity tests to determine how calculated accumulation rates vary with depth. Results indicate that uncertainties at a firn depth of 10m are ∼3.8% of the calculated
 The uncertainties decrease to ∼0.5% of
 at a firn depth of 60m. Spatially averaging the calculated
 further reduces the associated uncertainties.
Results
Accumulation rates derived from each of the digitized horizons (Fig. 2b) are presented in Figure 3 (center right). The maximum spatial variability of long-term  along this 100 km transect is 32% (std dev.=18%), when comparing the range of
 (0.098–0.195 m a–1 w.e.) to the profile average of 0.144 ma–1w.e. (Fig. 3, center right). The standard deviation of
 from the linear fit in Figure 3 (center right) is 9%. The radar-derived accumulation rates agree perfectly with the core-derived accumulation rates at core sites 00-4 (0.192ma–1w.e.) and 00-5 (0.145ma–1w.e.), because the ice cores are used to calibrate the radar technique. However, the average accumulation rate of 0.169 ma–1w.e., based on the two ice cores, is 17% higher than the radar-derived average for the 100 km transect. These results are consistent with Reference Richardson, Aarholt, Hamran, Holmlund and IsakssonRichardson and others (1997) and Reference Richardson and HolmlundRichardson and Holmlund (1999), who indicate that widely spaced point measurements do not capture the wide range of spatial variability in accumulation rate, nor do they produce an accurate spatial mean.
Discussion
Topographic influence
The largest component of the spatial variability in  (Fig. 3, center right) appears to be related to ice-sheet surface topography. The large-scale trend of decreasing
 (linear fit = –0.07cma–1km–1) may be an orographic effect due to the steady 140 m rise in elevation from 00-4 to 00-5 (linear fit = 1.4mkm–1) (Fig. 3), but it could also be related to geographic differences between the two sites. For example, 00-4 is located on a relatively flat portion of the ice sheet that is within 20km of an ice divide, and 00-5 is situated on the leeward flank of an ice ridge that could partially block the supply of moisture from the ocean. Superimposed on the regional trend are local variations in accumulation rate that are related to surface undulations (e.g. Reference Black and BuddBlack and Budd, 1964; Reference Gow and RowlandGow and Rowland, 1965; Reference WhillansWhillans, 1975, Reference Richardson, Aarholt, Hamran, Holmlund and IsakssonRichardson and others, 1997; Reference Richardson and HolmlundRichardson and Holmlund, 1999; Reference Vaughan, Bamber, Giovinetto, Russell and CooperVaughan and others, 1999b), which is supported by the observation that local accumulation rates are highest in basins and lowest on peaks (Fig. 3, top and center right).
In Figure 3 (bottom right), the gradients along the  curve, kb, indicate that accumulation varies by up to 3 cm a–1km–1 (std dev: = 0.55 cm a–1 km–1) while gradients along the elevation curve, k
el, have a maximum of 11 mkm–1 (std dev: = 2 mkm–1). These gradients were calculated according to changes in each variable measured over a distance of ∼150m (±5 traces). Both kb and kel are presented as absolute values in Figure 3 (bottom right) to demonstrate the strong correlation between these two variables. The sign of the correlation coefficients in Table 1 shows that
 and surface undulations are out of phase when both positive and negative gradients are considered. The kb curve based on the most recent interval (1966–2000) is presented in Figure 3 (bottom right), because it has the best correlation with kel (Table 1). radar transect where the topographic influences are presumably different.
Correlation between along-track gradients in  and surface slope (Fig. 3, bottom right). Negative correlations indicate that large
 are typically associated with topographic depressions, and small
 are associated with crests/flanks. The correlations are best for the youngest strata, because these have been least affected by advection through a series of undulations

The strength of the correlations in Table 1 could depend upon the orientation of the radar profile with regard to dominant wind direction. For example, Reference Black and BuddBlack and Budd (1964) suggest that the highest  should occur on the windward flanks of surface undulations, but their study was approximately parallel with the dominant wind direction. In contrast, our profile is nearly perpendicular to the dominant wind direction, and we observe the highest
 near the middle of basins (e.g. Whillans, 1975). However, the orientation of the profile does not explain the reduction in correlation between kb and kel with increasing interval age (Table 1), which is likely related to ice advection, because the older layers were deposited farther up-glacier of the
Resolving climatic influence
The  data in Figure 4 reveal that the largest amount of variability is observed on annual time-scales. Because
 in this region are less than the vertical resolution of our radar system, annual variability must be addressed using the high-resolution ice cores (e.g. Reference KaspariKaspari and others, 2004). The annual
 at core sites ranges from 5% to 65% (std dev: = 22%) when calculated as the per cent difference from each core-derived average (Fig. 4, left). This high degree of variability is regarded as significant because it often exceeds 16%, which is the estimated uncertainty introduced by sastrugi (Reference WhillansWhillans, 1978; Reference Venteris and WhillansVenteris and Whillans, 1998). Longer-term trends (on the order of decades to centuries) in the annual
 records related to topography and ice advection have also been considered (Reference KaspariKaspari and others, 2004). These high-resolution records show that annual snowfall rates in this region have decreased since 1970.
Temporal variability in accumulation rates from ice cores and GPR profiling. Left: Per cent difference from the core-derived average  for 00-4 (orange) and 00-5 (gray). Top right: Calculated
 for each interval (see legend). The thick black line represents the long-term
 (1815–2000). Center right: Per cent difference from the long-term
 for each horizon (see legend). Bottom right: Accumulation rate profiles (center right) after being smoothed. The 10 km smoothing clips the ends from each profile (see legend).

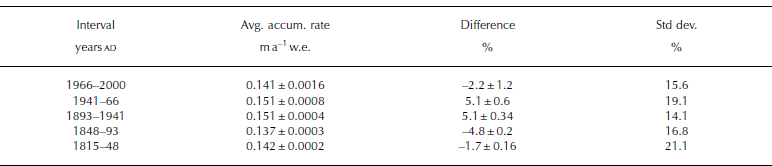
Accumulation variability on multi-decadal time-scales (25–48 years) is determined for intervals between consecutive radar horizons (Fig. 4, top right). Standard deviations for each of these intervals vary between 14.1% and 21.1% (Table 2), and the maximum deviation is 29% (Fig. 4, center right). Per cent changes in accumulation rate for each point along-track are determined using the long-term  (1815– 2000) as a reference interval (Fig. 4, center right). Much of the variability in Figure 4 (center right) is related to surface undulations and ice flow, which complicates the search for climate signals within each accumulation record.
Multi-decadal  expressed as the 100 km mean for each interval, the per cent difference between the interval mean and the long-term regional mean (0.144ma–1). Each of these means comprises 6641 measurements, which greatly reduces the 2σ uncertainties. The final column is the standard deviation of
 for each interval, which is calculated relative to the long-term regional mean
A clearer picture of changes related to climate emerges when the short-scale spatial variations are smoothed to length scales that are comparable to surface undulations, which are generally <10 km. Using a 10 km running average, multi-decadal variability identified near 00-4 is found to be consistent over distances of ∼50km (Fig 4, bottom right). The smoothed profiles also suggest that a less stable climatic regime operates beyond the 50km mark (Fig 4, bottom right), although part of the remaining variability may be related to larger-scale topographic, orographic and geographic effects.
Further isolation of a climate signal may be achieved by calculating the mean  for each interval, which also reduces the uncertainties to <2 mma–1w.e. for all intervals (Table 2). Table 2 shows that typical changes between the means of adjacent intervals are on the order of ∼5% (∼0.007ma–1w.e.) of the regional mean. The largest increase was 9.9% (∼0.014ma–1w.e.) of the regional mean, which occurred between the 1848–93 (45 years) and 1893–1941 (48 years) intervals. The largest decrease was 7.8% (∼0.011ma–1w.e.) of the regional mean, which occurred between the 1941–66 (25 years) and 1966–2000 (34 years) intervals. This result is consistent with results from the analyses of annual accumulation records (Reference KaspariKaspari and others, 2004), which show that this region has experienced a 2–9% (00-4 and 00-5, respectively) decrease in accumulation rate since 1970.
Conclusions
Continuous radar profiling along a 100 km transect reveals that accumulation rates on the West Antarctic plateau can vary by up to 3 cma–1 over a distance of 1 km, although they typically vary at a rate of 0.55 cm a–1km–1. Wind redistribution of snow around surface undulations is the leading cause of this variability, which is consistent with other studies (e.g. Reference Black and BuddBlack and Budd, 1964; Reference Gow and RowlandGow and Rowland, 1965; Reference WhillansWhillans, 1975; Reference Richardson, Aarholt, Hamran, Holmlund and IsakssonRichardson and others, 1997; Reference Richardson and HolmlundRichardson and Holmlund, 1999; Reference Vaughan, Bamber, Giovinetto, Russell and CooperVaughan and others, 1999b). Further characterization of the spatial distribution of snow accumulation on the Antarctic plateau will require additional continuous measurements of the kind presented here.
The advection of ice through surface undulations is found to have an impact on estimates of accumulation rate, which suggests that temporal variability observed in accumulation-rate records from ice cores and GPR profiles can be obscured by spatial influences. However, it is possible to resolve temporal signals if the effects of local topography and ice flow are considered. An apparent climate signal identified here is that accumulation rates along this part of the West Antarctic plateau have decreased in recent decades, which agrees with results from ice-core analyses in this region (Reference KaspariKaspari and others, 2004).
Acknowledgements
Funding for this research was provided through a grant from the US National Science Foundation (OPP-0196441) to G.S.H. and a National Aeronautics and Space Administration Earth System Science Fellowship (NGT5-30426) to V.B.S. We would like to thank O. Eisen, M. Frezzotti and an anonymous reviewer for their helpful comments.



