


1. Introduction
There has been a growing concern in recent years that the patterns of economic growth being experienced in many parts of the world are not sustainable, because they are being accompanied by a depletion of many natural resources and a deterioration in various environmental services.Footnote 1 The concerns have helped spawn a growing literature on sustainable development.
Much of the literature on sustainable development has taken human wellbeing to be the object to be sustained. Two alternative formulations have been explored: the current generation's wellbeing and intergenerational wellbeing.Footnote 2 When scholars adopt the former, they ask whether the society under study is functioning in ways that would enable future generations to achieve a level of wellbeing at least as high as the current one. However, the determinants of current wellbeing include such variables as consumption of various kinds, leisure activities and environmental amenity services. Hence, the criterion function for sustainable development reduces to a weighted sum of the magnitudes of those determinants – the weights being their respective marginal contributions to current wellbeing. They are the determinants' shadow prices, and the weighted sum is the economy's real income. Solow (Reference Solow1974) and Hartwick (Reference Hartwick1977) were early theoretical exercises in this vein. Empirical work (albeit many authors do not use the term ‘sustainable development’ in their writings) includes that of Nordhaus and Tobin (Reference Nordhaus and Tobin1972) and Jones and Klenow (Reference Jones and Klenow2010). These contributions have put flesh into an earlier literature on the meaning of real national income (Lindahl, Reference Lindahl and Bagge1934; Hicks, Reference Hicks1940; Samuelson, Reference Samuelson, Lutz and Hague1961). In their formulation, a society's economic development would be said to be sustainable at a point in time if its real income at constant shadow prices were non-decreasing at that time.
In contrast, when scholars adopt intergenerational wellbeing as the object of interest, their presumption is that at any given date social wellbeing is not only the wellbeing of the current generation, but also the potential welfare of the generations that are to follow. The point is to ask whether the society under study is functioning sufficiently well to ensure that some measure of intergenerational wellbeing does not decline. Hamilton and Clemens (Reference Hamilton and Clemens1999) and Dasgupta and Maler (Reference Dasgupta and Mäler2000) noted that, because the determinants of intergenerational wellbeing are the multitude of capital assets the economy has inherited from the past, the criterion function for sustainable development reduces to a weighted sum of the stocks of those assets – the weights being the marginal contributions of the stocks to intergenerational wellbeing. The weights are therefore the assets' shadow prices, and the weighted sum is the economy's wealth. Empirical work in this vein includes Hamilton and Clemens (Reference Hamilton and Clemens1999), Dasgupta (Reference Dasgupta2001) and Arrow et al. (Reference Arrow, Dasgupta, Goulder, Daily, Ehrlich, Heal, Levin, Mäler, Schneider, Starrett and Walker2004). In their formulation, a society's economic development would be sustainable at a point in time if its wealth at constant shadow prices were non-decreasing at that time.
Wealth – we call it ‘comprehensive wealth’ – is the dynamic counterpart of real income.Footnote 3 Obviously, real income and comprehensive wealth would move in the same way over time if the economy under study were in a steady state. That is because in a steady state relative shadow (spot) prices remain the same over time. Outside steady states, however, the two formulations differ and a choice has to be made between them. In this paper we take intergenerational wellbeing to be the object of interest in sustainability analysis.
A comprehensive accounting of an economy's capital assets would include its population. If demographic features were to remain constant over time, the rate of change in comprehensive wealth at constant shadow prices would equal what could be called ‘net saving’ (Hamilton and Clemens (Reference Hamilton and Clemens1999) called it ‘genuine saving’). In such a situation an economy would enjoy sustainable development at a point in time if net saving were non-negative. In their empirical work, Hamilton and Clemens (Reference Hamilton and Clemens1999) estimated average net saving over the period 1970–1996 in a large number of countries. However, population grew in all the countries on their list. As population was not viewed as a capital asset in their work, the sign of net saving in a country could not be relied upon to indicate whether development during the period in question had been sustainable there. Arrow et al. (2003) showed that estimating the shadow price of population will prove to be especially problematic. Fortunately, it can be shown (proposition 3 below) that the problem can be bypassed if sustainable development is interpreted not as an increase over time in intergenerational wellbeing, but as an increase over time of the potential wellbeing of the average person across the generations (equation (14)). Below, we find conditions under which development is sustainable at a point in time if wealth per capita at constant shadow prices is non-decreasing. So we are required to estimate not only the rate of change in wealth at constant prices (i.e., net saving), but also comprehensive wealth in the period being studied. But data on per capita capital stocks are available for only a few reproducible assets. We have therefore to augment estimates of net saving with estimates of population growth and the comprehensive wealth in each of the countries on our list.Footnote 4
Sustainable development is a different notion from optimum development; it is different even from efficient development. This means that, in developing the welfare economics of sustainable development, analysts need to define shadow prices on the basis of a path of development that is forecast; they should not assume that the economy is on an optimum or efficient path. The appropriate prices to apply in these exercises are shadow prices, which often differ from market prices. This is the route we follow.
The World Bank (Reference Bank2011) has been a leader in the estimation of comprehensive wealth in sustainability analysis. The authors have estimated the (shadow) values of some components of comprehensive wealth, namely, the values of natural, human and reproducible capital. However, they did not attempt to value important forms of what they call ‘intangible capital’, including human lifespan. They addressed that problem by first creating an estimate of a comprehensive measure of wealth, where comprehensive wealth is identified with the present value of an estimated stream of consumption. The missing forms of wealth are then determined as a residual – as the difference between the estimate of comprehensive wealth and the sum of the values of the components of comprehensive wealth they were able to assess directly.
To implement the just-described World Bank definition of wealth, it is necessary to predict future consumption levels and to find the rate at which to discount them. The authors assume, first, that consumption will change at a constant rate and, second, that it is discounted at the consumption rate of interest (the rate which rational consumers would use). The latter equals the pure rate of time preference plus the product of the rate of growth of consumption and the elasticity of the marginal utility of consumption. They assume the utility of consumption is logarithmic, so that this elasticity equals one. It then turns outFootnote 5 that the integral over time of discounted utility (what we call ‘intergenerational welfare’) is equal to current consumption divided by the pure rate of time preference. The authors modified this result in three ways: (1) the initial value for consumption from which the path of future consumption is generated is a rolling average of consumption of recent years, to avoid having the results influenced by short-term fluctuations; (2) if there were negative genuine savings, the consumption was re-estimated as the lower level at which genuine savings would have been zero; and (3) the discounting was carried out only for a finite length of time (roughly, the life of one generation).
A difficulty is that the assumption of a constant growth rate is incompatible with the idea that there are potential difficulties in achieving sustainability. Suppose that measured consumption (before adjustments to address negative genuine savings) is growing over some period. Then by the World Bank calculations, wealth is regarded as growing. However, if during the same period we observe that natural resources are being depleted or that CO2 is being released in the atmosphere, we have evidence that the assumed growth in consumption overstates the true increase in wealth; indeed, actual wealth could be declining. The problem is that although the World Bank makes adjustments to the initial level of consumption from which the integral of discounted utility (or total wealth) is generated, it maintains the assumption of a constant and positive consumption growth rate. This begs the question of sustainability and leads to unreliable estimates of total wealth.
In this paper we follow an approach that is closely guided by welfare economic theory. We consider levels and changes in human capital, natural capital, reproducible capital and health capital. We also include the effects of technological change and changes in institutional quality when estimating movements in comprehensive wealth over time.Footnote 6 We do not attempt to forecast whether the wellbeing of the average person over time will be maintained in any of the countries on our list. Instead, we assess changes in comprehensive wealth per capita on the basis of their recent economic experience and relate such changes to changes in the potential for future wellbeing. In other words, our method for measuring wealth and its movement over time is based on direct measurement; we do not simply assume a value of comprehensive wealth.
Our approach compelled us to consider conceptual and practical issues that have not been addressed in earlier work on sustainability and on the measurement of wealth. Among these are the meaning of wealth in a non-optimal course of development, the role of ecosystem resources and global public goods, the implications of resource exhaustion in a world of international trade, and the measurement of health as a form of capital.
We apply the theory to five countries which differ significantly in terms of their stages of development and resource bases: the United States, China, Brazil, India and Venezuela. Using data from the period 1995–2000, we show that the once-missing forms of capital – human capital, knowledge capital and health capital – fundamentally affect the conclusions one draws about whether given nations are achieving sustainability. Investments in human capital and knowledge capital (in addition to investments in reproducible capital) are critical to maintaining per capita wealth in the US and Brazil. In contrast, in China and India the investments in reproducible capital alone are enough to offset the per capita decrease in natural capital. For Venezuela, per capita wealth is not maintained (that is, the sustainability criterion is not met) unless one accounts for increases in health capital. We find that health capital makes a huge difference to our estimates of changes in per capita wealth. The value of this capital is more than twice as large as all other forms of capital combined. As a result, health capital's growth rate largely determines the growth rate of comprehensive wealth.
The plan of the paper is as follows. In section 2 we develop a basic theory and identify the propositions we need. In section 3 we extend the theory to enable it to embrace technological and institutional change and population growth. Section 4 discusses issues relating to the implementation of the theory. In section 5 we use data for the period 1995–2000 to study whether economic development in a selected number of countries was sustainable. Section 6 concludes and includes discussion of some of the most glaring weaknesses in our empirical work.
2. The basic model
We assume a closed economy. Time is continuous and denoted variously by s and t (s ≥ t ≥ 0). The horizon is taken to be infinite.
Let  denote a vector of consumption flows at time s.
 includes not only marketed consumption goods but also leisure, various health services, and consumption services supplied by nature. Consumption goods are indexed by j. Let
 denote the stocks of a comprehensive set of capital assets at s. For simplicity, we assume that demographic changes, movements in total factor productivity (TFP) and changes in import and export prices are exogenous. Capital assets are indexed by i.
2.1. A definition of sustainability
To fix ideas, we assume for the moment that population is constant. Let  be economy-wide felicity (utility flow) at s. Denote intergenerational wellbeing at t by V(t). We assume that

where δ is the felicity discount rate. Thus, intergenerational wellbeing is the discounted flow of the felicities of current and future generations.
An economic forecast at t is the pair of vector functions  for s ≥ t. Assume that the integral in expression (1) converges for the forecast. We now state:
Definition 1.

To save on notation, we avoid writing down an explicit dynamical model of the economy. We note that, even though the sustainability requirement (condition (2)) is defined at a particular moment in time, the element V requires a forecast of the economy's future beyond t. That future depends on the economy's stock of assets at t; it also depends on the evolving structure of technology, people's values and preferences, and institutions beyond t. The stock of assets at any moment s in the future would be determined by the stocks at the ‘previous’ date.Footnote 7 By proceeding from moment to moment this way, the entire future course of capital stocks would be determined.Footnote 8 With a theory of political economy that is reliable enough to track the co-evolution of economic development and the economy's institutions, we could trace institutions at s to capital stocks and the prevailing institutions at t. With no reliable theory of political economy available, changes in institutions have to be treated as exogenous events; this is what we do here. Thus, given  ,
 and
 , and thereby
 , are determined for all future times s ≥ t. Hence, from equation (1), V(t) is determined as well. Therefore we can write

In equation (3), V depends directly on t to reflect the impact of time-varying factors that we treat as exogenous. These include changes in the terms of trade, technological change, unexplained population growth and unexplained changes in institutions. By ‘unexplained’ we mean exogenous and thus distinct from the changes that are endogenous to the system. Hence t can be regarded as an additional form of capital asset, an interpretation we will adopt presently. Note that we do not assume the economy to be on an optimum trajectory (see Dasgupta and Mäler, Reference Dasgupta and Mäler2000).
2.2. Shadow prices
For simplicity of notation, we take felicity to be the numeraire. Let q j(t) denote the shadow price of consumption good j at time t. Then

We assume that V(t) is differentiable in  .Footnote 9 Differentiating V(t) with respect to t in (3) and using (2) yields a criterion for sustainable development at t:

Presently we will relate this criterion to prices and investment. Define

The variable p i(t) is the (spot) shadow price of the i th asset at t. This price represents the contribution to V(t) made by K i(t) both through the goods and services it helps produce as well as through direct enjoyment of the stock itself. A wetland is an example of a capital asset that contributes to V in both ways; health is another. In imperfect economies (e.g., those experiencing the tragedy of the commons), an asset's shadow price can be negative even when its market price is positive.Footnote 10
At any date an asset's shadow price is a function of the stocks of all assets. Moreover, the price today depends not only on the economy today, but on the entire future of the economy. So, for example, future scarcities of natural capital are reflected in current shadow prices of all goods and services. That means that shadow prices are functions of the degree to which various assets are substitutable for one another, not only at the date in question, but at subsequent dates as well. Of course, if the conception of intergenerational wellbeing involves the use of high discount rates on the wellbeing of future generations (i.e., if δ is large), the influence on today's shadow prices of future scarcities would be attenuated. Intergenerational ethics plays an important role in the structure of shadow prices.
Equations (5) and (6) imply that the ratios of shadow prices are marginal social rates of substitution among the various capital assets. In an economy where V(t) is maximized, these marginal rates of substitution equal their corresponding marginal rates of transformation. As the latter are observable in market economies (e.g., border prices for traded goods in an open economy), shadow prices are frequently defined in terms of marginal rates of transformation. However, marginal rates of substitution in imperfect economies do not necessarily equal the corresponding marginal rates of transformation. In our empirical application below, we sometimes use market prices as shadow prices for various forms of capital assets. In cases involving assets over whose production and distribution the market mechanism is known to be especially deficient, we invoke additional information to assess the shadow prices.
2.3. Comprehensive wealth
To arrive at a measure of comprehensive wealth that accounts for certain exogenous changes (e.g., changes in TFP), we need an additional shadow price. Let time also be regarded as a capital asset. Also, let r(t) be the shadow price of time at t:

We can now use shadow prices as weights to construct an aggregate index of the economy's stock of capital assets. Refer to that index as comprehensive wealth, W. Formally, we have:
Definition 2.
An economy's comprehensive wealth is the (shadow) value of all its capital assets; that is

As observed earlier, comprehensive wealth is the dynamic analogue of real national income and involves the same reasoning as the one that is familiar in studies of the welfare economics of timeless economies.
A critical linkage in our analysis is between changes in comprehensive wealth at constant prices and changes in intergenerational wellbeing.
Proposition 1.
A small perturbation to an economy increases (resp., decreases) intergenerational wellbeing if and only if holding shadow prices constant, it increases (resp., decreases) comprehensive wealth.Footnote 11
Proof: Let Δ denote a small perturbation. Then

But by definition,  and
 . Therefore, equation (9) can be re-expressed as

□
2.4. Comprehensive investment
Now p i(t) Δ K i(t) in equation (10) is the shadow value of net investment in asset i, and r(t) is the shadow price of time t. Letting I i(t) = ΔK i(t)/Δ t, we can write (10) as

Definition 2 says that the expression on the right hand side of equation (11) is the comprehensive investment that accompanies the perturbation. This means that Proposition 1 can be re-stated as
Proposition 2.
A small perturbation to an economy increases (resp., decreases) intergenerational wellbeing at t if and only if the shadow value of comprehensive investment at t that accompanies the perturbation is positive (resp. negative).Footnote 13
Comprehensive investment has a well-known welfare interpretation. It can be shown that the shadow value of comprehensive investment is measured by the present discounted value of the changes in the consumption services that are brought about by it. In studies on sustainable development the perturbation is the passage of time itself, meaning that Δ t > 0. That is the case we study in this paper.
Note that the relationship between intergenerational wellbeing and comprehensive wealth in propositions 1 and 2 is an equivalence relation. The claim is that a change in comprehensive wealth has the same sign as the corresponding change in intergenerational wellbeing. The propositions on their own do not determine whether comprehensive wealth in a particular economy can be maintained or whether vital forms of natural capital have been so depleted that it is not possible for the economy to enjoy sustainable development in the future. For example, it could be that, even though an economy experiences sustainable development for a period of time, it is incapable of enjoying it indefinitely owing to scarcity of resources or limited substitution possibilities among capital assets or because the scale of the economy is too large. Or it could be that, although the economy is in principle capable of realizing sustainable development, V(t) declines along the path that has been forecast because of bad government policies.
For yet another example, consider an optimum economy, in which δ has been chosen to be so large that V(t) declines over time. This latter example demonstrates that ‘sustainability’ and ‘optimality’ are very different concepts. It can even be that along an optimum path (i.e., a path that maximizes V), V(t) declines for a period and then increases thereafter.
2.5. Sustainable development over an interval of time
Inequality (11) yields a local measure of sustainability. Integrating equation (11) from, say, s = 0 to s = T, yields
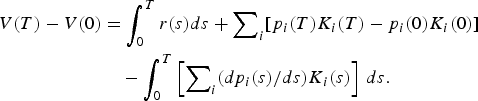
Equation (12) says that, in assessing whether intergenerational wellbeing has increased between two dates, the capital gains on the assets that have accrued over the interval should be deducted from the difference in wealth between the dates.
Our empirical applications, reported in sections 4–5, cover the period 1995–2000. Because the period is short and all the figures for economic variables are period averages, we interpret 1995–2000 to be a moment in time. We thus bypass capital gains and make use of Definition 1 to determine whether the countries in our sample enjoyed sustained development.
3. Extensions to the model
Here we describe a few extensions to the model. First, we show how those technological and institutional changes that are reflected in an economy's TFP growth can be subsumed in comprehensive investment. Second, we describe how the model can be extended to incorporate population growth without the need for estimating the shadow price of population. Finally, we indicate how the model can allow for transnational externalities.
3.1. Incorporating TFP growth in comprehensive investment
Technological change involves investment in research and development (R&D). Expenditure in R&D is therefore a part of comprehensive investment. But that does not take into account exogenous increases in TFP growth. Exogenous changes in TFP are reflected in the first term on the right hand side of equation (11), namely r(t) ( ).
Let Y(t) denote aggregate output at t. Suppose  , where F is a constant returns to scale production function and A(t) is TFP at t. A can be interpreted to be an aggregate index of knowledge and the economy's institutions. It can therefore be regarded as yet another form of capital asset. Let γ be the rate of growth of TFP (that is, (dA/dt)/A). It can be shown that if the economy is in a steady state,

where q A(t) is the shadow price of A(t). If the rate of national saving is small, the factor q A(t)A(t)/Σp i(t)K i(t) can be shown to equal 1 approximately. In that case equation (13) says that we need merely to add TFP growth to comprehensive investment (equation (11)). We follow this procedure in our empirical application.
3.2. Population change
Population is a capital asset. We have ignored it so far because population has been assumed to remain unchanged over time. Demographic change introduces complications to the analysis because we now have to add to the list of capital assets a set of (demographic) capital stocks whose shadow prices have to be estimated. This means adding to the list of capital assets the size of each cohort in the population. For simplicity we assume that cohorts are identical in their preferences and abilities. Then the size of the population, P(t), is the stock of the demographic asset. Arrow et al. (2003) developed the basics of the required analysis when a demographic theory is in hand. In the absence of a sound demographic theory we suppose that P(t), like TFP, changes exogenously over time. The effect of changes in P would then appear in the term r(t) in equation (11). It remains to find a workable way to estimate that effect and isolate it from all other factors included in r(t). To do that, it is simplest to assume that, excepting for population change, the economy does not experience any exogenous changes.
It could seem intuitive that, when population size changes, the criterion for sustainable development should be non-declining comprehensive wealth per capita. It transpires that this is generally not true (Dasgupta, Reference Dasgupta2001; Arrow et al., 2003). In what follows we identify conditions under which the intuition is correct.
Consider the following expression for intergenerational wellbeing:
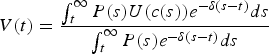
where c(s) represents per capita consumption at time s. Let us call the ethical theory on which expression (14) is based, dynamic average utilitarianism.
Note that the denominator in expression (14) would play no role in policy evaluation at t, because the denominator would simply be a scale factor attached to expression (14). But for sustainability analysis the denominator matters, because the evaluation there is undertaken across time.
Let k i(t) = K i(t)/P(t) represent the per capita stock of asset i and let  be the vector of per capita stocks. Because population has been assumed to change at a constant rate and because by assumption the only exogenously changing variable is population, expression (14) can be written as

It can be shown that if in addition, each of the equations reflecting the economy's dynamics can be expressed in terms solely of per capita capital stocks, then  (Dasgupta, Reference Dasgupta2001; Arrow et al., 2003). Under those conditions we therefore have
Proposition 3.
Development is sustained at t if and only if, when valued at constant shadow prices, comprehensive wealth per capita is non-decreasing at t.
The assumption that each of the equations reflecting the economy's dynamics can be expressed in terms solely of per capita capital stocks is very strong. In order to weaken it and nevertheless obtain a tractable formula, suppose the scale economies of production are such that population size enters the economy's dynamics as TFP. In that case we would modify proposition 3 by adding the percentage rate of change of population size to the rate of change in wealth. Proposition 3 and its extension just mentioned have been used in applied studies on sustainable development (Arrow et al., Reference Arrow, Dasgupta, Goulder, Daily, Ehrlich, Heal, Levin, Mäler, Schneider, Starrett and Walker2004, Reference Arrow, Dasgupta, Goulder, Mumford and Oleson2007).
3.3. Transnational externalities
Countries interact with one another not only through trade in international markets, but also via transnational externalities. In our empirical application we subtract from growth in wealth the damages caused to a country by anthropogenic climate change. Hamilton and Clemens (Reference Hamilton and Clemens1999) included CO2 in the atmosphere in their list of assets, but regarded the shadow price (a negative number) of a country's emission to be the sum of the shadow prices of all countries. Their procedure would be valid if each country were engaged in maximizing global welfare, an unrealistic scenario. We now develop the required analysis for global public goods generally.
Let G(t) be the stock of a global public good at t. We may imagine that G is measured in terms of a ‘quality’ index which, to fix ideas, we shall regard as CO2 concentration in the atmosphere. Being a global public good, G is an argument in the V function of every country. For simplicity, we assume that there is a single private capital good. Let K n(t) be the stock of the private asset owned by residents of country n. If V n is intergenerational wellbeing in n, we have in the notation of the previous section,

Let  . It may be that G is an economic ‘good’ for some countries, while it is an economic ‘bad’ for others. For the former, g n > 0; for the latter, g n < 0. Let E n(t) be the net emission rate from country n and E(t) the net aggregate emission rate. It follows that

Comprehensive investment in country n is dV n(t)/dt = r n(t) + q n(t)dK n(t)/dt = g n(t)dG(t)/dt, which, on using (17), becomes:

Note that the expression on the right hand side of equation (18) does not depend on whether the world economy is enjoying optimum international cooperation. On the other hand, dK n(t)/dt and dG(t)/dt do depend on the policies followed in other economies (e.g., whether the countries cooperate) and they affect r n(t), q n(t) and g n(t). Hamilton and Clemens (Reference Hamilton and Clemens1999) and World Bank (Reference Bank2006) identified the ‘net benefit’ to country n from emissions as (Σg k(t))E n(t), whereas, as equation (18) shows, the correct formula is g n(t)[ΣE k(t)]. If countries act in their own interest, the two expressions are equal only under very special circumstances (e.g., if the countries were identical).
4. Implementing the theory: measuring changes in capital stocks and estimating shadow prices
In two important publications, World Bank (Reference Bank2006, Reference Bank2011) built on the empirical analysis in World Bank (Reference Bank1997) by estimating wealth and its composition in 120 nations in the years 1995, 2000 and 2005. Comprehensive wealth was defined by the authors as the present value of the flow of aggregate future consumption. The authors first forecast growth rates in consumption for the foreseeable future beginning with the date for which wealth is to be calculated. They then compute the discounted value of the resulting consumption stream so as to estimate comprehensive wealth. They estimated the shadow values of reproducible capital and of natural capital (amounts multiplied by shadow prices) and subtracted the sum from comprehensive wealth to arrive at a figure for what they referred to as the value of ‘intangible capital’ (human capital, institutions, public knowledge). Natural capital was taken to include agricultural land, urban land, pasture land, energy and mineral resources, timber and non-timber forest resources, and protected areas. They concluded that in poor countries the shadow value of natural capital is about 25 per cent of comprehensive wealth and that the share of intangible wealth is a bit over 55 per cent.
Our approach differs from that of the World Bank. We argue that assuming that we have a good forecast of future consumption amounts to assuming that we know how sustainable the economy is, when that is what we are trying to determine. We build up estimates of the values of the stocks of each of the various forms of capital and then sum those to calculate comprehensive wealth. Hence, no form of comprehensive wealth is calculated as a simple residual. In any case, as is well known, the present value of future consumption flows can be identified with comprehensive wealth (defined as the shadow value of an economy's entire set of capital assets) only under special and stringent conditions.Footnote 14
Our approach also differs in the ways we calculate various components of comprehensive wealth. First, we estimate investments in human capital with reference to projected changes in the work force and in labor productivity associated with different levels of education; this contrasts with some earlier work in which investment in human capital was identified with public expenditure in education.Footnote 15 The two would be the same only if education were provided by a price system, supplemented with a credit system to permit repayment of the costs of education over time as the income generated by education accrues. Second, we consider improvements or deteriorations in health, which were not part of the World Bank assessments. Third, we account for capital gains in stocks of exhaustible natural resources for exporters with corresponding losses for importers. Of course, the rising prices of exhaustible resources are not valued in a closed economy, such as the world as a whole, because the higher prices yield gains to producers but losses to consumers. But in a set of interrelated open economies, exporters can look forward to higher prices (and therefore higher command over future goods), while importers suffer correspondingly. Hence, the wealth of an exporter is higher than would be found by using current prices for the resource, while the wealth of an importer is correspondingly lower.Footnote 16 Finally, in contrast to the World Bank but in accord with empirical studies, we allow TFPs to differ across countries. In this section, we describe how we implement these elements of our analysis.
For our empirical application we need to measure levels and changes in the stocks of various types of capital. In addition, we need to be able to aggregate those levels and changes to obtain estimates of comprehensive wealth and comprehensive investment. This requires applying shadow prices to each of the various stocks. Here we describe our methods for capital stocks, changes in those stocks, and shadow prices.
4.1. Valuing net investment in natural capital
To arrive at values of net investment in natural capital we need to estimate changes in resource stocks as well as the shadow prices to apply to those changes. For a non-renewable resource such as copper, the change in the stock is simply the negative of the amount depleted (extracted) during the period. If we abstract from externalities associated with the use of the resource, the rental value will correspond to the resource's shadow price.
For renewable resources such as forests, net investment equals the increase in the forests due to natural growth and replanting, less the amount that is depleted. The shadow price is again the rental value (price less cost of cutting).
4.2. Capital gains in non-renewable resources
Oil exporting countries have enjoyed capital gains on their stocks underground. To the extent that the rental value of a non-renewable resource rises over time, owners of the resource stock should expect to receive capital gains. Correspondingly, future consumers should expect to pay higher real prices which, other things being equal, imply a reduction in real wealth. Thus the impacts on real wealth of a given nation's residents will depend on the extent to which the residents own (and sell) or consume (purchase) the resource in question.
It appears that those impacts have not been addressed in any of the prior literature.Footnote 17 For each country, the capital gain is equal to the resource stock times the rate of increase of the export price. We equate this shadow value to current resource rents and, following Hotelling, assume that this shadow price rises at the rate of interest. Summing the capital gains over all countries gives the total capital gains to that resource. The corresponding capital losses by purchasers must equal this sum. In principle, these losses should be allocated among individual countries in accordance with their future purchases of oil. In the empirical application below we have approximated by giving each country a capital loss equal to total capital losses to consumer times that country's share of current consumption. It should be noted that in a closed economy there is no need to adjust for capital gains or losses, since the future gains to owners will be exactly offset by the losses to future consumers.
4.3. Determining the values of stocks of human and health capital
Here we are concerned with two aspects of human capital: education and health. Each is simultaneously a productive factor and a constituent of wellbeing. In other words, each is both a means and an end. In what follows we simplify our empirical work by regarding education solely as an input in the production of wellbeing and health solely as a constituent of wellbeing.
4.3.1. Human capital
We follow the methods introduced by Klenow and Rodríguez-Clare (Reference Klenow, Rodríguez-Clare, Bernanke and Rotemberg1997), methods that build on the earlier work of Mincer. It is assumed that investments in education earn a market rate of interest for the period of education. Assuming a steady state as a first approximation, the amount of human capital per worker is proportional to exp(rT), where r is the appropriate rate of interest (taken to be 8.5 per cent per annum) and T is the average number of years of educational attainment. The stock of human capital is the human capital per worker multiplied by the number of workers. This quantity is adjusted for mortality during the working life.
We assume that the labor market is sufficiently competitive to assure that the marginal productivity of human capital equals its shadow price and the real wage. Hence the shadow price of human capital is equal to the total real wage bill divided by the stock of human capital.
4.3.2. Health
Our approach to health is based on life expectancy: an increase in life expectancy translates into an improvement in health.Footnote 18 More specifically, the value of health improvements is the value that people attach to the additional years of life that result from such improvements. To calculate the value of an additional life year, we start with estimates of the value of a statistical life (VSL). A common method for estimating VSL is to study differential wages for jobs involving differential risks of a fatal on-the-job accident.
Given the VSL, we can derive the value to individuals of an additional life year.Footnote 19 Suppose for simplicity that the value to someone of an additional year of life h is independent of age a. Assuming that the time discount rate is δ, we can express the value V for an individual of age a to survive to age T as

Let f(T) be the probability density that someone born will die at age T, and let F(T) be the corresponding cumulative distribution. If f(T/T ≥ a) is the conditional probability density of death at age T, given survival to age a, then

Let m(T) be the mortality hazard rate (the probability rate that someone aged T will die at that age), and define

Then we have the identity,

From equations (19)–(22) we arrive at our measure of the value of health capital H(a) of an individual of age a: it is the expected value of survival to a random age. Thus,
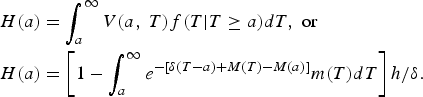
Let π (a) be the proportion of people of age a. Then the per capita health capital in the economy, measured in life years, is  . This is the same as the VSL. Therefore we choose the parameter h, the age-independent value of a statistical life year (VSLY), in each country so as to insure this equality.
5. Data and empirical results
We use data from the period 1995–2000 to analyze whether economic development was sustainable in five countries: the United States, China, Brazil, India and Venezuela.
5.1. Natural capital
Natural capital includes non-renewable energy and mineral resources as well as renewable forest and land resources. We focus on the economically most important types of natural capital, to the extent that data are available.
5.1.1. Oil and natural gas
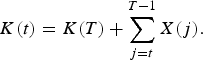
We obtain estimates of oil and natural gas consumption, extraction and proven reserves from the Statistical Review of World Energy (BP, 2005). Proven reserves are the known quantity that is economically recoverable given current technology.Footnote 20 Our measure of the stock in year t, K(t), uses the total extraction X(t) for that country and the most recent measure of proven reserves, K(T), according to:
As a simplification, we treat oil as a homogenous good, averaging over oil grades (West Texas, Nigerian Forcados, Brent and Dubai) and over time to obtain an average price of oil for the 1995–2000 period. The average price for natural gas is also calculated as an average price over sources (US, UK, Japan, Europe) and over time. The shadow price is this average price less the extraction cost which is country specific and is obtained for both oil and natural gas from the World Bank (Reference Bank2006) data appendix.
5.1.2. Metals and minerals
For metals and minerals, we use the reported proven and probable reserves from the Mineral Commodity Summaries (US Geological Survey, 2006). Extraction estimates for each commodity are obtained from the World Bank (Reference Bank2006) data appendix. The measure of the stock for each metal and mineral in each year is calculated using only the most recent measure of the proven reserves and the extraction data as in equation (24). World market prices and country-specific extraction cost estimates are from the World Bank (Reference Bank2006) data appendix. For certain metals and minerals, the country-specific extraction cost estimate exceeds the average world market price. If this is the case, we assume that the shadow price for this resource in this country is zero, even if the country is extracting this resource.
5.1.3. Forests
We obtain the total cubic meters of commercially available forests from the Global Forest Resources Assessment (Food and Agriculture Organization, 2006) for 1990 and 2000 and impute commercially available forest cover linearly for intermediate years. The data show that while commercially available forest cover is declining globally, it is increasing in the US, China and India. We use the commercially available forest cover as a measure of the quantity of timber available in that country. By doing so, we are implicitly assuming that the density of wood per hectare is relatively constant. The shadow price for timber is the average market price less the extraction cost; the price and cost data are obtained from World Bank (Reference Bank2006) and are country specific. The market price of timber is country specific because different types of wood have vastly different values and there are differences in the composition of forests by country.
Forests are valued not only for the wood that can be extracted from them, but also for the recreation, erosion control, water filtration and habitat services they provide. World Bank (Reference Bank2006) offers two estimates of annual non-timber forest benefits per hectare, one for developing countries and one for more industrialized nations. Similar to commercially available forest cover, we obtain the total forest cover for each country from the Food and Agriculture Organization (2006) for 1990 and 2000 and impute total forest cover linearly for intermediate years.
5.1.4. Land
One of the most important forms of natural capital, in terms of its total value, is land. Countries differ in their land endowments, both in area and type (e.g., agricultural, forest, urban). World Bank (Reference Bank2006) provides estimates of the quantity and value of four types of broadly defined land: forests, protected areas, cropland and pastureland. We do not attempt to include the value of urban land and do not have the data necessary to calculate the change of land use. Thus we treat land as fixed in composition and value for each country.
5.1.5. Consolidation: levels and changes in stocks of natural capital
Table 1 indicates the levels and changes in the stocks of the various types of natural capital we have considered.Footnote 21 Interestingly, the value of forests is greater than the value of oil in all but one of the five countries we are considering; Venezuela is the exception. For each country except the US, the total natural capital decreased between 1995 and 2000. In the US, the increase in forest area, especially commercially available forest area, offset the large declines in other forms of natural capital, particularly oil and natural gas. Of the five countries, Venezuela experienced the greatest decline in natural capital during this period, extracting 3.1 per cent of its total measured natural capital.
Natural capital stocks: quantities, prices and values, 1995–2000 (prices in 2000 US$, stock values in 2000 US$ billions)

5.2. Oil capital gains
In calculating the capital gains on stocks of oil, we allow the shadow price of oil to increase by 5 per cent per year over the period 1995–2000. We apply this increase in the shadow price of oil to the initial (year 1995) oil stock. Thus, the overall change in the value of the oil stock is  , where I(t) is the change in the stock from period t − 1 to t and
 is the change in the shadow price over this interval.
The capital gains to owners of oil are higher prices to consumers of oil. Thus, capital gains imply a redistribution of wealth from oil consumers to oil producers. We allocate the reduction to consumers' wealth by taking the world total of capital gains and distributing it as a loss to each country according to that country's share of world oil consumption. We obtain the level of proved oil reserves, oil extraction and oil consumption for nearly every country from the Statistical Review of World Energy (BP, 2005), and calculate the level of oil reserves in 2000 as in equation (24). Oil capital gains are computed from the 2000 level of oil reserves. We use the average oil consumption from 1995 to 2000 divided by the sum over all countries as the measure a country's fraction of world total oil consumption.
5.3. Reproducible capital
The estimated stocks of reproducible capital for the five countries are taken from the data appendix to Klenow and Rodríguez-Clare (Reference Klenow, Rodríguez-Clare, Aghion and Durlauf2005). Our approach to reproducible capital differs from earlier work by World Bank (Reference Bank2006) and by Arrow et al. (Reference Arrow, Dasgupta, Goulder, Daily, Ehrlich, Heal, Levin, Mäler, Schneider, Starrett and Walker2004) by accounting for cross-country ownership. Some of the stock of reproducible capital in a country is owned by investors outside of that country. Correspondingly, some of the reproducible capital outside a given country is owned by the residents of that country. Our notion of sustainability focuses on the changes in the productive base owned by a given country's residents. Thus it is important to consider changes in a country's net asset position.
In the US, net holdings of international assets are reported by the BEA. In developing countries, although capital flows are closely monitored, little work has been done on measuring the accumulated stocks of foreign assets and liabilities. A recent paper by Lane and Milesi-Ferretti (Reference Lane and Milesi-Ferretti2007) provides estimates of net holdings of international assets from balance of payments and other IMF data. We use their estimates in our analysis.
5.4 Human capital
Here we apply the approach to valuing human capital described in subsection 4.3.1. The key empirical inputs include the assumed rate of return on human capital and the level of educational attainment. For all countries we apply a value of 0.085 for the former. For the latter, we use an annual measure of the average years of educational attainment for the adult population from the data appendix of Klenow and Rodríguez-Clare (Reference Klenow, Rodríguez-Clare, Aghion and Durlauf2005). The average educational attainment, measured in years, for the adult population in India increased by an incredible 12 per cent from 1995 to 2000. Brazil, China and the US had smaller increases of 9.7 per cent, 4.1 per cent and 1.4 per cent, respectively. Venezuela was the only country of the five we considered to have a decline in the average education level.
The average amount of human capital per worker is multiplied by the total population of the country that is old enough to have obtained the average level of education. It is important to recognize that all adults, not only those who are currently employed, have human capital. Thus, the total stock of human capital increases if the average level of education increases, or if the number of adults increases. It is for the latter reason that the total human capital stock in Venezuela increased by 12.1 per cent over the period even though the average level of education declined by 0.8 per cent.
The shadow price of a unit of human capital is equal to the discounted sum of the wages it would receive (the rental price) over the expected number of working years remaining. To calculate the rental price for a unit of human capital, we calculate the employed human capital for a country as the average amount of human capital per worker multiplied by the number of workers. This is divided by the total wage bill to obtain a country-specific annual rental price for a unit of human capital. The total wage bill in the US is obtained from the BEA national income accounts.Footnote 22 The total wage bill in China is not reported, so this is calculated from information provided by the 2002 China Statistical Yearbook.Footnote 23 The total wage bill for Brazil, India and Venezuela is calculated as the average wage from the Occupational Wages around the World database, multiplied by the total level of employment.
The expected number of working years remaining is calculated using current age-gender participation and mortality rates. Mortality and labor force participation rates by gender vary considerably by country. We use the year 2000 World Health Organization life tablesFootnote 24 and the 1990 US Census Bureau IDB demographic dataFootnote 25 to calculate the expected number of working years remaining for men and women by age in each country. The discount rate for future wages is set to 0.085. The resulting shadow price of a unit of human capital is greater than US$100,000 for the US and less than US$10,000 for China and India. The large difference in this shadow price is due to differences in the discounted expected earnings potential for workers in different countries.
5.5. Environmental capital
Extraction of natural capital and creation of manufactured wealth results in environmental externalities, such as water and air pollution. These externalities are analogous to a drawdown of wealth. We focus on one type of environmental externality, climate-related damages. Unlike other forms of natural capital, we do not attempt to estimate the total level of the environmental asset (in this case the global atmosphere); rather, we consider only the change in environmental capital.
To apply the procedure described in the previous section, we need data on global emissions of greenhouse gases during the period 1995–2000, as well as on the damage to each of the individual countries associated with these emissions. Note that the damages from these current emissions need not occur during the five-year period: future damages attributable to current emissions (through the impact on future atmospheric concentrations) are relevant to current calculations of changes in wealth. We obtained global CO2 emissions from fossil fuel consumption and manufacturing from the 2007 World Development Indicators data.Footnote 26 CO2 emissions from deforestation were calculated using data from the Food and Agriculture Organization (2006) and Houghton (Reference Houghton2005). Our measure of total CO2 emissions over the 1995–2000 period is 35.5 billion tons and likely underestimates the true emissions over this period as key sectors are not included, and we used conservative estimates of carbon emissions from deforestation.
Following Tol (Reference Tol2009), we assume that the damage from global emissions is US$50 per ton carbon.Footnote 27 We consider alternative values in a sensitivity analysis. Combining the damages-per-ton and emissions data, we arrive at total damages of US$1,840 billion for this five-year period. We allocate these total damages to the five countries using the estimates from Nordhaus and Boyer (Reference Nordhaus and Boyer2000). This study apportions the damages to each country as follows: the US bears 9 per cent of global loss, India bears 5 per cent, Brazil bears 2 per cent, while China and Venezuela both bear less than 1 per cent.
5.6. Overall changes in capital: comprehensive investment
Table 2 consolidates the changes in all of the forms of capital we have considered. As mentioned, in all countries except the US, the overall change in the value of natural capital is negative. Yet comprehensive investment is positive in all countries. In all countries except China, changes in human capital are the most important contributor to comprehensive investment, and these changes outweigh the negative influence of natural capital depletion. In the US, for example, human capital augmentation accounts for about 83 per cent of comprehensive investment – US$4.7 trillion of the US$5.7 trillion billion total.
Components of comprehensive investment (in 2000 US$ billions)

In Venezuela, the largest changes in capital stocks are those relating to natural capital. Despite very large reductions in natural capital, comprehensive investment is positive in this country. This is partly due to sizeable capital gains on oil stocks. Without these capital gains, Venezuela's comprehensive investment would be negative. Perhaps surprising is the result that China enjoys the highest comprehensive investment among the five nations, driven by a 75 per cent increase in reproducible capital over the five-year period.
It should be emphasized that a key element of these calculations is the shadow or accounting price applied to each type of capital. Each shadow price represents the marginal contribution to wellbeing of the given form of capital, and the ratios of the shadow prices are the rates at which the various forms of capital can substitute for one another. If the shadow prices for natural capital, in particular, are too low (high), our results will understate (overstate) the lost wealth from depletion in natural resource stocks. It should also be noted that these calculations do not account for many health-related elements. We discuss this issue further below.
5.7. Accounting for population growth and technological change
We next adjust the changes in comprehensive wealth to account for population growth and technological change. The first column of table 3 reproduces the growth rate of comprehensive wealth from table 2. The second column indicates the annual population growth rate in each country over the interval 1995–2000. Column 3 subtracts this growth rate from the rate in column 1 to arrive at the per capita growth rate of comprehensive wealth.
Growth rates (%) of per capita comprehensive wealth, adjusted for technological change

Note: The TFP growth rate reported in column (4) is obtained from Klenow and Rodriquez-Clare (2005).
We find that Venezuela and Brazil have a negative per capita growth rate of comprehensive wealth. As indicated in column 1, both countries experienced an increase in comprehensive wealth; however, comprehensive wealth did not grow as much as population did. For the US, China and India, we find that comprehensive wealth grew at a more rapid pace than population.
The columns numbered 4 and 5 in table 3 account for technological change. Under the assumptions indicated in section 3.1, the appropriate adjustment for technological change is obtained by adding the TFP growth rate from the initially obtained growth rate of per capita comprehensive wealth. Column 4 reports the TFP growth rate obtained from Klenow and Rodríguez-Clare (Reference Klenow, Rodríguez-Clare, Aghion and Durlauf2005). Column 5 reports the per capita comprehensive wealth growth rate adjusted for TFP growth.
The numbers in column 5 are our ultimate indicators of whether the sustainability criterion is met (without attention to changes in health). According to our calculations, each nation except for Venezuela satisfies the criterion. For comparison, we report the per capita annual GDP growth rate in column 6.
Several of these results may surprise. We estimate a per capita comprehensive growth rate (column 3) that is positive but close to zero for the US. The cost of oil net capital gains due to the large share of world oil consumption is significant for the US. It is the estimated TFP growth that accounts for most of the increase in TFP-adjusted per capita comprehensive wealth.
For China, we estimate a fairly high rate of growth of comprehensive wealth, both overall (column 1) and in per capita terms (column 3). The high growth rate of comprehensive wealth derives in large part from that nation's significant increase in reproducible capital (evaluated at shadow prices) over the period 1995–2000, as shown in table 2. In addition, estimated TFP growth for China is very significant at 2.71 per cent. This also contributes to the high estimate (5.63 per cent) for China's TFP-adjusted per capita comprehensive wealth growth rate (column 5).
India is quite similar to China in that the growth in comprehensive wealth is primarily due to investment in reproducible and human capital. Growth in reproducible capital is lower, population growth in India is higher, and TFP growth is lower than for China. These factors lead to the more moderate estimate (2.70 per cent) for India's TFP-adjusted per capita comprehensive wealth growth rate.
For Brazil, it is the increase in human capital that accounts for nearly all the growth in comprehensive wealth. The minuscule investment in reproducible capital is less than half the loss of natural capital (primarily due to deforestation). Human capital in Brazil is growing at a rate that is only slightly more than the rate of population growth, leading to the result of a loss of per capita comprehensive wealth growth. After adjusting for TFP growth (0.15 per cent), our measure of comprehensive wealth growth is still close to zero, although now slightly positive.
Venezuela had very little investment in human and reproducible capital over the five-year period. The primary growth in comprehensive wealth is due to the estimated increase in scarcity rents for Venezuela's oil. The projected increase in the value of oil is not enough to offset the increase in population. Adding the estimated negative TFP growth yields a significantly negative per capita comprehensive wealth growth rate.
5.8. Health capital considerations
Here we implement a discrete-time version of the approach to valuing health capital described in section 4.4.2. Using the World Health Organization life tables, we calculate the conditional density of age of death for each age and country for the years 2000 and 2005. Data from 1995 are not available, so we assume that the difference in mortality between 2000 and 2005 is equal to the difference in mortality between 1995 and 2000. The value of the health capital for an individual is the expected discounted years of life remaining multiplied by the value of an additional year of life (which is assumed to be independent of age). We use the year 2000 country-specific population and mortality data along with a country-specific estimate of the VSL to calculate h, the value of an additional year of life. We then use the year 2005 mortality data for each country to compute the change in the expected discounted years of life remaining and then multiply this by the country-specific h calculated using the year 2000 data in order to value the change in mortality.
Two assumptions are needed in order to compute the value of h for each country. First, we assume that individuals use a discount rate of 0.05 in valuing future years of life. Second, we assume a VSL for each country. We perform sensitivity analysis to both of these assumptions in section 5.9. We use the EPA estimate for VSL in the US of US$6.3 million in the year 2000. Viscusi and Aldy (Reference Viscusi and Aldy2003) performed a cross-country meta-analysis and concluded that the VSL in other countries is approximately proportional to the 0.6 power of per capita GDP. Thus, for China, Brazil, India and Venezuela, we assume that the VSL is proportional to US$6.3 million at the 0.6 power of the ratio of per capita GDP to the US per capita GDP. This implies a VSL for Brazil of US$2.4 million, for Venezuela of US$2.1 million, for China of US$1.7 million and for India of US$1.3 million.Footnote 28
Given these assumptions, we use the population and mortality data to calculate h, the value of an additional year of life (VSLY) for each country:

This VSLY is the shadow price of a unit of health capital and, like the other shadow prices, is kept constant over the five-year period. As shown in equation (1), the population data π (a) as well as the conditional mortality data  are truncated at 100 years of age. As in section 4.3.2, a is the age of the individual, T is the year of death, and t indicates time in years.
Using year 2005 mortality data, we re-compute the denominator of the right hand side of equation (1) for each country and multiply it by h. Then, by subtracting the VSL for that country, we arrive at the per capita change in the value of health capital.
Note that we are calculating the change in mortality rates from cross-sectional data. Thus, the differences in observed mortality rates reflect historical differences in the environment and in health provision services. The (higher) mortality rate of a 50-year-old relative to a 20-year-old reflects the environmental conditions and health services available to the 50-year-old throughout his lifetime. We use this information to project the mortality rate of a current 20-year-old 30 years in the future; that is, when he reaches 50. To the extent that future environmental conditions or health provision services do not mimic those of the past, our estimates may under- or overstate the actual changes and the estimated changes in health capital. Future improvements in health services imply that our estimates may underestimate health capital. On the other hand, continued environmental deterioration would imply an opposite bias.
Table 4 indicates that over this five-year period, the average health capital of the population (the expected discounted years of life remaining) increased for each of the five countries we considered, reflecting mortality improvements. However, the US actually has the lowest per capita expected discounted years of life remaining of the five countries (rows 1 and 2). This is because the average person in the US is older and faces higher mortality rates. China experienced the most modest mortality improvements, both in percentage and absolute terms.
Per capita health capital and valuation

Note: Health capital is measured as the discounted expected years of life remaining. The value of a statistical life year (VSLY) is the shadow price of a unit of health capital and is calculated as described in the text based on the assumed value of a statistical life (VSL).
In table 5 we present the components of comprehensive investment, including health capital, in per capita terms. For each country, the value of health capital (the level, not the change) is an order of magnitude larger than the combined value of all other forms of capital. For the US, the per capita value of health capital is US$6.3 million (the VSL) as compared to about US$20,000 for natural capital, US$50,000 for reproducible capital, and US$225,000 for human capital. This is an important point, one that is robust to sensitivity analysis. For the US, one would need to assume that the VSL was about one-twentieth the size of the value given in the literature in order for the per capita value of health capital to be similar in value to the other forms of capital. The intuition here is that, on average, Americans own US$6.3 million of health capital each, but only US$0.3 million of all other forms of capital – including human capital.
Per capita components of comprehensive investment including health (in 2000 US$)

What matters for sustainability are the changes in the values of the various forms of capital. According to our estimates, all five nations experience gains in health capital. For all of the countries except Venezuela, the increases in per capita health capital are larger than the per capita change in any other form of capital. For Venezuela, the increase in per capita health capital is smaller than the loss in per capita natural capital.
Accounting for health importantly affects the estimates for the growth rate in per capita comprehensive wealth. Before adjusting for TFP growth, this growth rate is small and positive for each country once health is accounted for. This is because health gains were small and positive for each country and health capital dominates all other forms of capital combined. However, Venezuela would still fail the sustainability criterion due to the negative TFP growth rate estimate.
Displaying the other forms of capital in per capita terms as in table 5 reveals some other interesting features. For example, the natural capital decrease in Venezuela appears much more severe in per capita terms because the population increased by over 10 per cent during the 1995–2000 period. Note also that in the United States, while the loss of natural capital comes to only about US$1,000 dollars per person, the oil capital loss (due to the increase in future prices) is nearly five times that amount.
5.9. Sensitivity analysis
Table 6 displays the sensitivity of our results for per capita comprehensive wealth to important parameters. Panel A of the table indicates that the results are robust to the assumed value of the social cost of carbon. Raising the value to US$100 per ton from our previously employed value of US$50 per ton has only a minor effect on the per capita comprehensive growth rate for each country. In most countries, increases in human and reproducible capital have a considerably larger impact on comprehensive investment than the negative contribution from CO2 emissions. For the US, the social cost of carbon would need to be nearly US$500 per ton of carbon for carbon damages to completely offset the per capita gains in reproducible capital alone, although this would push the growth rate of per capita comprehensive wealth negative before accounting for TFP growth. Note that this assumption has very little effect on China because a relatively small fraction of global carbon damages are allocated to China (Nordhaus and Boyer, Reference Nordhaus and Boyer2000).
Sensitivity analysis: growth rates (%) of per capita comprehensive wealth under alternative assumptions

Panel B focuses on the implications of including or excluding health capital in the calculation of per capita comprehensive wealth. With or without health capital included, China, India and the United States have large growth rates, Brazil has a small growth rate, and Venezuela has a fairly rapid decline in per capita comprehensive wealth. Note that it is the TFP adjustment that preserves these conclusions. Without the TFP adjustment, for Brazil and Venezuela the sign of the growth rate of per capita comprehensive wealth depends on whether health capital is included. The level of health capital is much higher than all the other components of comprehensive wealth combined. As a result, the growth rate of health capital has a significant influence on the growth rate of per capita comprehensive wealth. Without the TFP adjustment, the per capita comprehensive wealth growth rate simply collapses to the per capita health capital growth rate when health capital is included. Health capital swamps all other forms of capital in importance.
Panel C indicates the sensitivity to the discount rate applied to the value of additional years of life from health improvements. Results are not highly sensitive to this rate. Using a higher discount rate slightly lowers the growth rate for per capita comprehensive wealth.
Panel D considers alternative VSLs. Over the range of values considered, there is very little change in the results. Health capital is so much larger than the other forms of capital that its growth rate largely determines the growth rate of all capital (comprehensive wealth) even when the magnitude of human capital is assumed to be smaller through a smaller VSL. For the US, one would need to assume a VSL of less than US$0.7 million for the increase in health capital to approximately equal the increase in reproducible capital. A value this small is far below the range of estimates of VSL in the literature and it would still leave the value of health capital more than twice as large as all other forms of capital combined. One of our main conclusions is that health capital is very large relative to other forms of capital, and that its growth rate largely determines the growth rate of comprehensive wealth.
6. Conclusion
This paper has presented and applied an original framework for determining whether a given nation satisfies a reasonable criterion for sustainability. We define sustainability in terms of the capacity to provide wellbeing to future generations. The indicator of this capacity is a comprehensive measure of wealth – one that includes both marketed and non-marketed assets. The sustainability criterion is satisfied if this comprehensive wealth measure is increasing on a per capita basis.
We advance the theory of growth accounting by providing a consistent framework that incorporates population growth, technological change, human capital and environmental quality. Two additional innovations are the treatment of health as a kind of capital (see section 4.4.2) and the incorporation of the effects of expected capital gains in natural resource stocks arising from the fixity of their supply in the face of continued demand (see section 4.2).
We face significant challenges in applying the theory empirically. Despite the significant uncertainties, we are able to arrive at empirical estimates which, in our view, provide meaningful insights as to the extent to which various countries have achieved sustainability. Even before accounting for improvements in health, our results show that the United States, China, India and Brazil are currently meeting the sustainability criterion, although Brazil meets the requirement by a narrow margin. Venezuela fails to meet this requirement as a result of substantial depletion of natural capital and negative estimated TFP growth. In the United States and India, investments in human capital prove to be very important contributors to increases in per capita wealth; in China, investments in reproducible capital dominate. Accounting for improvements in health dramatically affects the estimates of changes in per capita wealth. We estimate the value of health capital to be more than twice as large as all other forms of capital combined. As a result, health capital's growth rate largely determines the growth rate of comprehensive wealth.
Many limitations remain in our approach. On the theoretical side, the analysis of health capital is an innovation that will require much further study to understand. The results so far suggest that health capital magnitudes and their changes swamp other considerations. It is very likely that this is an important observation, but it has not yet been embodied into a persuasive theoretical framework to clarify its significance. We must therefore consider the results on health capital to be suggestive and an invitation to future research.
Three empirical issues deserve mention as well. First, the validity of the empirical results on sustainability and wealth measurement is constrained by the severe limits of the available data. Measurement of most of the variables comes from surveys and reports of varying degrees of reliability and conceptual consistency. These limits hold even for the quantity variables but even more severely for the shadow prices. Thus, we make human capital depend only on education, although it is well established that it also depends on work experience and on conditions of family upbringing. Health capital is measured only by mortality (one of the more reliable figures), but satisfaction from health depends on the length of illnesses and on the degree of comfort and functionality brought about by medical treatment and by changes in the provision of public goods (e.g., accessibility requirements).
Second, the aggregation of various kinds of consumption and capital goods, though common throughout macroeconomic analysis, may give rise to biases of unknown magnitude. These problems may be especially important in measurement of TFP, which plays a significant role in our results.
Third, it should be recognized that the analysis was devoted to the development of productive capacity over time for a given nation. It was not immediately intended to make comparisons among nations, though it is clearly relevant to that purpose. In particular, the comparisons of VSL and therefore health capital per capita across countries cannot be taken to be definitive.



