1 Introduction
Richtmyer–Meshkov (RM) instability develops when an initially corrugated interface separating two fluids with different densities experiences an impulsive acceleration excited by a shock wave. At the beginning, the initial perturbation grows linearly until its amplitude is comparable to the wavelength. Then, nonlinear and secondary instabilities appear along the fingering structures of deformed interface, and eventually the interface evolution enters into a state of turbulent mixing. The pioneering work on RM instability was conducted theoretically by Richtmyer (Reference Richtmyer1960) and then confirmed experimentally by Meshkov (Reference Meshkov1969). Since that time, this instability has been extensively studied owing to its significance in many fields, such as inertial confinement fusion (ICF) (Lindl et al. Reference Lindl, Landen, Edwards, Moses and Team2014), compressible turbulence (Dimotakis Reference Dimotakis2005) and supersonic combustion (Yang, Kubota & Zukoski Reference Yang, Kubota and Zukoski1993). Over the past decades, fruitful progress has been made in simulations, experiments and theories (Zabusky Reference Zabusky1999; Brouillette Reference Brouillette2002; Ranjan, Oakley & Bonazza Reference Ranjan, Oakley and Bonazza2011; Zhou Reference Zhou2017; Zhai et al. Reference Zhai, Zou, Wu and Luo2018b ). Until the present time, most previous researches have focused on the planar case for its easy implementation. However, it is known that this instability often takes place in curved geometry in various applications, e.g. the ICF, in which the RM instability induced by converging shock plays a crucial role in the performance degradation of spherical implosions (Lindl et al. Reference Lindl, Landen, Edwards, Moses and Team2014).
Generation of a converging shock wave is the basis for the study of converging RM instability and it is difficult to realize in an ordinary shock tube. The first feasible generation of a cylindrical converging shock wave was achieved by Perry & Kantrowitz (Reference Perry and Kantrowitz1951) using a horizontal shock tube. Later, different shock tubes were developed to observe the converging shocks in two groups independently (Takayama, Kleine & Grönig Reference Takayama, Kleine and Grönig1987; Apazidis & Lesser Reference Apazidis and Lesser1996; Hosseini & Takayama Reference Hosseini and Takayama2010). Dimotakis & Samtaney (Reference Dimotakis and Samtaney2006) proposed a gas lens method to generate a converging shock, which was further generalized by Vandenboomgaerde & Aymard (Reference Vandenboomgaerde and Aymard2011) and Vandenboomgaerde et al. (Reference Vandenboomgaerde, Rouzier, Souffland, Biamino, Jourdan, Houas and Mariani2018). Zhai et al. (Reference Zhai, Liu, Qin, Yang and Luo2010, Reference Zhai, Si, Luo, Yang, Liu, Tan and Zou2012) reported a method based on shock dynamics theory to obtain a cylindrical shock transformed from a planar one. The early-time growth of RM instability was investigated in cylindrical and spherical imploding geometries (Bell Reference Bell1951; Plesset Reference Plesset1954; Mikaelian Reference Mikaelian2005; Lombardini & Pullin Reference Lombardini and Pullin2009). Subsequently, Lombardini, Pullin & Meiron (Reference Lombardini, Pullin and Meiron2014a ,Reference Lombardini, Pullin and Meiron b ) presented the flow description, instability growth and late-time turbulent mixing induced by the converging RM instability in spherical implosions. Youngs & Williams (Reference Youngs and Williams2008) also performed monotone integrated LES of turbulent mixing in spherical geometry. Thomas & Kares (Reference Thomas and Kares2012) considered the three-dimensional mixing process driven by ICF implosion using a Godunov solver. Ortega et al. (Reference Ortega, Lombardini, Barton, Pullin and Meiron2015) presented a detailed study on instability that develops at the interface between a shell of elastic-plastic material and a cylindrical core of confined gas during the implosive motion generated by a shock wave. Recently, a semi-annular shock tube was developed (Luo et al. Reference Luo, Ding, Wang, Zhai and Si2015) and the convergent RM instability was measured in this facility from early to late stage before the reshock (Ding et al. Reference Ding, Si, Yang, Lu, Zhai and Luo2017). They concluded that the flow compressibility was significant under the converging condition.
Previous work mainly considered the instability of a perturbed interface impacted by a uniform converging shock. However, in real ICF environments, the non-uniform laser irradiation and the target surface roughness may yield a perturbed shock prior to its impingement on the material interface (Endo et al.
Reference Endo, Shigemori, Azechi, Nishiguchi, Mima, Sato, Nakai, Nakaji, Miyanaga, Matsuoka, Ando, Tanaka and Nakai1995; Lindl et al.
Reference Lindl, Landen, Edwards, Moses and Team2014). As a variant of the standard RM instability (instability of a perturbed interface subjected to a uniform shock), the instability of a uniform interface impacted by a deformed shock was seldom studied. Ishizaki et al. (Reference Ishizaki, Nishihara, Sakagami and Ueshima1996) first performed a numerical study on the instability of a planar interface driven by a non-uniform shock wave. It was found that the deformed shock front oscillates and decays as it propagates. The growth rate of interface perturbation sensitively depends on the phase of the oscillating shock at the impact moment. They concluded that properties of this instability exhibit differences from those of the standard RM instability in both linear and nonlinear stages. Subsequently, Ishizaki & Nishihara (Reference Ishizaki and Nishihara1997) proposed an analytical model to predict the motion of a deformed shock induced by non-uniform laser ablation, and the theoretical results were in good agreement with experimental data. Matsui et al. (Reference Matsui, Mima, Honda and Nishiguchi1999) investigated the behaviour of a corrugated ablation surface and deformed shock wave propagation utilizing a perturbation analysis of the fluid equation. Recently, Mostert et al. (Reference Mostert, Pullin, Samtaney and Wheatley2018a
,Reference Mostert, Pullin, Samtaney and Wheatley
b
) theoretically analysed the singularity formations of a perturbed shock using an approximate method of geometrical shock dynamics in planar and convergent configurations, respectively. In addition, Zou et al. (Reference Zou, Liu, Liao, Zheng, Zhai and Luo2017) presented an experiment associated with a non-planar shock hitting a flat
 $\text{air}/\text{SF}_{6}$
interface in a shock tube facility. The non-planar shock was generated by diffracting a planar incident shock around a rigid cylinder. Through equating the pre-interface disturbance of the deformed shock with a pre-shock perturbation of a corrugated interface, the growth rate of this instability was observed to be noticeably smaller than that of the standard RM instability. Similar shock-tube experiments on an
 $\text{air}/\text{SF}_{6}$
interface were reported with multiple rigid cylinders used to diffract a uniformly incident shock in the planar case by Zhai et al. (Reference Zhai, Liang, Liu, Ding, Luo and Zou2018a
) and in converging geometry by Liang et al. (Reference Liang, Ding, Zhai, Si and Luo2017). They confirmed that the interface evolution is influenced by the cylinder number and the distance between adjacent cylinders. By treating the experimental post-shock perturbation of the interface as the initial interface perturbation, they proposed a modified model to predict the perturbation growth rate. Furthermore, Zhang et al. (Reference Zhang, Wu, Zou, Zheng, Li, Luo and Ding2018) numerically investigated the Mach number effect on the development of a planar
 $\text{N}_{2}/\text{SF}_{6}$
interface subjected to a sinusoidal deformed shock wave through high-resolution simulation. The role of the impulsive perturbation in the non-standard RM instability was predicted by an empirical formula combined with the model of Ishizaki et al. (Reference Ishizaki, Nishihara, Sakagami and Ueshima1996). More recently, Liao et al. (Reference Liao, Zhang, Chen, Zou, Liu and Zheng2019) experimentally studied the evolution of a uniform interface subjected to a perturbed planar shock using a vertical shock tube. They reported that the amplitude growth rate of the shocked interface decreases with increasing Atwood number, which is fundamentally different from the results related to the standard RM instability. Also, Zhou (Reference Zhou2017) has specially addressed this non-standard RM instability. However, a detailed explanation together with a suitable theoretical model was absent. Therefore, the studies on the non-standard RM instability are limited and little attention has been paid to this instability in the converging configuration, especially to the quantitative analysis on its physical mechanism, which motivates the present study.
In this work, we aim to simulate the interaction of a diffracted convergent shock with an unperturbed interface. The diffracted convergent shock is produced by diffracting a cylindrically uniform shock over a rigid cylinder. As a follow-up consideration of Liang et al. (Reference Liang, Ding, Zhai, Si and Luo2017), with varying deformed converging shock in experiments, the present work will numerically study the RM instability with varying interface gas species. Four interfaces with different gas pairs are considered and the corresponding wave patterns and flow morphologies of evolution process will be identified. Interface amplitudes and growth rates for all cases will be obtained and compared with the theoretical values. Moreover, underlying mechanisms on the non-standard instability in a convergent geometry will be addressed separately.
2 Numerical methodology and validation
2.1 Numerical method and physical model
In this work, we mainly investigate the incident process of the instability development before the incident shock waves focus at the geometrical centre, thus the influences of heat transfer, viscosity and molecular mixing can be ignored. The two-dimensional compressible Euler equations are adopted as the governing equations, which can be written in conservation form as follows:
 $$\begin{eqnarray}\left.\begin{array}{@{}c@{}}\displaystyle \frac{\unicode[STIX]{x2202}\unicode[STIX]{x1D70C}}{\unicode[STIX]{x2202}t}+\frac{\unicode[STIX]{x2202}\unicode[STIX]{x1D70C}u_{j}}{\unicode[STIX]{x2202}x_{j}}=0,\\ \displaystyle \frac{\unicode[STIX]{x2202}\unicode[STIX]{x1D70C}u_{i}}{\unicode[STIX]{x2202}t}+\frac{\unicode[STIX]{x2202}\unicode[STIX]{x1D70C}u_{j}u_{i}}{\unicode[STIX]{x2202}x_{j}}+\frac{\unicode[STIX]{x2202}p}{\unicode[STIX]{x2202}x_{i}}=0,\\ \displaystyle \frac{\unicode[STIX]{x2202}E}{\unicode[STIX]{x2202}t}+\frac{\unicode[STIX]{x2202}(E+p)u_{j}}{\unicode[STIX]{x2202}x_{j}}=0.\end{array}\right\}\end{eqnarray}$$
Here,
 $i$
and
 $j$
represent the
 $i$
and
 $j$
directions, respectively. The
 $\unicode[STIX]{x1D70C}$
,
 $u_{k}$
and
 $p$
denote the density, velocity and pressure, respectively.
 $E$
is the total energy per unit volume. The energy
 $E$
and pressure
 $p$
are related by,
 $$\begin{eqnarray}E=\frac{p}{\unicode[STIX]{x1D6FE}-1}+\frac{1}{2}\unicode[STIX]{x1D70C}u_{i}u_{i},\end{eqnarray}$$
where
 $\unicode[STIX]{x1D6FE}$
is the ratio of specific heats.
The equations are discretized on a Cartesian mesh, and numerically integrated using the second-order unsplit Godunov method (Colella Reference Colella1990). At the complex solid boundaries, which are implicitly represented by a level-set function, the solution is extrapolated from the physical fluid domain to the ghost fluid domain by a multi-stage algorithm. It starts by predicting the solutions on the ghost fluid domain using the multidimensional partial differential extrapolating algorithm (Aslam Reference Aslam2004), then performs the correction step by the inverse distance weighting interpolation method (Franke Reference Franke1982). The adaptive mesh refinement (known as AMR) technique is adopted to improve the solution accuracy while maintaining a moderate total mesh size. The numerical scheme is implemented under a Chombo framework (Adams et al. Reference Adams, Colella, Graves, Johnson, Johansen, Keen, Ligocki, Martin, McCorquodale and Modiano2014), which utilizes the block-based embedded boundary method to solve the compressible Euler equations. In previous work (Al-Marouf & Samtaney Reference Al-Marouf and Samtaney2017), the physical model and numerical algorithm are extensively validated against experimental results and verified against other numerical results, and exhibit a good performance and reliability.
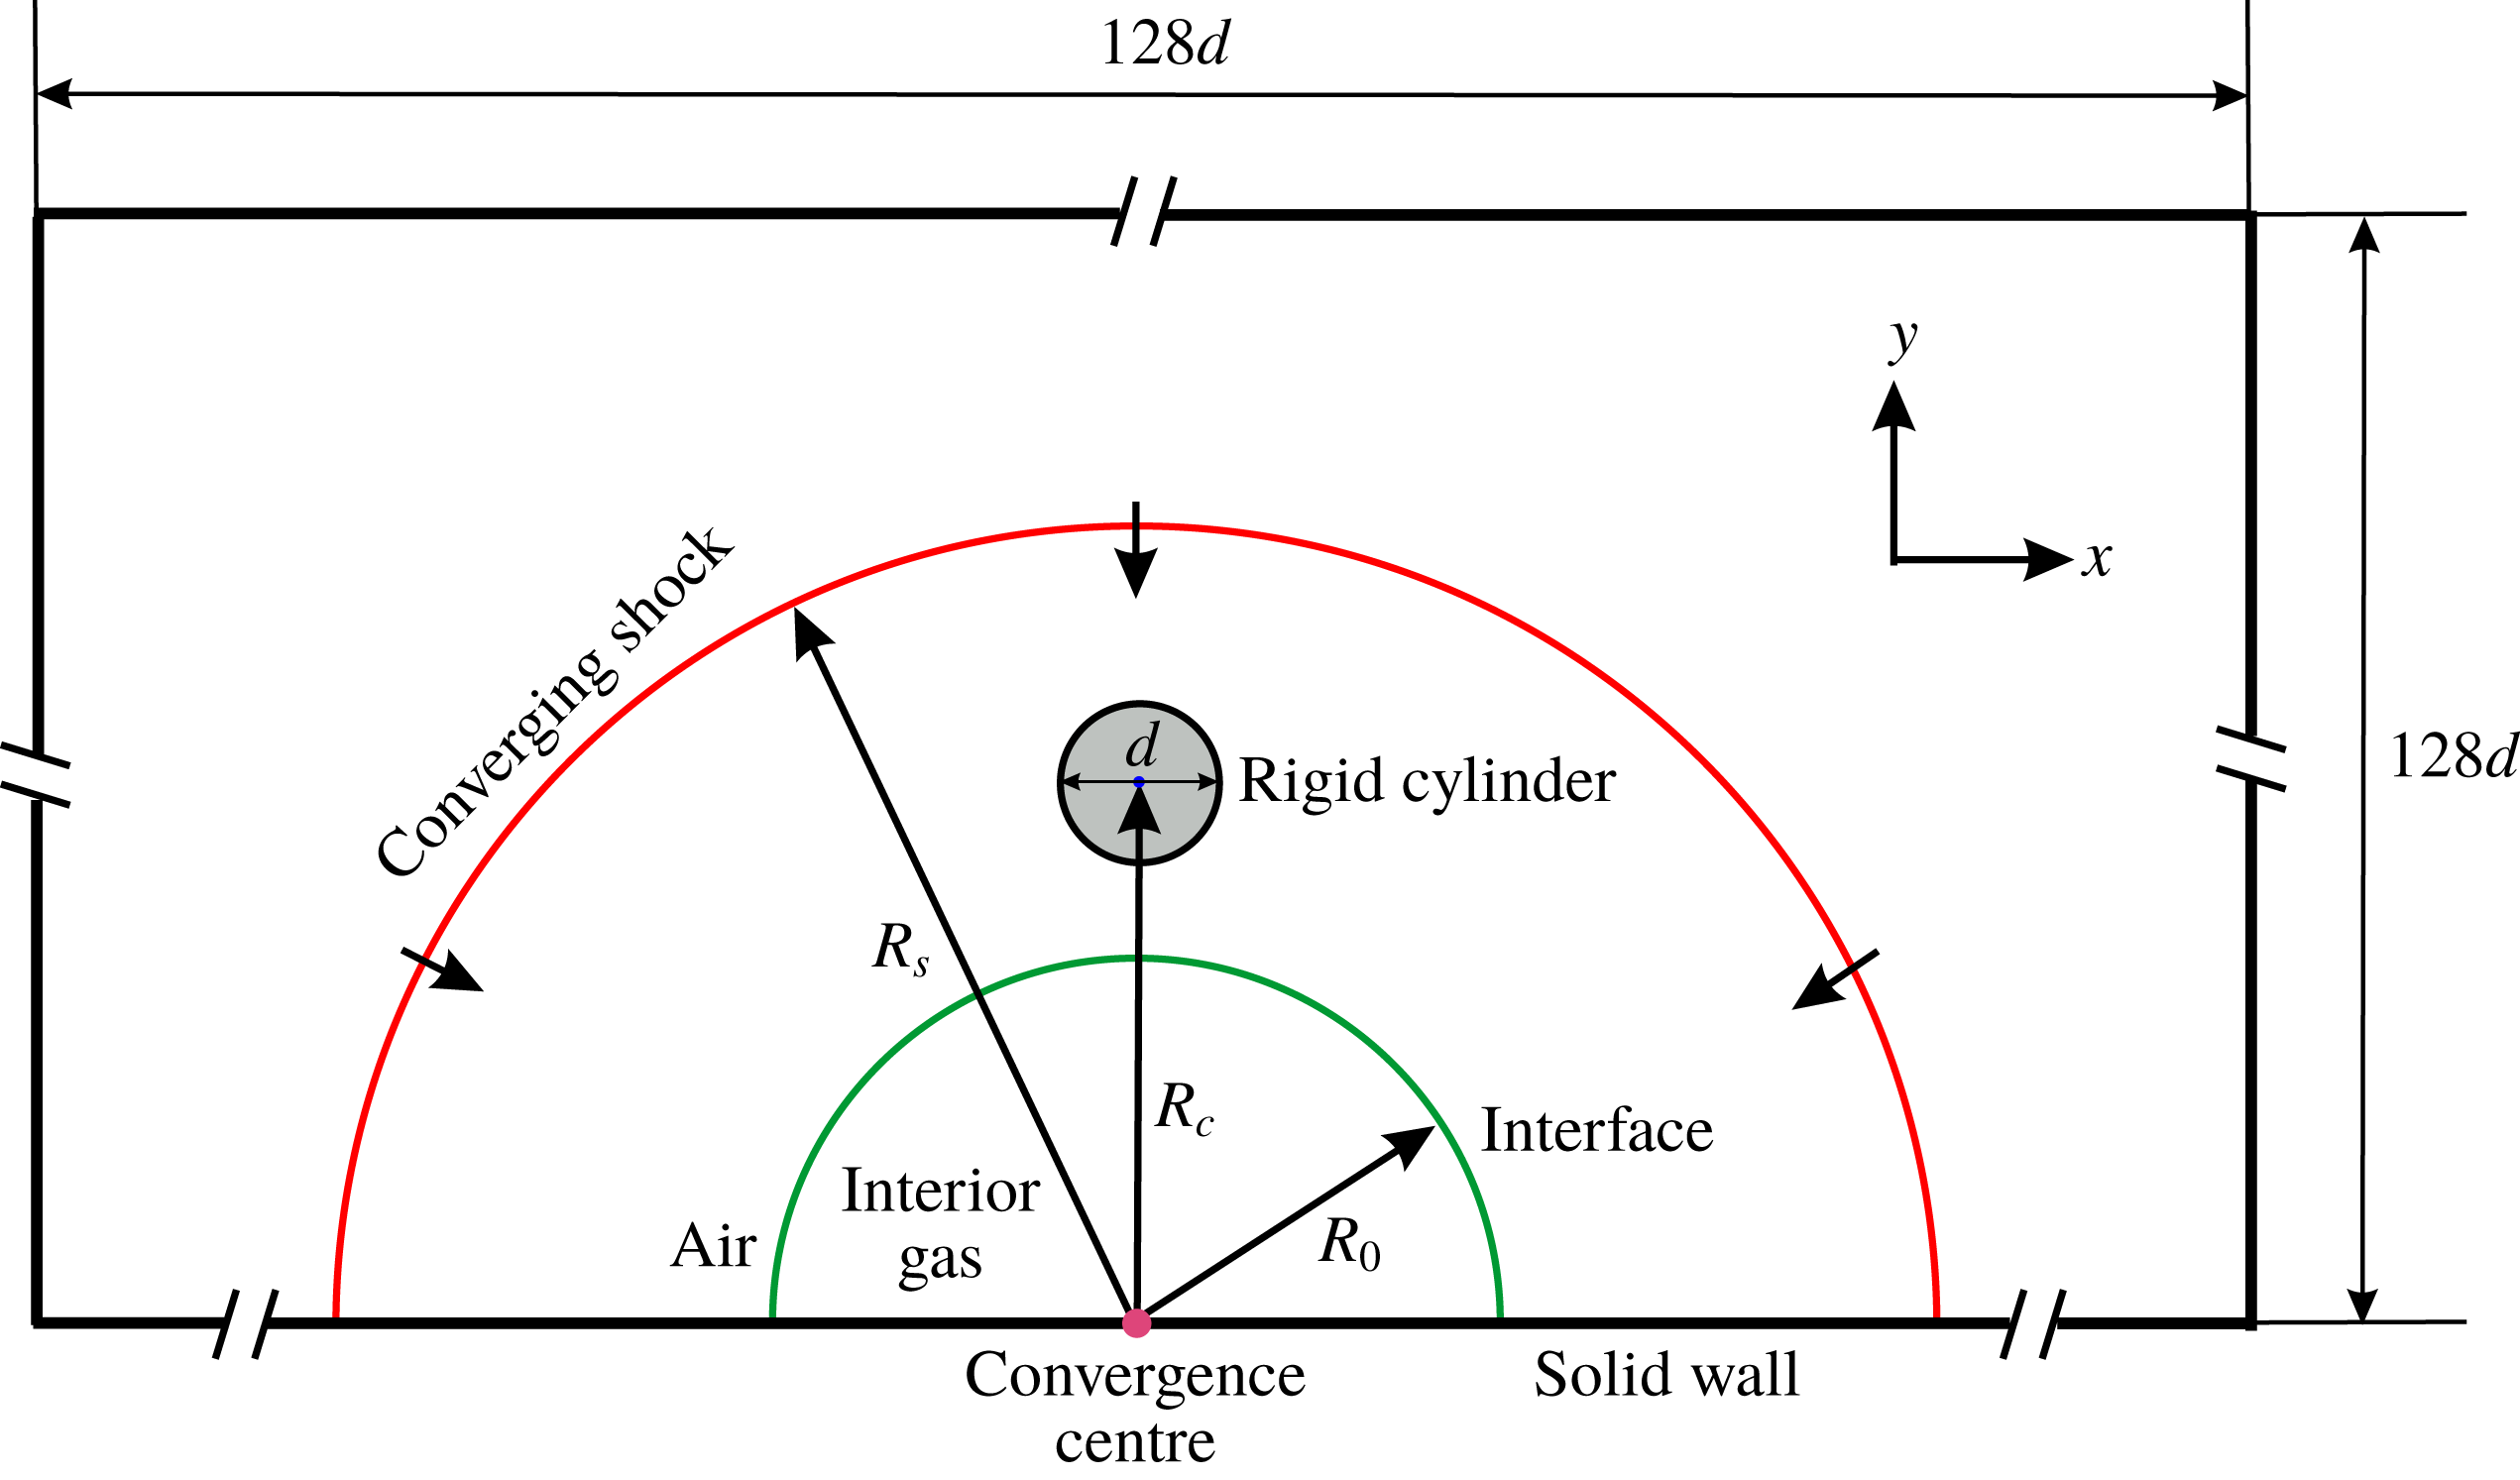
Figure 1 depicts the initial computational set-up for the evolution of a uniform interface accelerated by a cylindrically converging diffracted shock. Four cases with different gas species are considered to explore the Atwood number effect on the perturbation growth. The detailed initial conditions are listed in table 1. The specific heat ratio
 $\unicode[STIX]{x1D6FE}$
for all of the gases used in the present study is listed. Here
 $A$
is the pre-shock Atwood number defined as
 $A=(\unicode[STIX]{x1D70C}_{2}-\unicode[STIX]{x1D70C}_{1})/(\unicode[STIX]{x1D70C}_{2}+\unicode[STIX]{x1D70C}_{1})$
with
 $\unicode[STIX]{x1D70C}_{1}$
and
 $\unicode[STIX]{x1D70C}_{2}$
being the densities outside and inside the interface, respectively. For comparison with the previous experimental work in a semi-annular shock tube (Liang et al.
Reference Liang, Ding, Zhai, Si and Luo2017), a uniformly cylindrical interface is initially placed with a radius of
 $R_{0}=25$
mm. The incident shock wave is produced with a radius of
 $R_{s}=85$
mm. The initial post-shock quantities are calculated based on the Rankine–Hugoniot relation. The centre of a rigid cylinder is placed at a position of
 $R_{c}=35$
mm with the cylinder diameter
 $d=10$
mm. As the simulation starts, with the initial Mach number
 $Ma=1.22$
under the conditions of a temperature of 283 K and pressure of 101 325 Pa, the strength of cylindrically incident shock is augmented gradually as it converges. After the diffraction of the rigid cylinder, a non-uniformly converging shock is generated. Based on Chester–Chisnell–Whitham relations (Chester Reference Chester1954; Chisnell Reference Chisnell1957; Whitham Reference Whitham1957), the strength of converging shock Ma increases to 1.34 at the moment of the shock meeting the interface, which is consistent with the experimental value (Liang et al.
Reference Liang, Ding, Zhai, Si and Luo2017).
Computational set-up of a converging shock impacting a rigid cylinder and a cylindrical uniform interface successively.
 $R_{s}$
,
 $R_{c}$
and
 $R_{0}$
are the distances from the convergence centre to the initially incident shock, to the centre of the rigid cylinder and to the initially uniform interface, respectively. Here
 $d$
is the diameter of the rigid cylinder.

Numerical set-up of four cases with different gas species, including gas pairs (exterior gas/interior gas), the specific heat ratio
 $\unicode[STIX]{x1D6FE}$
of interior gas, the pre-shock Atwood number
 $A$
, the initially incident shock Mach number
 $Ma$
, initial radii of the shock wave (
 $R_{s}$
), the centre of the rigid cylinder (
 $R_{c}$
) and the interface (
 $R_{0}$
). The
 $\unicode[STIX]{x1D6FE}$
of the exterior gas (air) is
 $1.399$
.

During the simulation, a computational domain of
 $128d\times 128d$
is used to avoid any reflected waves from the boundaries of the physical domain. The computational domain has a free-slip solid wall at the bottom, in which a Dirichlet boundary condition is imposed for the normal velocity component whereas the Neumann boundary condition is imposed for the tangent component. Open free boundary conditions are employed on the upper, left and right side domain boundaries by imposing the Neumann boundary condition for both velocity components. A Neumann boundary condition is also satisfied by the density and pressure at all physical domain boundaries which is obtained by assuming a thermally insulated computational domain. In addition, a no-penetration free-slip boundary condition is imposed at the surface of the rigid cylinder.
2.2 Numerical validation and verification
To validate the numerical method on the RM instability, we first follow the experimental configuration by Liang et al. (Reference Liang, Ding, Zhai, Si and Luo2017) and compare the numerical results here with the experimental ones.
For the numerical set-up, the resolution of the base mesh for the computational domain is
 $512\times 512$
, which gives a coarse spacing of
 $h_{c}=d/4$
for the base mesh. The mesh is refined based on the magnitude of the density gradient. To examine the effect of grid convergence, three different refinement ratio sets are introduced,
 $r_{1}=(4,4,4)$
,
 $r_{2}=(2,4,4,4)$
and
 $r_{3}=(4,4,4,4)$
. These refined grids are denoted by grid A, grid B and grid C, respectively, starting from coarse to fine.
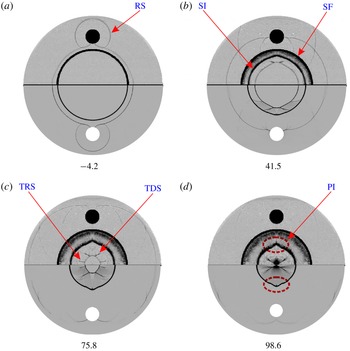
First we compare the evolving flow dynamics between numerical studies and experiments via the schlieren images. Since all three grids provide quite similar performance, only the results of grid B are plotted versus experiment, in figure 2. The initial time is defined as the instant when the incident shock meets the uniform interface. Qualitatively, it is easily found that the numerical images reproduce nearly all features of wave pattern and interface morphology as observed in the experiment and good agreement is achieved between them.
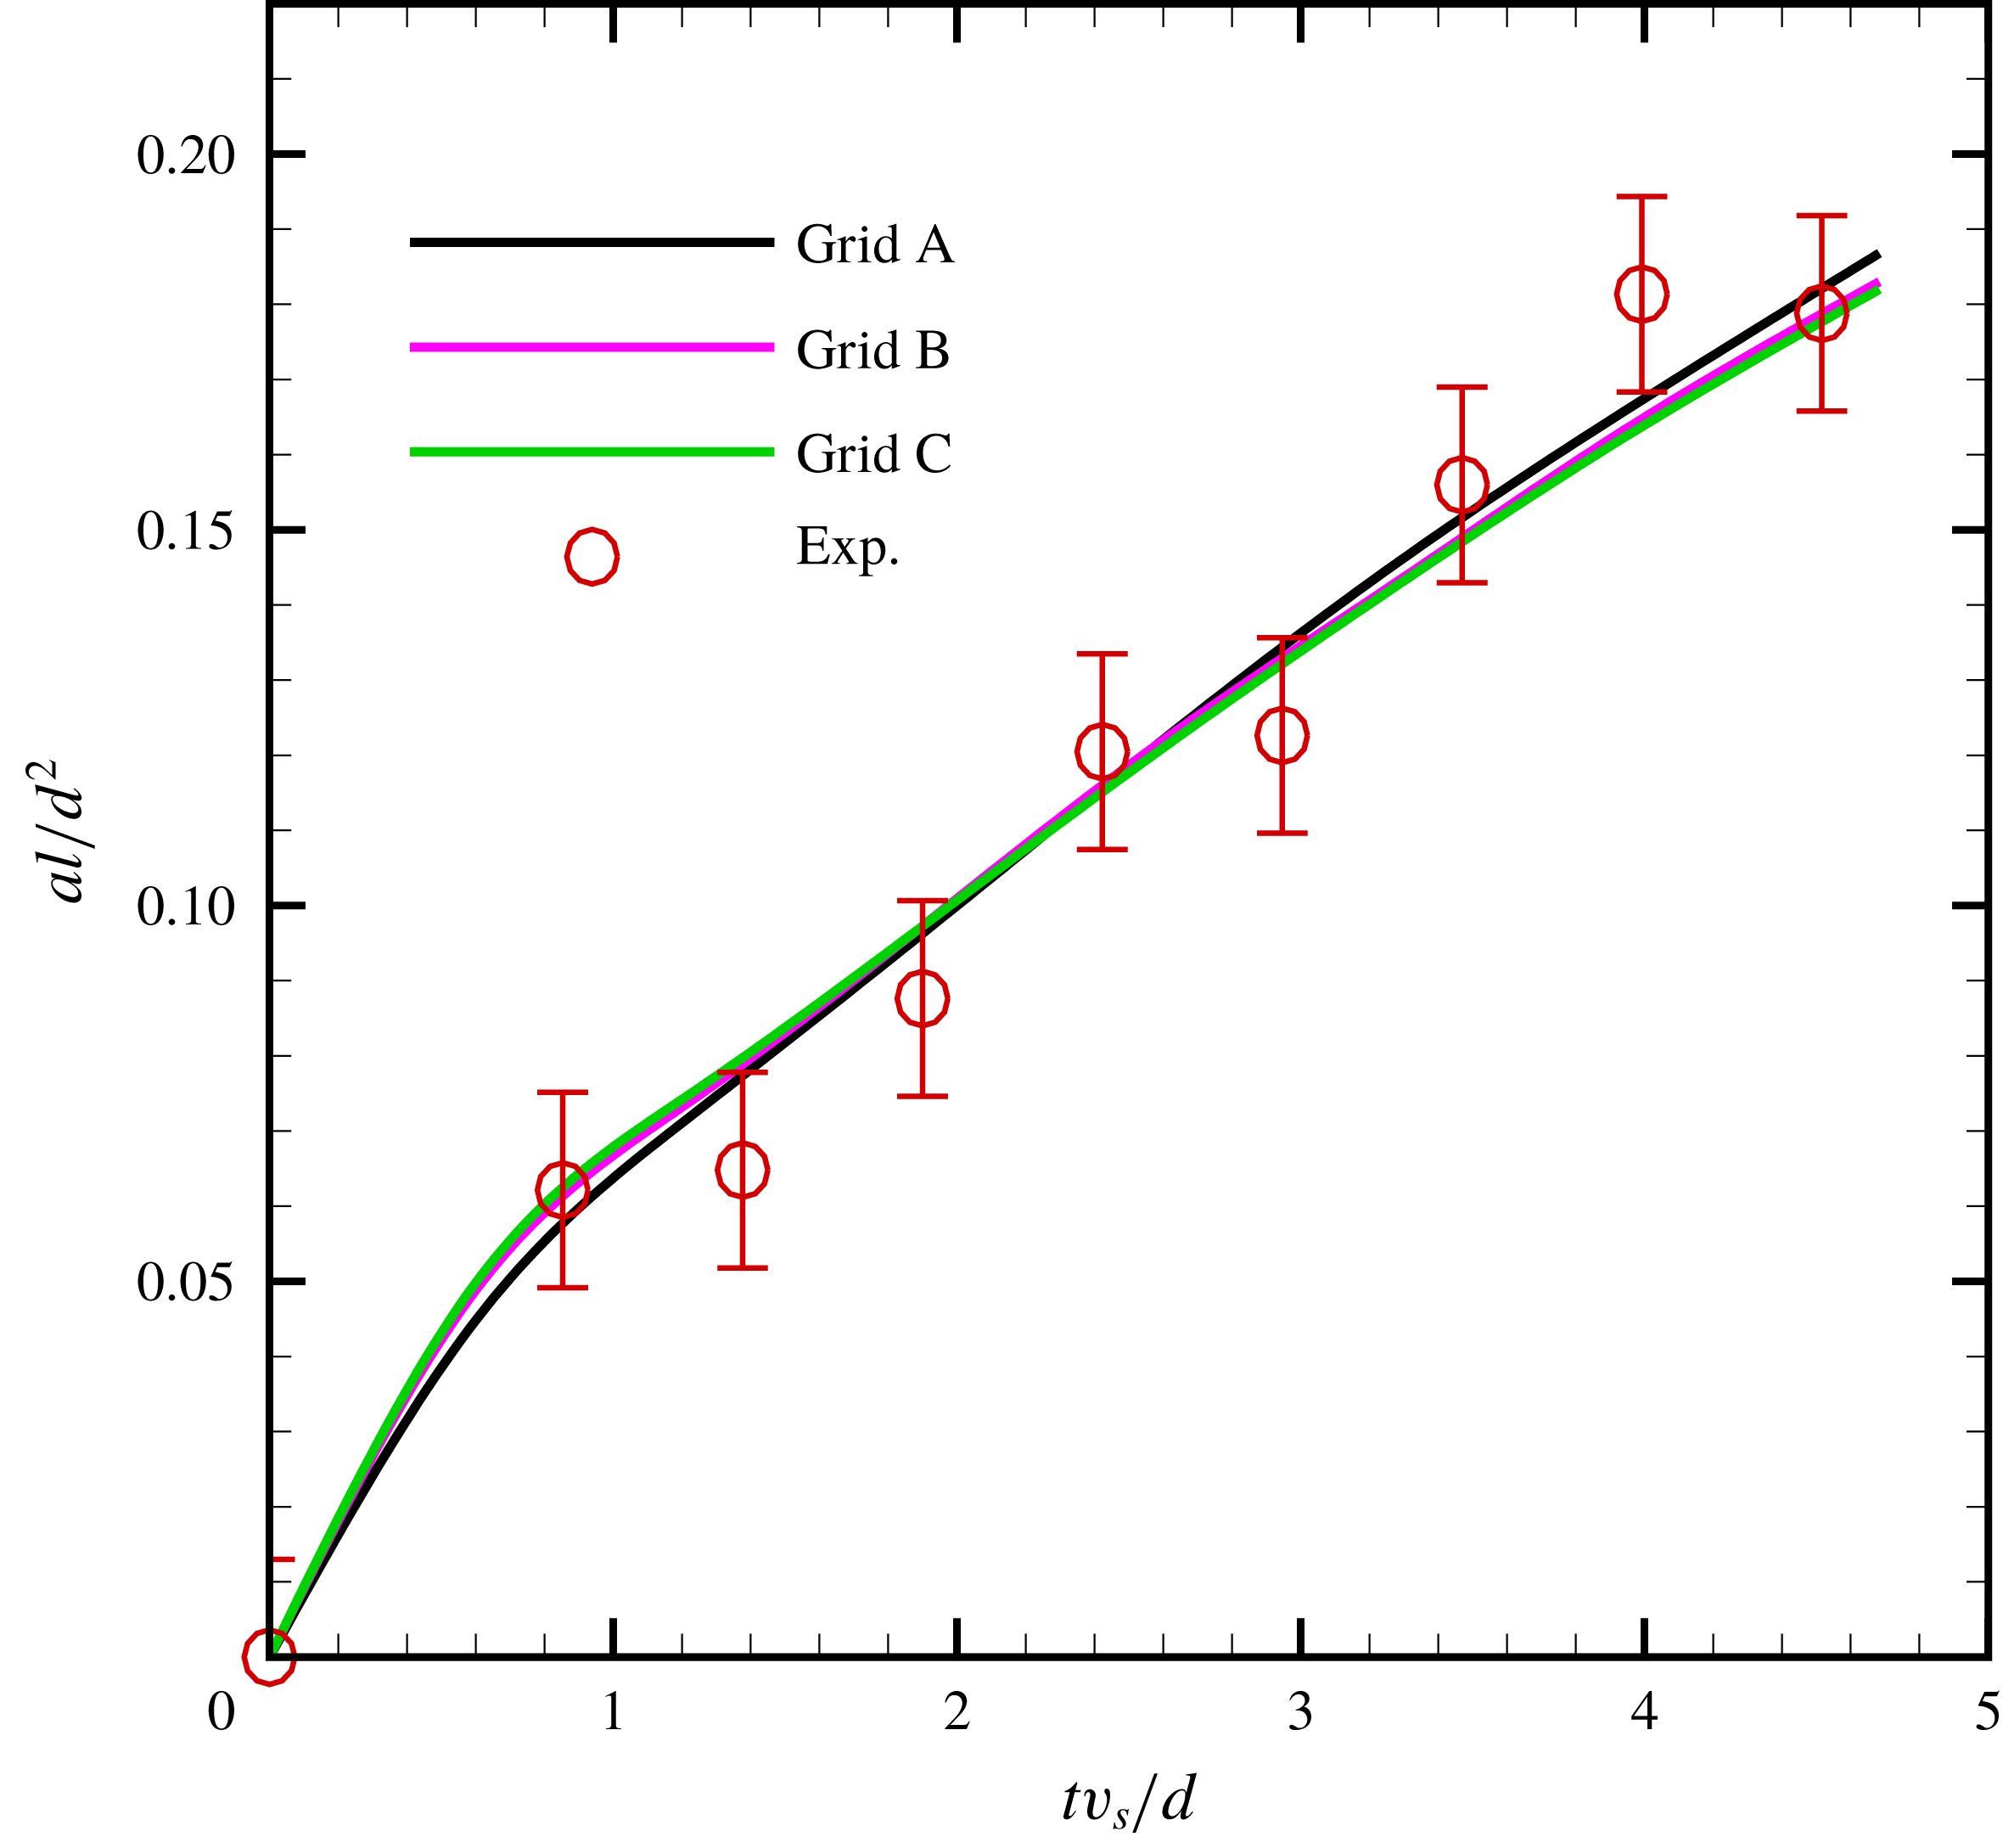
Furthermore, figure 3 presents the comparison of amplitude variations between experiment and simulations with three different refined grids mentioned above. It is easily seen that the numerical amplitudes of the three cases converge for mesh sizes corresponding to grids B and C. Therefore, in order to ensure the accuracy and meanwhile minimize the computational cost, the refinement ratio set
 $r=(2,4,4,4)$
is adopted in this work. For this adopted refinement ratio, the resulting mesh spacing in the finest level is
 $h_{f}=d/512$
, and the effective mesh resolution is
 $16384\times 16384$
. We emphasize that in this early stage of figure 3, the agreement between experiment and simulation is fairly good. It should be noted that for present non-standard RM instability, the initial interface is uniform (perturbation amplitude is zero), thus immediately after the impact of incident shock, the interface amplitude starts to increase monotonically. As the incident converging shock moves inwards close to the centre, a small difference emerges which may lie in the integrated effect of schlieren technique in experiment. Overall, the comparison indicates that the numerical results fall within the error bars of the experiments and, therefore, further validates the current numerical method.
Comparison of experimental (a,b) and numerical (c,d) schlieren images of cylindrically uniform
 $\text{air}/\text{SF}_{6}$
interface impacted by converging shock wave. RS, reflected shock; SI, shocked interface; SF, support frame installed for creating the initial interface, which only exists in the experimental image; TRS, transmitted shocks from the reflected shock across the interface; TDS, transmitted shocks from the diffracted shock across the interface; PI, perturbed interface. The numbers for the images are in units of
 $\unicode[STIX]{x03BC}\text{s}$
.

Grid convergence study and comparison of numerical and experimental amplitudes. Numerical results are obtained based on three different grid resolutions denoted by the letters A, B and C. The red circles represent the experimental amplitudes acquired in previous work (Liang et al.
Reference Liang, Ding, Zhai, Si and Luo2017). The amplitude is labelled as
 $a$
and time is
 $t$
. The spatial and temporal scales are defined as
 $d^{2}/l$
and
 $d/v_{s}$
, respectively, where
 $l=R_{c}-R_{0}$
is the distance between the initial interface and centre of the rigid cylinder, and
 $v_{s}$
is the initial velocity of the incident shock wave.

Note that in the experiment (Liang et al. Reference Liang, Ding, Zhai, Si and Luo2017), compared with the height of the initially cylindrical interface (5 mm) between two Plexiglas plates, the height of the two support frames (0.2 mm) mounted on the two plates for creating the initial interface is negligibly small. Moreover, shortly after the impact of diffracted convergent shock, the interface will move away from the support frame very soon. Thus, the effect on the interface evolution caused by the support frame is of little importance, which has been analysed and confirmed in our previous works (Luo et al. Reference Luo, Ding, Wang, Zhai and Si2015; Ding et al. Reference Ding, Si, Yang, Lu, Zhai and Luo2017; Liang et al. Reference Liang, Ding, Zhai, Si and Luo2017).
3 Results and discussion
3.1 Propagation of the diffracted convergent shock
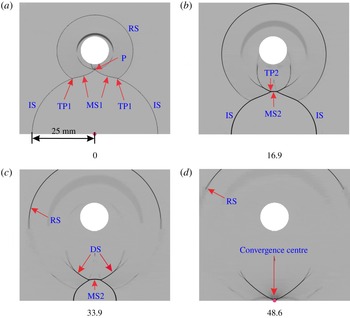
Typical schlieren images showing the wave patterns after the cylindrically converging shock wave diffracts around a rigid cylinder. The incident shock propagates from the periphery to the convergence centre. IS, Incident shock; RS, reflected shock; MS, Mach stem; TP, triple point; DS, diffracted shock; P is the intersecting point of two MS1. The numbers for the schlieren images are given in
 $\unicode[STIX]{x03BC}\text{s}$
.

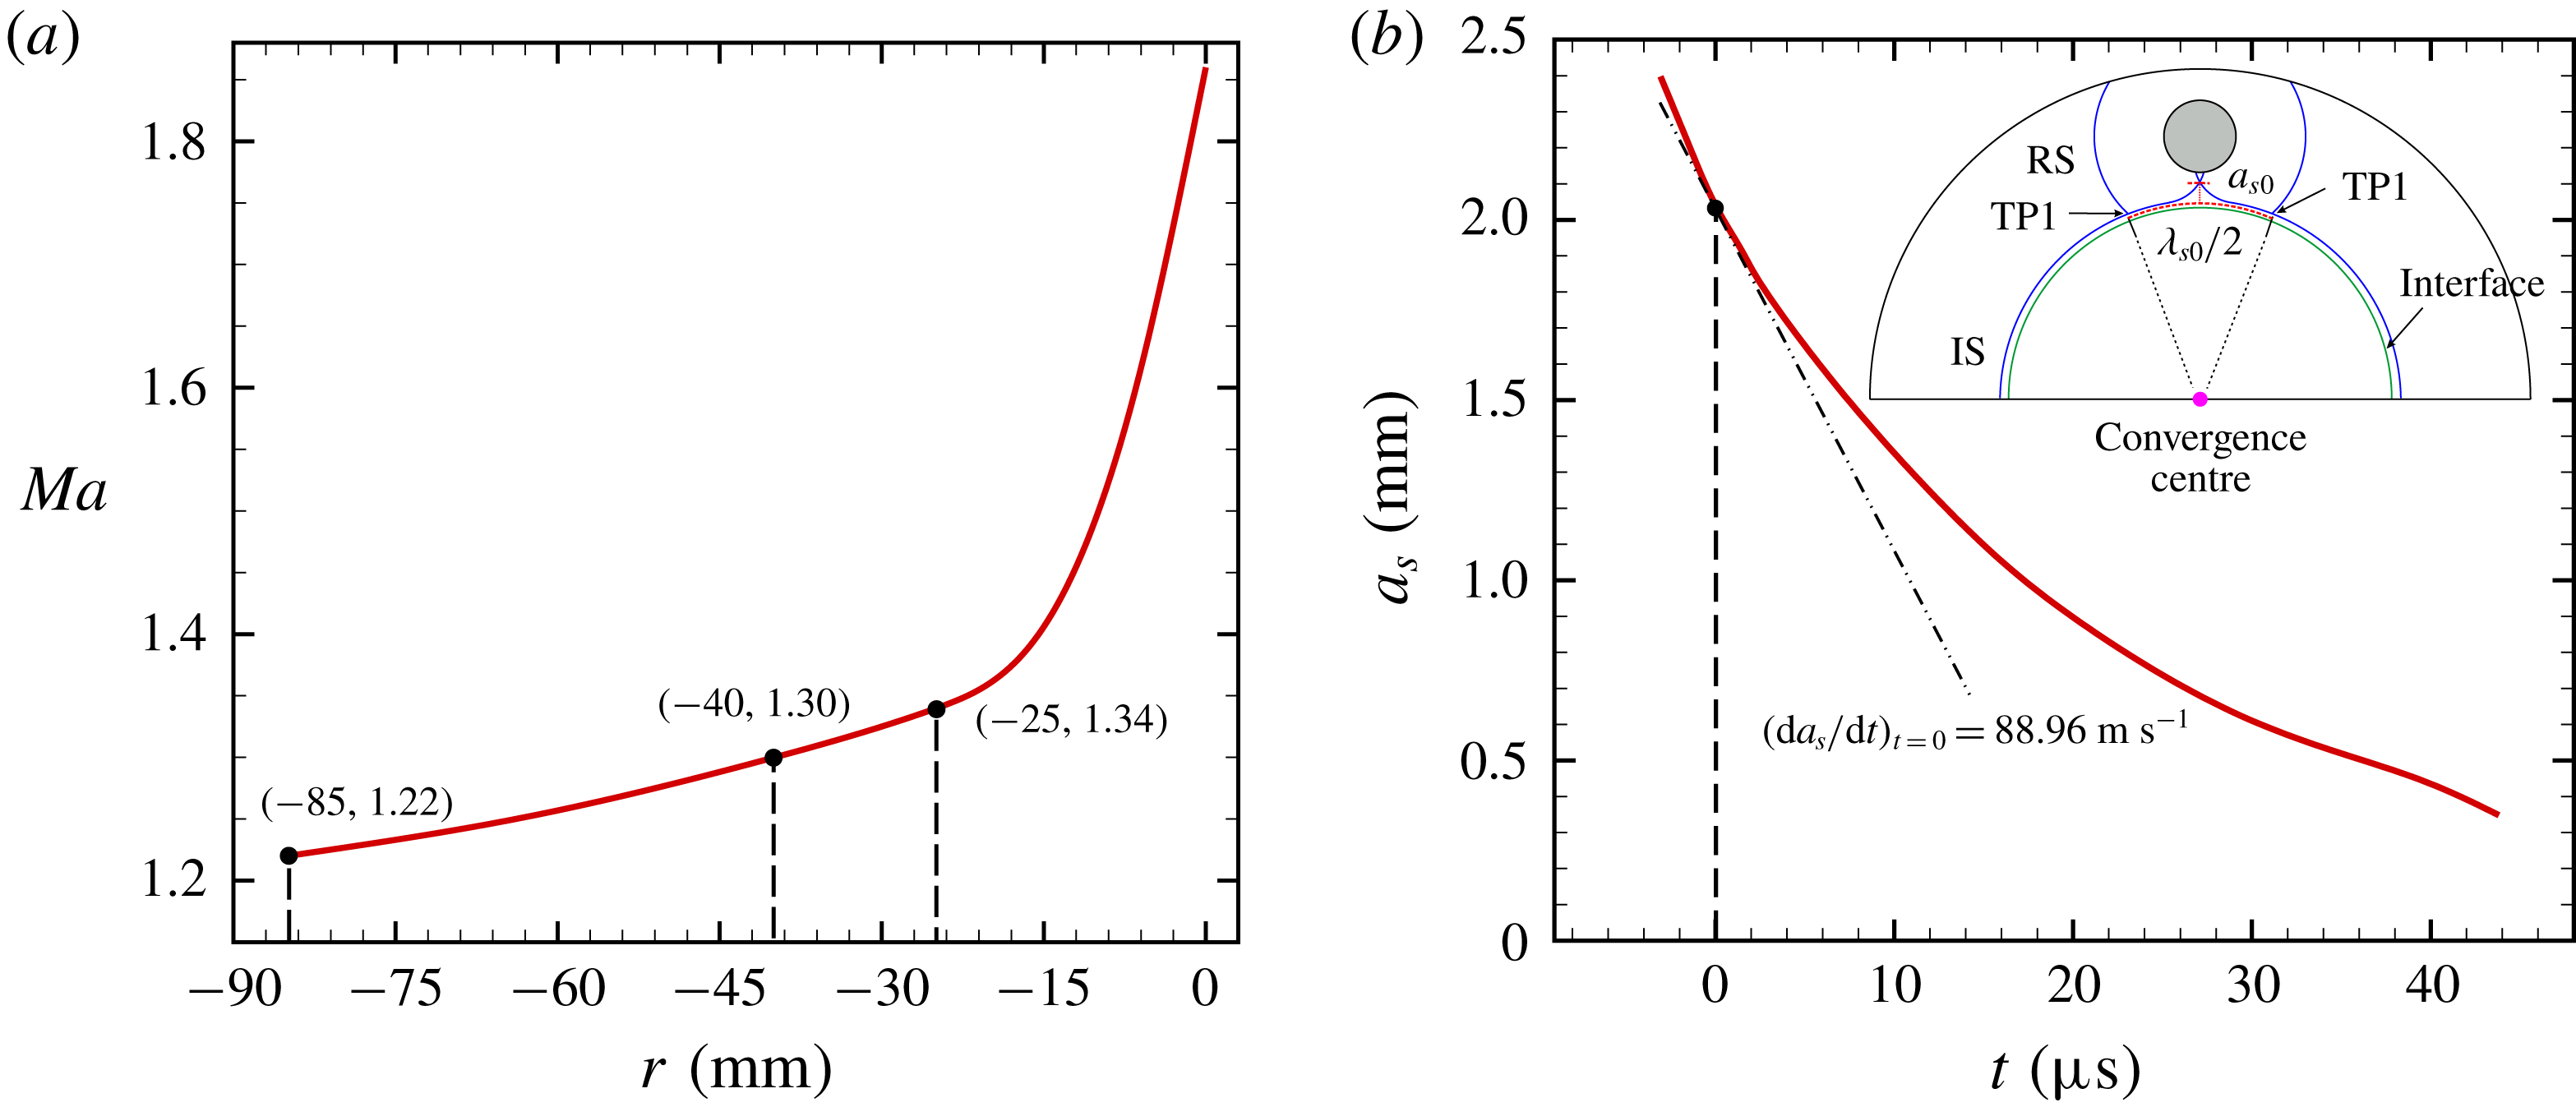
(a) Variation of unperturbed incident shock strength with distance, the origin of distance is placed at the convergence centre. (b) Variation of amplitude of disturbed shock with time.

A non-uniform incident shock wave is the source used to trigger the interface instability in this work. First of all, we study the non-uniform wave patterns without the presence of the gas interface. Figure 4 presents the typical schlieren pictures after the cylindrically converging shock wave diffracts around a 10 mm diameter rigid cylinder without interface. The time origin (0
 $\unicode[STIX]{x03BC}\text{s}$
) is defined as the instant that the incident shock arrives at the location of initially uniform interface (
 $R_{0}=25$
mm). At the beginning, the incident shock is produced at a radius of 85 mm. When the incident shock encounters the cylinder, a regular reflection phenomenon firstly emerges with a reflected shock. As the incident shock propagates around the cylinder, a Mach reflection with a Mach stem occurs. As shown in figure 4(a), at the moment the incident shock reaches a radius of 25 mm, the non-uniformly converging shock is divided into two different segments (IS and MS1) separated by a triple point (TP1). The two triple points meet at point P. After that, the intersection point P evolves into a line which is called shock MS2 (
 $16.9~\unicode[STIX]{x03BC}\text{s}$
and
 $33.9~\unicode[STIX]{x03BC}\text{s}$
). Finally, IS, MS1 and MS2 converge at the centre point (
 $48.6~\unicode[STIX]{x03BC}\text{s}$
).
The non-uniformity of the incident shock can be exhibited by its variation in strength with the distance to the convergence centre as given in figure 5(a). The spatial origin is set at the centre. Initially, the incident shock with
 $Ma=1.22$
starts from
 $R_{s}=85$
mm. As it arrives at the outer boundary of the rigid cylinder, its strength increases to
 $Ma=1.30$
. Subsequently, the strength of the incident shock further increases to 1.34 at a radius of 25 mm (
 $0~\unicode[STIX]{x03BC}\text{s}$
). After that, with the incident shock moving towards the centre, its strength is greatly enhanced. This characteristic, the strength of the incident shock increasing as it converges, is obviously different from the planar case in our previous work (Zou et al.
Reference Zou, Liu, Liao, Zheng, Zhai and Luo2017). Besides, figure 5(b) presents the amplitude variation of the perturbed shock (
 $a_{s}$
) with time. The amplitude data is extracted as the maximal width between unperturbed and perturbed shock waves. It is easily found that as the shock converges, the perturbed amplitude decreases gradually. Specifically, the growth rate of the perturbed shock amplitude at the initial time can be obtained as
 $(\text{d}a_{s}/\text{d}t)_{t=0}=88.96~\text{m}~\text{s}^{-1}$
.
3.2 Interface morphology
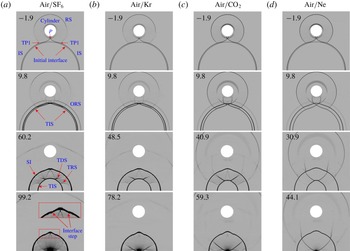
Evolution images of uniform interface impacted by the diffracted convergent shock for four different gas pairs. (a)
 $\text{air}/\text{SF}_{6}$
; (b) air/Kr; (c)
 $\text{air}/\text{CO}_{2}$
; (d)
 $\text{air}/\text{Ne}$
. ORS, outward reflected shock; TIS, transmitted shock of the incident shock across the interface. The other symbols are the same as those in figures 2 and 4. The numbers for the schlieren images are given in
 $\unicode[STIX]{x03BC}\text{s}$
.

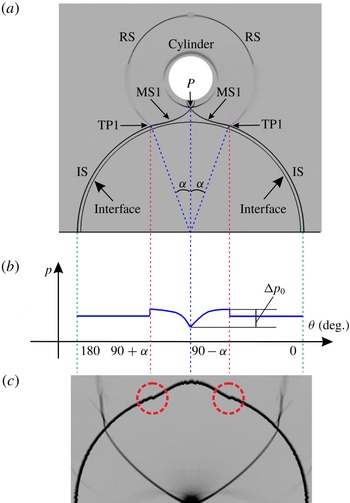
(a) Shapes of diffracted convergent shock and initial interface at the impinging moment. (b) Schematic of the pressure
 $p$
distribution behind the diffracted convergent shock. (c) Corresponding numerical schlieren image.

Figure 6 illustrates schlieren images of flow evolution for four cases including
 $\text{air}/\text{SF}_{6}$
, air/Kr,
 $\text{air}/\text{CO}_{2}$
and
 $\text{air}/\text{Ne}$
interfaces. For the
 $\text{air}/\text{SF}_{6}$
case as shown in the first column in figure 6, after the non-uniform incident shock (IS and MS1) impacts the interface (
 $9.8~\unicode[STIX]{x03BC}\text{s}$
), it bifurcates into an outward reflected shock (ORS) and a transmitted shock (TIS). Due to the subsequent impact of MS1, a bulge structure is gradually observed at the top of the circular interface (
 $60.2~\unicode[STIX]{x03BC}\text{s}$
and
 $99.2~\unicode[STIX]{x03BC}\text{s}$
). As the inside wave patterns move towards the centre, two interface steps are generated on both sides of the bulge (
 $99.2~\unicode[STIX]{x03BC}\text{s}$
). Unlike the planar case in our previous work (Zou et al.
Reference Zou, Liu, Liao, Zheng, Zhai and Luo2017), no cavity phenomenon appears due to the absence of MS2 at the impact moment in this study. For the other three cases including the heavy/light (
 $\text{air}/\text{Ne}$
) case, the evolving images are similar to those of the
 $\text{air}/\text{SF}_{6}$
case. There are only slight differences in the wave pattern among all the cases. For instance, the shape of the TRS wave gradually changes from concave to convex with the decrease of Atwood number, see the third row in figure 6. As the Atwood number A decreases from the left to the right column in figure 6, the travelling time of the incident wave (from time origin to converging centre) decreases quickly, and the bulge structure becomes more noticeable.
To understand the formations of bulge and steps, and the effect of wave patterns on interface evolution, the pressure distribution (
 $p$
) behind the non-uniform shock at the impinging moment is depicted in figure 7. Because both the unperturbed shock segment of the incident shock and the initial interface are uniform, the shocked interface there keeps a circular arc shape. At the locations of the two triple points, two interface steps emerge due to the pressure jump arising from the collision of the reflected shock and the incident shock, as indicated by dashed circles in figure 7(c). In the non-uniform shock segment of the incident shock (MS1), the strength of MS decreases gradually from TP1 to P (the contact point of two MS1). Thus the uniform interface is accelerated by a nearly inclined shock with the post-shock pressure decaying. Considering the small incident angle, the vorticity magnitude resulting from baroclinic torque is very small, and its influence on the interface morphology is insignificant. As a result, the interface shape behaves like a bulge structure with two steps on both sides. In addition, for four cases in this study, the pressure differences
 $\unicode[STIX]{x0394}p_{0}$
in figure 7(b) (representing the driving force) are same while the densities of driven gases (standing for the mass) are different. According to the impulse–momentum theorem, the deformed interface structure will evolve more quickly with the decrease of the densities of driven gases. Note that, besides the primary bulge and steps structure, the interface exhibits several high wavenumber modes in figure 7(c). Those perturbations could be ascribed to the physical development of small scale structures associated with Kelvin–Helmholtz instability, or a known phenomenon of lack of pointwise convergence of numerical solutions of Euler equations in resolving small-scale structures due to the absence of viscosity (Samtaney & Pullin Reference Samtaney and Pullin1996). We note that those perturbations are far from the regions we are interested and they do not significantly grow in the present time period, thus their effects are neglected.
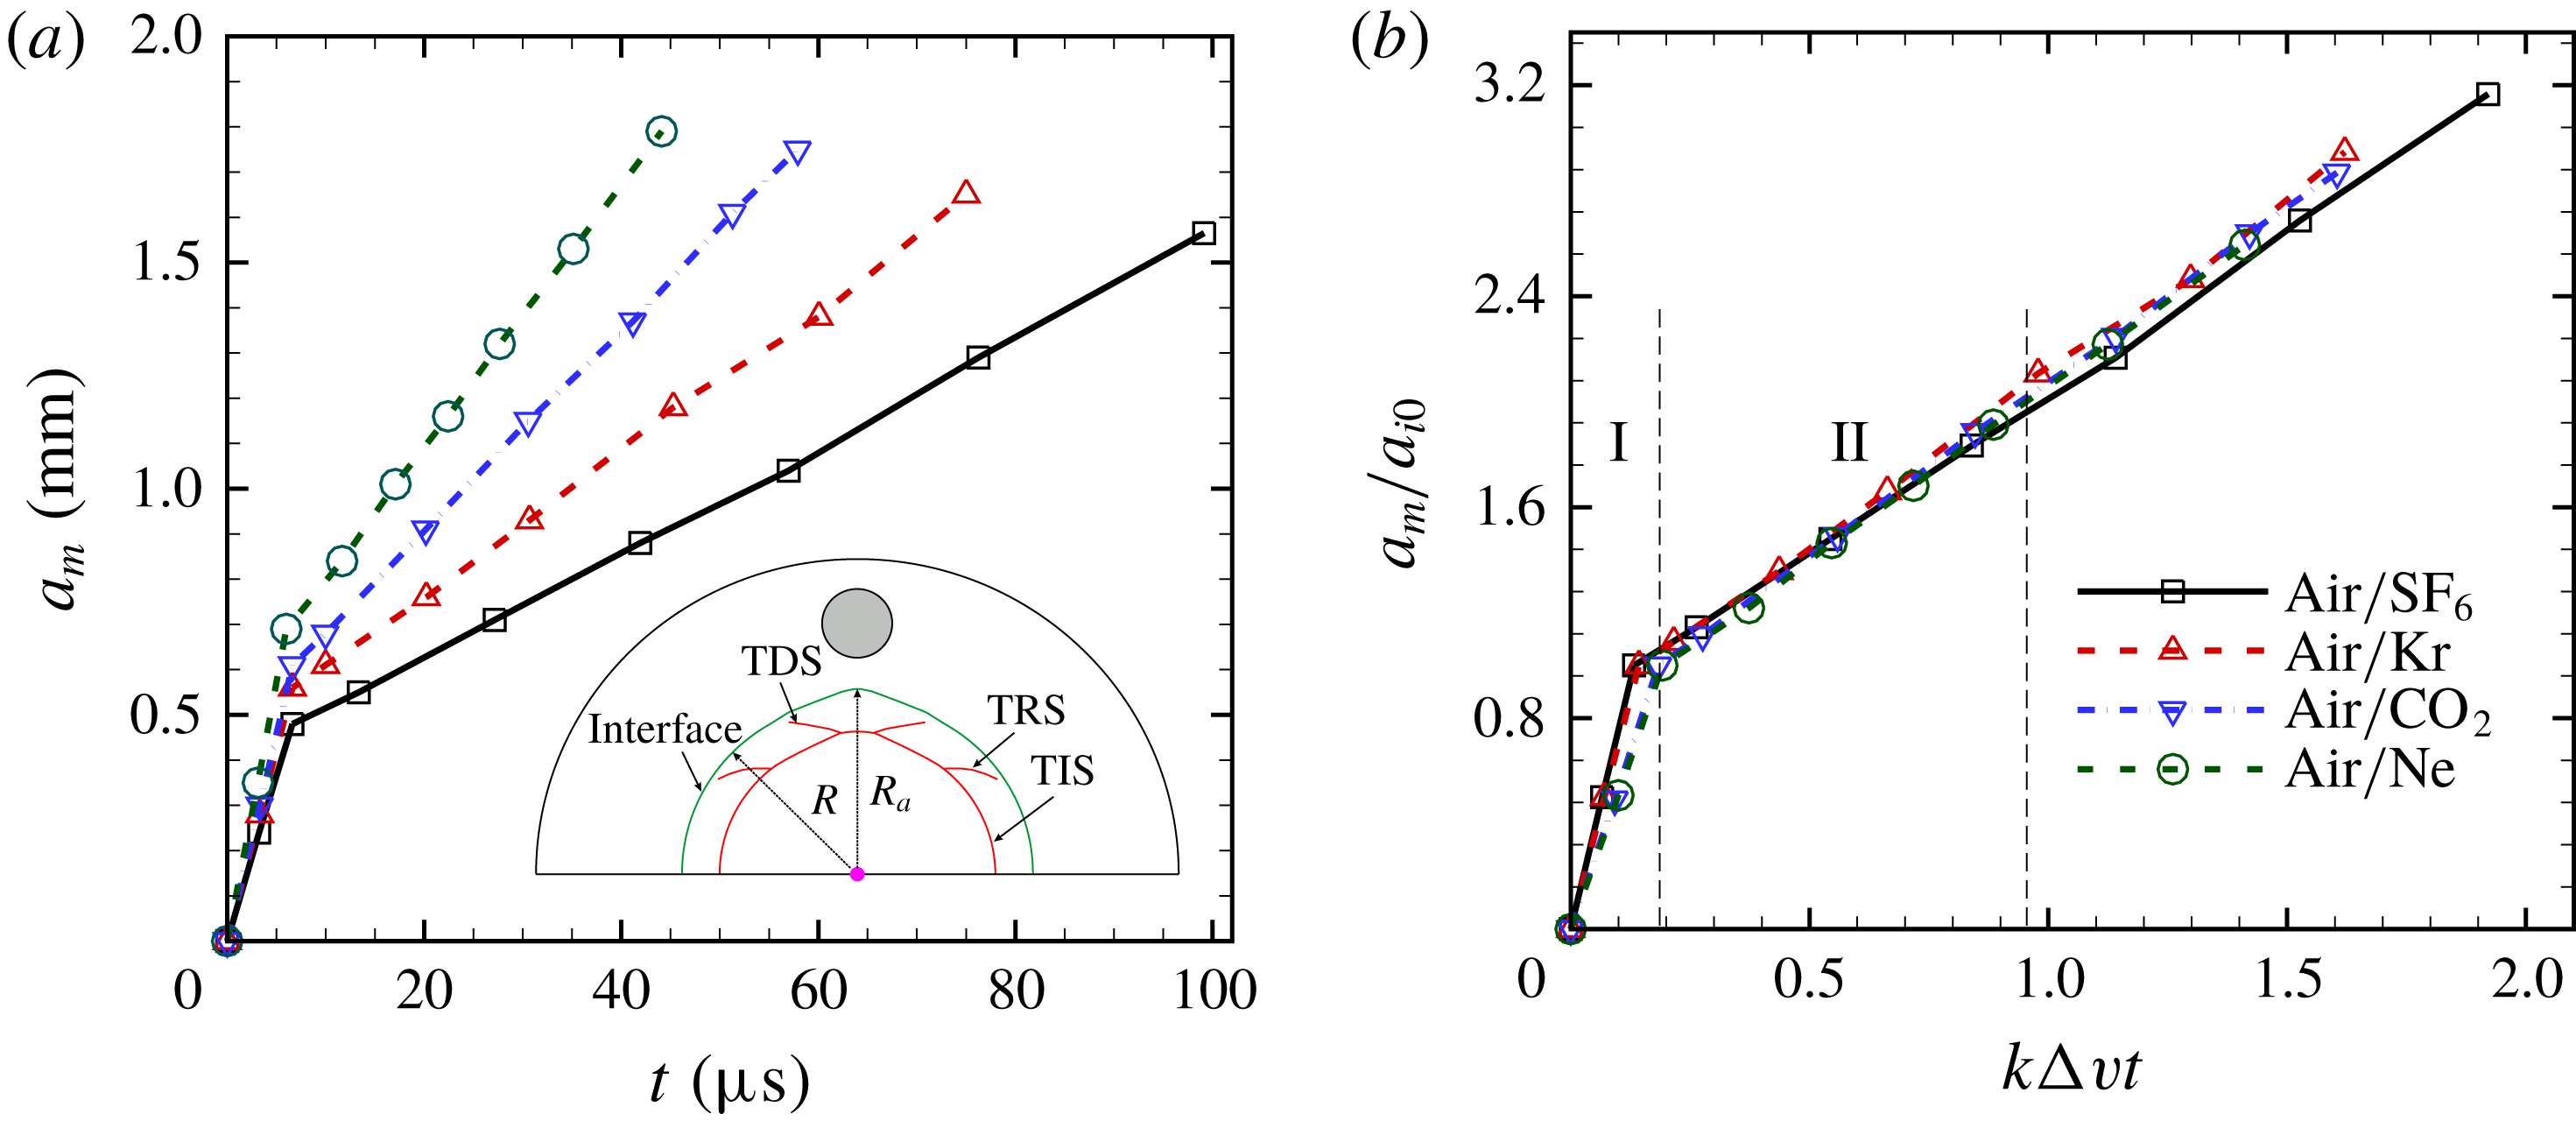
Time variations of amplitude (a) and dimensionless amplitude (b) for four cases. Here
 $a_{m}$
is the computational amplitude;
 $a_{i0}$
stands for the initial amplitude of post-shock interface;
 $k=2\unicode[STIX]{x03C0}/\unicode[STIX]{x1D706}_{s0}$
represents the wavenumber with
 $\unicode[STIX]{x1D706}_{s0}$
the wavelength of perturbed shock at the impinging moment;
 $\unicode[STIX]{x0394}v$
denotes the difference in the normal velocity components (the velocity jump of the shocked interface).

3.3 Amplitude and growth rate
The time variations of interface amplitude for the four cases can be acquired from the schlieren images. As shown in figure 8(a), the amplitude of the interface perturbation (
 $a_{m}$
) is obtained by (
 $R_{a}-R$
), with
 $R$
and
 $R_{a}$
the spacing from the unperturbed and perturbed interface boundaries to the convergence centre, respectively. For each case, the amplitude growth of the whole process is composed of two stages. In the first stage, the incident shock propagates across the interface, which is similar to the shock compression in the standard RM instability. However, during this stage, the amplitude increases, instead of decreases as that in the standard RM instability due to shock compression, very quickly in a short and almost identical time duration (
 ${\approx}6.2~\unicode[STIX]{x03BC}\text{s}$
) for all cases. With the decrease of Atwood number (
 $A$
), the amplitude of the post-shock interface (
 $a_{i0}$
) increases monotonically. Following this stage, the interface evolution enters into a relatively long and nearly linear stage until the incident wave patterns converge at the geometrical centre. For the
 $\text{air}/\text{SF}_{6}$
case, the linear stage is the longest and the deformed amplitude is the smallest among the four cases. Comparatively speaking, for the
 $\text{air}/\text{Ne}$
case, the linear stage is the shortest and the resulted amplitude is the largest. Note that in this heavy/light configuration, there is no phase inversion as that in the standard RM instability, i.e. the interface amplitude always obtains a quick growth after the deformed shock impact whatever the light/heavy or heavy/light interface involved. Figure 8(b) further illustrates the dimensionless amplitude for all cases. All the computational results here are normalized in the same form. The spatial and temporal scales are defined as
 $a_{i0}$
and
 $1/(k\unicode[STIX]{x0394}v)$
, respectively. It is observed that the linear stage lasts from 0.2 to 0.9 for all cases. It is interesting that a good collapse is achieved for different Atwood numbers when
 $k\unicode[STIX]{x0394}vt\leqslant 1.0$
in the current study, which implies that the growth rate of the amplitude is nearly independent of the Atwood number at both the impulsive and linear stages in the deformed shock-induced instability.
Comparison of the growth rate of interface amplitude in cylindrically convergent circumstances. Here
 $A^{+}$
is the post-shock Atwood number;
 $\unicode[STIX]{x0394}v$
denotes the velocity jump of shocked interface;
 $a_{i0}$
stands for the perturbation of compressed interface shortly after the impingement of diffracted convergent shock;
 $\unicode[STIX]{x1D706}_{s0}$
represents the wavelength of perturbed shock at the impinging moment;
 ${\dot{a}}_{1}$
is the linear growth rate based on
 $a_{i0}$
;
 ${\dot{a}}_{2}$
is the growth rate predicted by the modified theory (3.2);
 ${\dot{a}}_{m}$
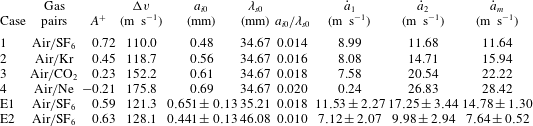
is the measured growth rate from the numerical simulations in the current work (the first four cases in this table) or from the experiments in Liang et al. (Reference Liang, Ding, Zhai, Si and Luo2017) (the last two cases in this table).

Subsequently, the growth rate of interface perturbation will be discussed. For the linear stage as shown in figure 8(a), the growth rate (
 ${\dot{a}}_{m}$
) can be calculated by a linear fitting of the amplitude evolving curve, and the results are listed in table 2 for all cases. It is interesting to find that the growth rate increases as the Atwood number
 $A$
decreases, which is opposite to that of the standard RM instability. To compare the growth rate with the theoretical value, the initial amplitude (
 $a_{0}$
) and wavelength (
 $\unicode[STIX]{x1D706}_{0}$
) of the deformed interface need to be obtained first. According to our previous work for the non-standard RM instability (Liang et al.
Reference Liang, Ding, Zhai, Si and Luo2017),
 $a_{0}$
can be determined by equating the pre-shock disturbance of the corrugated interface to the perturbation of compressed interface shortly after the impingement of diffracted convergent shock. The amplitude of the post-shock interface (
 $a_{i0}$
) is considered as the
 $a_{0}$
. The wavelength (
 $\unicode[STIX]{x1D706}_{s0}$
) of the diffracted convergent shock when it meets the uniform interface is considered as the
 $\unicode[STIX]{x1D706}_{0}$
, as illustrated in figure 5(b). Both the interface amplitude (
 $a_{i0}$
) and the wavelength (
 $\unicode[STIX]{x1D706}_{s0}$
) can be extracted from the numerical schlieren images as shown in figure 6, and the values are listed in table 2. Note that for all cases, the ratio of
 $a_{i0}/\unicode[STIX]{x1D706}_{s0}$
is less than 0.1, which satisfies the criterion for small perturbations and hence corresponds to a linear growth.
According to the classic models for the planar case (Taylor Reference Taylor1950; Richtmyer Reference Richtmyer1960) and the extended models for convergent geometry (Bell Reference Bell1951; Plesset Reference Plesset1954; Mikaelian Reference Mikaelian2005), the linear growth rate of perturbation in a cylindrically converging configuration can be expressed by
 $$\begin{eqnarray}{\dot{a}}=a_{0}\unicode[STIX]{x0394}v[(A^{+})2\unicode[STIX]{x03C0}/\unicode[STIX]{x1D706}_{0}+1/R],\end{eqnarray}$$
where
 ${\dot{a}}$
is the first derivative of interface amplitude
 $a$
with time
 $t$
,
 $a_{0}$
represents the initial amplitude,
 $\unicode[STIX]{x1D706}_{0}$
is the initial wavelength of interface,
 $A^{+}$
is the post-shock Atwood number, and
 $\unicode[STIX]{x0394}v$
is the velocity jump of the shocked interface. By substituting
 $a_{i0}$
and
 $\unicode[STIX]{x1D706}_{s0}$
into (3.1), the corresponding values of growth rate can be calculated, and are listed as
 $\dot{a_{1}}$
in table 2. For the
 $\text{air}/\text{SF}_{6}$
case, it is found that
 ${\dot{a}}_{1}$
roughly approaches the numerical counterpart (relative difference approximately 22.8 %), which verifies the previous result (Liang et al.
Reference Liang, Ding, Zhai, Si and Luo2017). However, with the decrease of Atwood number,
 $\dot{a_{1}}$
decreases gradually as well. This trend is opposite to that of the numerical results, which leads to a distinct deviation between
 ${\dot{a}}_{m}$
and
 ${\dot{a}}_{1}$
for the other three cases (relative difference approximately 49.3 % for air/Kr, 65.9 % for
 $\text{air}/\text{CO}_{2}$
and 99.2 % for
 $\text{air}/\text{Ne}$
). Therefore, this treatment is not applicable for characterizing the growth rate of non-standard RM instability.
Based on the development of the classic linear model (Richtmyer Reference Richtmyer1960; Meshkov Reference Meshkov1969; Vandenboomgaerde, Mügler & Gauthier Reference Vandenboomgaerde, Mügler and Gauthier1998), it is found that to achieve a better agreement with computational or experimental values, the Atwood number in the theoretical model of growth rate should be revised correspondingly. In the present case of non-standard RM instability, the phase of the refracted shock is not stable and it is reasonable to combine
 $\unicode[STIX]{x0394}v$
and
 $A$
effects together for model predictions. This is similar to the mechanism analysis choice by Ishizaki et al. (Reference Ishizaki, Nishihara, Sakagami and Ueshima1996). In addition, figure 8(b) indicates a weak dependence characteristic of the growth rate on the Atwood number. Therefore, we can propose a modified model for predicting the growth rate by explicitly eliminating
 $A^{+}$
from (3.1) as follows:
 $$\begin{eqnarray}{\dot{a}}=a_{0}\unicode[STIX]{x0394}v(2\unicode[STIX]{x03C0}/\unicode[STIX]{x1D706}_{0}+1/R).\end{eqnarray}$$
Consequently, the theoretical growth rate is labelled as
 ${\dot{a}}_{2}$
in table 2. For all cases, as listed in the table, the largest relative difference between the theoretical values (
 ${\dot{a}}_{2}$
) and the computational counterparts (
 ${\dot{a}}_{m}$
) is less than 8 %, which demonstrates a very good prediction of the modified model. To further check the modified formula (3.2), we also compare the theoretical prediction with the experimental results of Liang et al. (Reference Liang, Ding, Zhai, Si and Luo2017). As provided in table 2, the modified theory gives a reasonable prediction for the two experimental results as well. Note that the relatively large error mainly relates to the measurement uncertainty (approximately 30 %) of the initial amplitude of the shocked interface (
 $a_{i0}$
). It is interesting to note that the modified model can also reasonably describe the planar counterpart by using an infinite
 $R$
or simply removing the term
 $1/R$
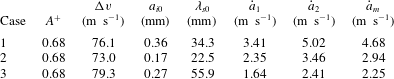
. As listed in table 3, we revisited the planar experiments by Zou et al. (Reference Zou, Liu, Liao, Zheng, Zhai and Luo2017) and found that a satisfactory agreement is achieved between theoretical predictions and experiments for all the three cases. Therefore, the modified model is applicable for both planar and convergent circumstances. This finding implies that the jumping velocity caused by the deformed shock dominates this kind of instability at linear stages. The smaller the Atwood number, the larger the jumping velocity of the shocked interface, and, therefore, the quicker the amplitude growth.
Comparison of the growth rate of interface amplitude between planar experiment and theoretical prediction. Here
 ${\dot{a}}_{1}$
is the linear growth rate based on
 $a_{i0}$
;
 ${\dot{a}}_{2}$
is the growth rate predicted by the modified model (3.2) with
 $R\rightarrow \infty$
;
 ${\dot{a}}_{m}$
is the measured growth rate from the experiments in Zou et al. (Reference Zou, Liu, Liao, Zheng, Zhai and Luo2017).

3.4 Mechanism analysis
Generally, the physics behind the RM instability mainly involves the baroclinic vorticity and pressure perturbation (Brouillette Reference Brouillette2002). The former results from the misalignment of the pressure gradient (induced by the shock) with the density gradient (across the initial interface). In the deformed shock-induced RM instability, a first difference from the standard RM instability is that the baroclinic vorticity deposition is somewhat insignificant. In the present study, the perturbed shock tends to return back to its original cylindrical shape during the shock movement. This results in a phenomenon that the angle between the perturbed shock and unperturbed interface is significantly decreasing; hence a decreasing baroclinic vorticity term. Another difference is that, as can be found in figure 8, the interface immediately starts to grow after the deformed shock impact without shock compression or phase inversion, which can be ascribed to the characteristic of uniform initial interface (initial amplitude is zero) and perturbed incident shock. From this point of view, the modified impulsive model (3.2) also implies that the pressure perturbation, not the baroclinic vorticity, contributes most significantly to the deformed shock-induced RM instability. The pressure perturbation can be further divided into two parts, the impulsive perturbation and the continuous perturbation, according to previous work on the non-standard RM instability in a planar configuration (Ishizaki et al. Reference Ishizaki, Nishihara, Sakagami and Ueshima1996; Zhang et al. Reference Zhang, Wu, Zou, Zheng, Li, Luo and Ding2018). The impulsive perturbation is generated by the deformed shock impact at the impinging moment, which can be expressed as
 $$\begin{eqnarray}{\dot{a}}_{imp}=\frac{\unicode[STIX]{x0394}v}{v_{s}}\left(\frac{\text{d}a_{s}}{\text{d}t}\right)_{t=0},\end{eqnarray}$$
where
 $v_{s}$
represents the velocity of the incident shock at
 $t$
= 0, and
 $(\text{d}a_{s}/\text{d}t)_{t=0}$
denotes the amplitude growth rate of the deformed shock at
 $t$
= 0, which can be obtained from the simulation result as shown in figure 5(b). The continuous perturbation is induced by the continuous pressure perturbation behind the deformed shock. Assuming the continuous pressure perturbation is a damped oscillation function, the amplitude growth contributed by the continuous perturbation can be approximately expressed by
 $$\begin{eqnarray}g(t)=\unicode[STIX]{x0394}g\text{e}^{-\unicode[STIX]{x1D6F9}t}\sin (\unicode[STIX]{x1D714}t+\unicode[STIX]{x1D719}),\end{eqnarray}$$
where
 $\unicode[STIX]{x1D719}$
is the phase of the oscillating shock at
 $t=0$
,
 $\unicode[STIX]{x0394}g$
is the acceleration constant,
 $\unicode[STIX]{x1D714}$
and
 $\unicode[STIX]{x1D6F9}$
(
 $\unicode[STIX]{x1D6F9}\ll \unicode[STIX]{x1D714}$
) are the oscillating frequency and the acceleration damping rate, respectively. Then, the growth rate contributed by the continuous pressure perturbation can be written as
 $$\begin{eqnarray}{\dot{a}}_{con}=-\int _{0}^{\infty }g(t)\,\text{d}t=-\frac{\unicode[STIX]{x0394}g}{\unicode[STIX]{x1D714}}\cos \unicode[STIX]{x1D719}.\end{eqnarray}$$
Decomposition of three mechanisms contributing to the total growth rate of interface amplitude. Here
 ${\dot{a}}_{m}$
represents the total growth rate from computation;
 ${\dot{a}}_{imp}$
,
 ${\dot{a}}_{con}$
and
 ${\dot{a}}_{BP}$
denote the growth rate induced by impulsive perturbation, continuous pressure perturbation and Bell–Plesset effect, respectively.

In addition, for a cylindrical configuration, the geometrical effect is also important and should be considered to assess the growth of RM instability. Based on previous works (Bell Reference Bell1951; Plesset Reference Plesset1954; Mikaelian Reference Mikaelian2005), the cylindrical Bell–Plesset effect on the perturbation growth can be estimated as
 $$\begin{eqnarray}{\dot{a}}_{BP}=a_{0}\unicode[STIX]{x0394}v/R.\end{eqnarray}$$
Combining the three mechanisms introduced above, the variation of the perturbation amplitude with time can be expressed as follows:
 $$\begin{eqnarray}{\dot{a}}={\dot{a}}_{imp}+{\dot{a}}_{con}+{\dot{a}}_{BP}=\frac{\unicode[STIX]{x0394}v}{v_{s}}\left(\frac{\text{d}a_{s}}{\text{d}t}\right)_{t=0}-\frac{\unicode[STIX]{x0394}g}{\unicode[STIX]{x1D714}}\cos \unicode[STIX]{x1D719}+a_{0}\unicode[STIX]{x0394}v/R.\end{eqnarray}$$
Note that the first part (
 ${\dot{a}}_{imp}$
) and the second part (
 ${\dot{a}}_{con}$
) have the same phase (Ishizaki et al.
Reference Ishizaki, Nishihara, Sakagami and Ueshima1996; Zhang et al.
Reference Zhang, Wu, Zou, Zheng, Li, Luo and Ding2018). Thus, it is reasonable to assume that
 ${\dot{a}}_{imp}$
is proportional to
 ${\dot{a}}_{con}$
. Let 1-
 $\unicode[STIX]{x1D700}$
stand for the ratio of the continuous pressure perturbation to the impulsive perturbation
 $$\begin{eqnarray}1-\unicode[STIX]{x1D700}=\left(\frac{\unicode[STIX]{x0394}g}{\unicode[STIX]{x1D714}}\cos \unicode[STIX]{x1D719}\right)\bigg/\left[\frac{\unicode[STIX]{x0394}v}{v_{s}}\left(\frac{\text{d}a_{s}}{\text{d}t}\right)_{t=0}\right].\end{eqnarray}$$
Here
 $\unicode[STIX]{x1D700}$
is a dimensionless parameter. Further, equation (3.8) can be written as
 $$\begin{eqnarray}{\dot{a}}=\unicode[STIX]{x1D700}\frac{\unicode[STIX]{x0394}v}{v_{s}}\left(\frac{\text{d}a_{s}}{\text{d}t}\right)_{t=0}+a_{i0}\unicode[STIX]{x0394}v/R.\end{eqnarray}$$
Through substituting
 ${\dot{a}}_{m}$
into (3.9) and combining with (3.7), contributions from the three mechanisms can be obtained separately. As listed in table 4, both the impulsive perturbation and Bell–Plesset effects promote the growth of interface amplitude while the continuous pressure perturbation effect inhibits the growth. As the Atwood number decreases, the total computational growth rate (
 ${\dot{a}}_{m}$
) increases gradually, and growth rates produced by the impulsive perturbation effect and the Bell–Plesset effect are enhanced, while that induced by the continuous pressure perturbation remains nearly a constant. This demonstrates that the impulsive perturbation plays a more important role on the instability growth than the continuous pressure perturbation. This trend can also be discovered by the ratio between them (1-
 $\unicode[STIX]{x1D700}$
) that decreases with the Atwood number. As for the percentage of each mechanism in the total growth rate, it is easy to find the term of the Bell–Plesset effect which almost remains a constant for four Atwood numbers, while those percentages resulting from impulsive (positive effect) and continuous (negative effect) pressure perturbations decrease with the Atwood number. However, the impulsive perturbation becomes more significant with the decrease of Atwood number. To the authors’ knowledge, this is the first time that the quantitative, decoupled mechanisms of non-standard RM instability in a convergent geometry have been revealed.
4 Conclusions
As an extension of our previous experiments (Liang et al.
Reference Liang, Ding, Zhai, Si and Luo2017; Zou et al.
Reference Zou, Liu, Liao, Zheng, Zhai and Luo2017) and computations (Zhang et al.
Reference Zhang, Wu, Zou, Zheng, Li, Luo and Ding2018) on the non-standard RM instability, the evolution of a uniform interface impacted by a diffracted convergent shock is investigated numerically for different Atwood numbers. We restrict our attention to the incident process of the cylindrically imploding RM instability. The numerical simulation is implemented using a two-dimensional compressible multi-fluid Eulerian code. The diffracted convergent shock is created by diffracting a cylindrically converging shock over a rigid cylinder. Four kinds of gas pair combinations are considered with the corresponding Atwood number ranging from
 $-$
0.18 to 0.67.
To learn the non-uniformity of the diffracted convergent shock, the case without interface is first studied. Numerical schlieren results indicate that as the diffracted convergent shock propagates inward, its strength is enhanced gradually, while its amplitude of disturbance suffers an obvious reduction. For all the four cases with interface formed by different gas pair combinations, after the diffracted convergent shock strikes the uniform interface, the interface shape behaves like a bulge structure at the centre with two steps at both its sides. This can be attributed to the pressure non-uniformity behind the diffracted convergent shock. Due to the difference of sound speed among the four cases, the time duration of the incident shock between hitting the interface and converging at the geometrical centre is different. A smaller Atwood number case corresponds to a faster convergence, and a more prominent bulge structure of the interface. Different from the standard RM instability, the interface amplitude first experiences a fast growth in all the four cases no matter whether the Atwood number of the interface is positive or negative, i.e. there is no shock compression or phase inversion. Then, the interface development enters a linear stage and the growth rate increases as the Atwood number decreases. A good collapse is achieved for different Atwood numbers, which implies a weak dependence of the growth rate on Atwood number. Therefore, a modified formula is derived from the linear model of cylindrical geometry by removing the Atwood number, which realizes a good agreement with computations in this study, and with experiments in the work of Liang et al. (Reference Liang, Ding, Zhai, Si and Luo2017). It is interesting that the modified model also gives a satisfactory prediction of experiments for the planar counterpart (Zou et al. Reference Zou, Liu, Liao, Zheng, Zhai and Luo2017). Therefore, we can conclude that it is the pressure perturbation (mainly from the impulsive perturbation) caused by the deformed shock, not the baroclinic vorticity, that dominates the non-standard RM instability at the linear stage. The smaller the Atwood number, the larger the jumping velocity of the shocked interface, and the quicker the amplitude growth. As a result, both the planar and convergent non-standard RM instabilities have the same Atwood number dependence, i.e. the amplitude growth rate of the shocked interface decreases with increasing Atwood number in the deformed shock-induce instability, which is opposite to that in the standard RM instability.
Furthermore, the linear stage of the deformed shock-induced RM instability is found to be associated with three underlying mechanisms including the impulsive pressure perturbation, continuous pressure perturbation and cylindrical Bell–Plesset effect. It is found that the impulsive perturbation and the Bell–Plesset effect promote the growth rate of interface perturbation, while the continuous pressure perturbation indeed restrains the perturbation growth. As the Atwood number decreases, the impulsive perturbation exerts a more important influence on the interface evolution than the continuous pressure perturbation. With regard to the percentage of each mechanism in the total growth rate, it is found that the Bell–Plesset effect remains nearly a constant in this study, while the impulsive perturbation and continuous pressure perturbation drop with the decrease of Atwood number. However, the impulsive perturbation becomes more significant with the decrease of Atwood number. The current study can enrich the database of shock-interface interaction, and the findings may be useful for better understanding and modelling of the non-standard RM instability. More test gases, shapes and strengths of deformed incident shock, and the turbulent mixing stage resulting from the reshock impact, will be involved to further explore the convergent non-standard RM instability in the near future.
Acknowledgements
This work was supported by the KAUST Office of Competitive Research Funds under Award no. URF/1/1394-01, the Baseline Research Funds of R. Samtaney, the Science Challenge Project (no. TZ2016001) and the National Natural Science Foundation of China (no. 11625211).