


1 Introduction
Flows of particles suspended in a viscous fluid have widespread applications across disciplines, e.g. biological sample processing and materials handling and food technology. Previous studies examining the particle dispersion in such systems consider cases where particles are distributed through the entire domain. In this paper, we discuss the case when the particles are concentrated in a small subdomain of the channel. Motivated by experiments by Metzger & Butler (Reference Metzger and Butler2012), where they tracked a spherical cloud of particles in an oscillating Couette flow, we consider a periodic cylinder of particles that is initially circular in the plane of shear flow, as shown in figure 1. The particles are sheared forward for half a period
 $T$
, and then the flow is reversed so the cylinder approaches its original position. The particles are free to disperse in all directions outside of the cylinder.
The experiments of Pine et al. (Reference Pine, Gollub, Brady and Leshanksy2005) have shown that, within an initially homogeneous suspension subject to an oscillating shear flow, the particles have a measurable self-diffusion once a critical strain amplitude is exceeded. Below this threshold strain amplitude, particles rearrange into a reversible state (Corté et al. Reference Corté, Chaikin, Gollub and Pine2008). Previous research attributes the increase in self-diffusivity to contact interactions between rough-surface particles (Corté et al. Reference Corté, Chaikin, Gollub and Pine2008; Metzger & Butler Reference Metzger and Butler2010; Metzger, Pham & Butler Reference Metzger, Pham and Butler2013). When one particle overtakes another in shear flow, the particles are displaced across streamlines (Da Cunha & Hinch Reference Da Cunha and Hinch1996; Zarraga & Leighton Reference Zarraga and Leighton2002). Experiments and simulations with two and three particles show that this displacement increases with the particle roughness (Rampall, Smart & Leighton Reference Rampall, Smart and Leighton1997; Pham, Metzger & Butler Reference Pham, Metzger and Butler2015). Because of the particle roughness, the pair distribution function of particles in a fully seeded channel displays fore–aft asymmetry, which increases with rougher particles (Blanc, Peters & Lemaire Reference Blanc, Peters and Lemaire2011). Recently, this threshold has been shown to be inversely proportional to the square root of the particle roughness, so the critical strain amplitude is higher for smoother particles than for rougher particles (Pham, Butler & Metzger Reference Pham, Butler and Metzger2016).
(a,b
) Simulation initial condition for a periodic cylindrical cloud with channel height
 $H_{y}=24$
and
 $R/a=8$
. The channel is periodic in the streamwise and vorticity directions. (c) Strain rate profile over
 $t/T$
for an oscillating Couette flow.

This study investigates the particle migration in cylindrical and spherical clouds of suspended non-Brownian spherical particles when subjected to an oscillating Couette flow. The cloud has an initial volume fraction
 $\unicode[STIX]{x1D719}_{i}=40\,\%$
–55 % and a cylinder radius
 $R$
. Metzger & Butler (Reference Metzger and Butler2012) showed two different regimes for spherical clouds. At lower volume fractions, if the strain amplitude was higher than the critical strain amplitude in Pine et al. (Reference Pine, Gollub, Brady and Leshanksy2005), the clouds extended along the channel centreline after several oscillations, resulting in an elliptical cross-section. When the volume fraction approached close packing, the clouds began to rotate. ‘Galaxy-like’ arms emerged when the radius of the cloud was much larger than the particle radius, e.g.
 $R/a=20.$
In this paper we discuss the first case in § 3 and the second case in § 4. Some results with spherical, instead of cylindrical, clouds are discussed in § 3.2 to provide a comparison to the experiments in Metzger & Butler (Reference Metzger and Butler2012). The range of parameters and cloud behaviour considered allows for examination of the forces leading to macroscopic irreversibility of the cloud shape in both regimes, and the simulations give complementary data to the previous experiments. The goal of the present study is to give further insight into the relative significance of the particle contacts and long-range hydrodynamic forces in the irreversible particle displacements in a suspension flow.
2 Simulation parameters
The simulations are completed using the force coupling method (FCM) to represent the particles and a Fourier pseudo-spectral scheme to solve for the resulting fluid flow in the zero Reynolds number Stokes’ regime (Yeo & Maxey Reference Yeo and Maxey2011). In FCM, each particle is represented by a low-order force multipole expansion that captures the hydrodynamic interactions of the particles. When the particles are close together viscous lubrication forces and a short-range contact force barrier are employed to include the forces not captured by the force multipole expansions. Cylindrical clouds of densely packed, neutrally buoyant, non-Brownian spherical particles with radius
 $a$
are initially placed in a channel with height
 $H_{y}$
, where
 $H_{y}$
is varied to study the effects of the spacing between the channel walls, using
 $a$
and the strain rate
 $\dot{\unicode[STIX]{x1D6FE}}$
as the scale. The flow in the channel is periodic in the spanwise direction,
 $x$
, and the streamwise direction,
 $z$
, using the notation velocity
 $\boldsymbol{u}=(u,v,w)$
and vorticity
 $\unicode[STIX]{x1D74E}=(\unicode[STIX]{x1D714}_{x},\unicode[STIX]{x1D714}_{y},\unicode[STIX]{x1D714}_{z})$
. The channel length in the streamwise direction,
 $L_{z}$
, is chosen to be long enough so that the periodic image of the sheared cloud does not overlap with itself. The channel walls move to create a Couette flow in the channel, with shear rate
 $\dot{\unicode[STIX]{x1D6FE}}=1$
. After
 $\dot{\unicode[STIX]{x1D6FE}}t=T/2$
the shear rate is reversed so
 $\dot{\unicode[STIX]{x1D6FE}}=-1$
, as illustrated in figure 1. The actual shear rate
 $\dot{\unicode[STIX]{x1D6FE}}$
is adjusted continuously during a short interval at each reversal to ensure a smooth variation in the particle velocities. The initial volume fraction of the clouds,
 $\unicode[STIX]{x1D719}=((4/3)\unicode[STIX]{x03C0}a^{3}N)/\unicode[STIX]{x03C0}R^{2}L_{x}$
, where
 $R$
is the radius of the circular cross-section of the cloud and
 $L_{x}$
is the channel length in the direction of mean vorticity, is varied between
 $\unicode[STIX]{x1D719}=40\,\%$
and
 $\unicode[STIX]{x1D719}=55\,\%$
.
A short-range repulsion force between the particles acts to prevent particle overlap and physically represents the roughness of the particles. The contact force between particles
 $\unicode[STIX]{x1D6FC}$
and
 $\unicode[STIX]{x1D6FD}$
, with centres
 $\boldsymbol{Y}^{\unicode[STIX]{x1D6FC}}$
and
 $\boldsymbol{Y}^{\unicode[STIX]{x1D6FD}}$
, acts along the line of centres of the particles and is given by
 $$\begin{eqnarray}\boldsymbol{F}_{P}^{\unicode[STIX]{x1D6FC}\unicode[STIX]{x1D6FD}}=\left\{\begin{array}{@{}ll@{}}\displaystyle -6\unicode[STIX]{x03C0}a^{2}\unicode[STIX]{x1D702}\dot{\unicode[STIX]{x1D6FE}}F_{ref}\left(\frac{R_{ref}^{2}-|\boldsymbol{r}|^{2}}{R_{ref}^{2}-4a^{2}}\right)^{6}\frac{\boldsymbol{r}}{|\boldsymbol{r}|} & \text{if }|\boldsymbol{r}|<R_{ref},\\ \displaystyle \quad 0 & \text{otherwise}\end{array}\right.\end{eqnarray}$$
in which
 $\boldsymbol{r}=\boldsymbol{Y}^{\unicode[STIX]{x1D6FD}}-\boldsymbol{Y}^{\unicode[STIX]{x1D6FC}}$
,
 $\unicode[STIX]{x1D702}$
is the fluid viscosity,
 $R_{ref}$
is the cutoff distance and
 $F_{ref}$
is a constant chosen so that the minimum gap between the particles is
 $0.005a$
when
 $R_{ref}=2.01a$
(Yeo & Maxey Reference Yeo and Maxey2011). The contact force breaks the reversibility of two-particle interactions, causing the particles to migrate across streamlines. This is illustrated in figure 2 for a pair of particles moving past each other in a Couette flow. The symmetry-breaking displacement increases with
 $R_{ref}$
. These results may be compared with those of Da Cunha & Hinch (Reference Da Cunha and Hinch1996) and Blanc et al. (Reference Blanc, Peters and Lemaire2011). For two-particle interactions the maximum contact force attained by the simulation is in the range
 $|F_{max}|=15.50$
–20.15, and the minimum gap between the particles varies so that the maximum force is attained. For
 $R_{ref}=2.01a,2.001a$
and
 $2.0001a$
, the minimum gap widths are
 $0.00531a$
,
 $0.000534a$
and
 $0.000055a$
, respectively. Unless mentioned otherwise, the contact force cutoff for all simulations
 $R_{ref}=2.01a$
.
The particles interact with the channel walls through a short-range repulsion force similar to (2.1) and through viscous lubrication forces. However, the channel height is chosen to be large enough so that particles are isolated from the walls and do not enter the cutoff distances for these forces.
Relative trajectories of two particles with initial separation
 $\unicode[STIX]{x0394}y=0.2a$
with different values of
 $R_{ref}$
. The final location of the overtaking particle depends on
 $R_{ref}$
, and the separation from the initial streamline increases with
 $R_{ref}$
.

The contact force can have an indirect effect on other nearby particles through local hydrodynamic interactions creating further irreversible displacements. As a demonstration, the two-particle configuration in figure 2 is replicated in figure 3(a) with an additional particle added (labelled 3) so that it is close enough to be within the lubrication force cutoff distance, but not come into contact with the other particles. When the particles are subjected to an oscillating Couette flow, all three particles are displaced from their original positions over the course of one oscillation, see figure 3(a). During the first half of the oscillation the two particles that come into contact will have a significant displacement in the wall-normal direction. When the flow is reversed, the third particle will interact with the newly displaced particles through local hydrodynamic effects, causing an irreversible particle displacement in the absence of contact forces. This third body effect is a direct result of the particle contacts, and demonstrates that it is not necessary for an individual particle to come into contact with another particle in order to be displaced, rather, irreversibility can be transmitted through reversible hydrodynamic forces.
The particle contribution to the bulk stress is given by
 $$\begin{eqnarray}\langle \unicode[STIX]{x1D70E}_{ij}^{p}\rangle =\frac{N_{p}}{V}\langle S_{ij}\rangle +\frac{N_{p}}{V}\langle S_{ij}^{C}\rangle ,\end{eqnarray}$$
where
 $\langle S_{ij}^{C}\rangle$
is the contribution from the elastic contact force given in (2.1),
 $\langle S_{ij}\rangle$
is the contribution from the long-range hydrodynamic forces and lubrication forces and
 $V$
is the volume of the domain. The stress from the contact force can be found by using the dipole moment of the force distribution following Batchelor (Reference Batchelor1970):
 $$\begin{eqnarray}\langle \unicode[STIX]{x1D70E}_{ij}^{C}\rangle =\frac{N_{p}}{V}\langle S_{ij}^{C}\rangle =\frac{1}{V}\mathop{\sum }_{\unicode[STIX]{x1D6FC}=1}^{N_{p}}\mathop{\sum }_{\unicode[STIX]{x1D6FD}=1}^{N_{c}^{\unicode[STIX]{x1D6FC}}}-\frac{1}{2}(\boldsymbol{Y}^{\unicode[STIX]{x1D6FD}}-\boldsymbol{Y}^{\unicode[STIX]{x1D6FC}})\boldsymbol{F}_{P}^{\unicode[STIX]{x1D6FC}\unicode[STIX]{x1D6FD}},\end{eqnarray}$$
where
 $N_{c}^{\unicode[STIX]{x1D6FC}}$
is the number of particles within the contact force cutoff distance of particle
 $\unicode[STIX]{x1D6FC}$
,
 $\boldsymbol{F}_{P}^{\unicode[STIX]{x1D6FC}\unicode[STIX]{x1D6FD}}$
is the contact force between particle
 $\unicode[STIX]{x1D6FC}$
and
 $\unicode[STIX]{x1D6FD}$
, which have centres
 $\boldsymbol{Y}_{\unicode[STIX]{x1D6FC}}$
and
 $\boldsymbol{Y}_{\unicode[STIX]{x1D6FD}}$
. The particle pressure is defined here as the trace of the stress tensor from the contact force:
 $$\begin{eqnarray}P=-{\textstyle \frac{1}{3}}(\unicode[STIX]{x1D70E}_{11}^{C}+\unicode[STIX]{x1D70E}_{22}^{C}+\unicode[STIX]{x1D70E}_{33}^{C}).\end{eqnarray}$$
The particles are randomly seeded in two stages to create a compact, high volume fraction cloud without effects from confining the particles during seeding. In the first stage, particles with radius
 $a_{i}=0.85a$
are randomly placed in a cylinder with radius
 $Ra$
. Once all the particles are placed a molecular dynamics simulation with a repulsive potential is performed while the particle size is slowly increased so that particles have a final radius of
 $a$
. If the particles are confined during this second stage they form layers along the edge of the cylinder, analogous to particle layering along a channel wall in a fully seeded suspension flow in a channel. To prevent this, the particles are not confined to the cylinder during the inflation stage. This causes a slight increase in the cloud radius, and the change to the volume fraction is less than
 $15\,\%$
when
 $\unicode[STIX]{x1D719}=40\,\%$
and
 $25\,\%$
when
 $\unicode[STIX]{x1D719}=55\,\%$
. Allowing the particles to expand out of the initial cylinder confinement during the inflation step may give a better comparison to the experiments, where the particles are injected into the flow using a syringe but are not confined to a prescribed volume (Metzger & Butler Reference Metzger and Butler2012).
(a) Initial configuration of three particles. Particles 1 and 2 are positioned so that they will come within the contact force cutoff distance over one oscillation, as in figure 2. Particle 3 is far enough from particle 2 that they will not interact through the contact force, but the two particles will come within the lubrication force cutoff distance. (b) Initial (solid) and final (dashed) particle positions after one oscillation. All particles are displaced from their original positions.

The macroscopic irreversibility of the cloud (i.e. the shape of the cross-section of the cylindrical cloud after many oscillations) is related to the size of the cloud, volume fraction of the particles and the strain amplitude, as defined by
 $$\begin{eqnarray}\unicode[STIX]{x1D6FE}_{0}=\dot{\unicode[STIX]{x1D6FE}}\frac{T}{2},\end{eqnarray}$$
where
 $T$
is the period of one oscillation. This definition of the strain amplitude corresponds to twice that of Pine et al. (Reference Pine, Gollub, Brady and Leshanksy2005). The current study uses a square wave where the flow is reversed after half a cycle, while the experiments by Pine et al. (Reference Pine, Gollub, Brady and Leshanksy2005) used a sine wave where the flow was reversed after the first quarter period. For the volume fraction
 $\unicode[STIX]{x1D719}=40\,\%$
, the study by Pine et al. (Reference Pine, Gollub, Brady and Leshanksy2005) found the threshold for microscopic irreversibility to be
 $\unicode[STIX]{x1D6FE}_{0}=0.8$
, corresponding to
 $\unicode[STIX]{x1D6FE}_{0}\approx 1.6$
using the current definition. Previous studies, however, have looked at a fully seeded flow with a homogenous volume fraction across the sample and do not consider the effects of gradients in the particle volume fraction. In the current simulations we consider
 $\unicode[STIX]{x1D6FE}_{0}$
between
 $0.5$
and
 $12.5$
, extending the results of Metzger & Butler (Reference Metzger and Butler2012), where
 $\unicode[STIX]{x1D6FE}_{0}\leqslant 8$
.
The simulations reveal four distinct regimes distinguished by the configuration of particles after many oscillations in reference to the initial cross-section of the cloud: macroscopic reversible states, extensional states, parallelogram states and rotational or ‘galaxy-like’ states with arms extending from the cloud. The last case occurs in large clouds with a high initial volume fraction, while the former three states form in lower volume fraction clouds, with the particle migration determined by the strain amplitude. Section 3 focuses on lower volume fraction clouds,
 $\unicode[STIX]{x1D719}=40\,\%$
, while § 4 will discuss the formation of rotational states with
 $\unicode[STIX]{x1D719}=55\,\%$
.
3 Lower volume fraction clouds,
 $\unicode[STIX]{x1D719}=40\,\%$

First, we will address the dispersion of particles in small spherical and cylindrical clouds with
 $R/a\leqslant 10$
and
 $\unicode[STIX]{x1D719}=40\,\%$
, where the particle migration is demonstrated to be determined by the strain amplitude. In comparison to the spherical clouds used in experiments, cylinders allow for a more detailed analysis of the cloud structure. The number of particles in a periodic cylinder depends on length of the periodic domain along the axis of the cylinder. By extending the domain in the spanwise direction the number of particles can be increased to improve statistical averages. In contrast, at
 $R/a\leqslant 10$
and
 $\unicode[STIX]{x1D719}=40\,\%$
, the maximum number of particles in a spherical cloud is approximately
 $400$
. Because of this, we will predominately focus on the migration of particles in cylindrical clouds, discussed in § 3.1. In § 3.2 basic results from spherical clouds are provided as a direct comparison to the experiments in Metzger & Butler (Reference Metzger and Butler2012).
3.1 Cylindrical clouds
In this section we consider the particle migration for cylindrical clouds with an initial circular cross-section of radius
 $R$
. Two channel heights and initial cloud sizes are considered to study the influence of the channel walls on the migration of the particles,
 $H_{y}=24a$
with cloud size
 $R=8a$
and
 $H_{y}=40a$
with cloud size
 $R=9a$
. Observations are made comparing the initial positions of the particles and the particle positions after sixteen oscillations, shown in figure 4. Compared to the initial particle locations, simulations with strain amplitude
 $3\leqslant \unicode[STIX]{x1D6FE}_{0}\leqslant 5$
show expansion of the cloud in the streamwise direction and a slight compression in the wall-normal direction at
 $t=16T$
, consistent with the observations of Metzger & Butler (Reference Metzger and Butler2012). In contrast, simulations with
 $\unicode[STIX]{x1D6FE}_{0}\geqslant 10$
also show expansion in the streamwise direction, but along the top and bottom of the cloud instead of the channel centreline. The transition between these regimes occurs in the range
 $5\leqslant \unicode[STIX]{x1D6FE}_{0}\leqslant 10$
. Additional simulations were done with
 $\unicode[STIX]{x1D6FE}_{0}=0.5,1.25$
and
 $2$
, which demonstrated no qualitative difference between the initial cloud shape and cloud shape after twenty oscillations, consistent with the threshold for irreversibility from Pine et al. (Reference Pine, Gollub, Brady and Leshanksy2005) and Pham et al. (Reference Pham, Butler and Metzger2016) for homogeneous shear flow.
Initial particle positions (top left) and positions after sixteen oscillations for varying strain amplitudes and channel heights
 $H_{y}=24a$
(a) and
 $H_{y}=40a$
(b) with contact force cutoff distance
 $R_{ref}=2.01a$
. Particles are actual size and are projected onto the
 $yz$
-plane.

Particle positions of the cloud after eight oscillations with
 $R_{ref}=2.01$
(a,d),
 $R_{ref}=2.001$
(b,e) and
 $R_{ref}=2.0001$
(c,f). Decreasing
 $R_{ref}$
decreases the irreversibility for
 $\unicode[STIX]{x1D6FE}_{0}=10$
(d–f) but not for
 $\unicode[STIX]{x1D6FE}_{0}=5$
(a–c). Particles are actual size and
 $H/a=40$
.

Irreversibility in fully seeded homogeneous suspension flows and in two- and three-particle interactions increases with the particle roughness (Da Cunha & Hinch Reference Da Cunha and Hinch1996; Zarraga & Leighton Reference Zarraga and Leighton2002; Pham et al.
Reference Pham, Metzger and Butler2015), and increasing the particle roughness increases the self-diffusivity of the system (Pham et al.
Reference Pham, Butler and Metzger2016). With this in mind, we now look at the role of two-particle contact interactions in the shapes of the clouds at
 $t=8T$
through varying the cutoff distance of the contact force,
 $R_{ref}$
, for the cases of
 $\unicode[STIX]{x1D6FE}_{0}=5$
and
 $\unicode[STIX]{x1D6FE}_{0}=10$
. As shown in figure 5, changing
 $R_{ref}$
does not produce a large qualitative difference for the lower strain amplitude. In contrast, for the higher strain amplitude lower values of
 $R_{ref}$
reduce the near-wall extension of the cloud. This suggests that near-wall extension is the result of two-particle contact interactions while the cloud is being sheared in each oscillation.
To quantify the macroscopic irreversibility of the clouds we introduce the radius of gyration, shown in figure 6. The radius of gyration measures the average squared distance between each particle and the centre of mass of the cloud in the
 $yz$
-plane,
 $\boldsymbol{r}^{m}=(y_{cm},z_{cm})$
, given by
 $$\begin{eqnarray}R_{g}^{2}(t)=\frac{1}{N}\mathop{\sum }_{i=1}^{N}[y_{i}(t)-y_{cm}(t)]^{2}+[z_{i}(t)-z_{cm}(t)]^{2}.\end{eqnarray}$$
Here,
 $y_{cm}(t)=(1/N)\sum _{i=1}^{N}y_{i}(t)$
,
 $z_{cm}(t)=(1/N)\sum _{i=1}^{N}z_{i}(t)$
and
 $(x_{i},y_{i},z_{i})$
is the position vector of particle
 $i$
. Only small differences in the radii of gyration are observed for
 $\unicode[STIX]{x1D6FE}_{0}=5$
. However, the radius of gyration increases with
 $R_{ref}$
for
 $\unicode[STIX]{x1D6FE}_{0}=10$
.
Change in radius of gyration,
 $R_{g}(t)-R_{g}(0)$
, for eight oscillations.
 $L_{x}=60$
and
 $H_{y}/a=40$
. (a)
 $\unicode[STIX]{x1D6FE}_{0}=5$
. (b)
 $\unicode[STIX]{x1D6FE}_{0}=10$
.

(a) Average displacement of the particles in the wall-normal direction after 16 periods. A positive displacement means that the particle cloud is on average expanding towards the channel walls. (b) Number of unique contacts per particle during each oscillation for
 $H_{y}=40a$
. (c) Displacement after each period for
 $H_{y}=24a$
. (d) Displacement after each period for
 $H_{y}=40a$
. In both (c) and (d), the net displacement for
 $\unicode[STIX]{x1D6FE}_{0}\leqslant 2$
is negligible. For
 $3\leqslant \unicode[STIX]{x1D6FE}_{0}\leqslant 5$
there is a strong negative displacement, with a larger displacement in the wider channel. In all cases, the displacement is roughly linear with respect to time.

The footprints of the simulation clouds can be further quantified in terms of the average particle displacements in the velocity gradient direction,
 $\langle \unicode[STIX]{x0394}y\rangle$
, plotted in figure 7. The particle displacement
 $\unicode[STIX]{x0394}y_{i}$
is defined by
 $$\begin{eqnarray}\unicode[STIX]{x0394}y_{i}=\left\{\begin{array}{@{}ll@{}}\displaystyle \frac{y_{i}(16T)-y_{i}(0)}{a} & \displaystyle \text{if }y_{i}(0)\geqslant \frac{H}{2},\\[8.0pt] \displaystyle -\frac{y_{i}(16T)-y_{i}(0)}{a} & \displaystyle \text{if }y_{i}(0)<\frac{H}{2}.\\[8.0pt] \end{array}\right.\end{eqnarray}$$
Using this definition, particles with
 $\unicode[STIX]{x0394}y_{i}>0$
are displaced closer to the wall, while particles with
 $\unicode[STIX]{x0394}y_{i}<0$
are displaced towards the centre of the channel. Very low strain amplitudes,
 $\unicode[STIX]{x1D6FE}_{0}<2$
, show only a small displacement of less than
 $0.1a$
, consistent with the threshold strain amplitude for irreversibility found by experiments in homogeneous flow. When the strain amplitude is low,
 $2<\unicode[STIX]{x1D6FE}_{0}<7$
, the particles display an average displacement towards the centreline of the channel,
 $\langle \unicode[STIX]{x0394}y\rangle <0$
. From figure 7, this displacement is linear with time, with a small average cross-stream displacement of
 $0.02{-}0.05a$
per oscillation. At high strain amplitude,
 $\unicode[STIX]{x1D6FE}_{0}\geqslant 10$
, the particles have a small average positive displacement,
 $\langle \unicode[STIX]{x0394}y\rangle >0$
. Particles in a Couette flow that migrate closer to the walls have a larger streamwise velocity, and thus return and move past their initial streamwise position by the end of the period. The resulting streamwise particle displacement corresponds to the parallelogram extension in clouds subject to a high strain amplitude Couette flow, shown in figure 4. Figure 7 also shows the average number of measurable unique particle contacts per oscillation. For
 $2\leqslant \unicode[STIX]{x1D6FE}_{0}\leqslant 6.25$
, the number of contacts per oscillation is approximately constant. At larger strain amplitudes,
 $\unicode[STIX]{x1D6FE}_{0}\geqslant 7.5$
, the number of contacts starts higher initially, and decreases over the first several oscillations to reach a constant value.
Several features are observed for the clouds at lower strain amplitudes during the course of an oscillation cycle. First is the rotation of the cloud in the shear flow while the cloud retains a compact form, followed by a near return to the initial cloud shape. Over many oscillations there is a net development into an elliptic shape, aligned and elongated in the streamwise direction but slightly compressed in the direction of shear. Overall there is a net increase in the volume of the cloud and dilution of the particle volume fraction. In summary, the height of the cloud in the wall-normal direction decreases after many oscillations, while the cloud extends along the channel centreline.
Further insight comes from looking at the mean volumetric flow field, averaged in the spanwise direction. This planar flow
 $(\langle v\rangle ,\langle w\rangle )$
is incompressible and is given by the FCM scheme. A short time into the forward half-cycle,
 $\dot{\unicode[STIX]{x1D6FE}}t=0.75$
, the presence of the cloud induces a flow in the wall-normal direction,
 $\langle v\rangle$
, as shown in figure 8(a), along with the vorticity in the spanwise direction,
 $\langle \unicode[STIX]{x1D714}_{x}\rangle$
, in figure 8(b). The vorticity within the cloud is noise due to averaging and the random particle positions. While the cloud is porous and deformable, not solid, in this more compact state it significantly blocks the flow. This causes a recirculation of the fluid from the shear flow, and induces a rotational velocity inside the cloud. The induced flow is symmetric with respect to the background Couette flow.
At
 $\dot{\unicode[STIX]{x1D6FE}}t=2.5$
, the induced wall-normal flow is still essentially symmetric, as shown in figure 9(a). The direct rotation of the cloud is weaker but the bulk stresslet of the cloud and the associated vorticity distribution are still significant. The net effect is for a compression of the cloud towards the centreline. While this is reversed on the return half-cycle, there is an asymmetry since the particle contact forces (on each oscillation) break the symmetry of the flow. This asymmetry creates a mismatch between the forward and reverse sweeps of the cloud as the cloud first expands to a sheared cross-section and then contracts, resulting in a net displacement towards the centreline over many periods, for
 $2<\unicode[STIX]{x1D6FE}_{0}<7$
.
(a) Wall-normal velocity field at
 $\dot{\unicode[STIX]{x1D6FE}}t=0.75$
induced by the presence of the particle cloud in the Couette flow. The flow field is averaged in the spanwise direction. The location of the particle cloud is represented by the solid ellipse. (b) Average vorticity field in the spanwise direction.
 $H_{y}/a=40$
.

(a) Wall-normal velocity field at
 $\dot{\unicode[STIX]{x1D6FE}}t=2.5$
induced by the presence of the particle cloud in the Couette flow. The flow field is averaged in the spanwise direction. The location of the particle cloud is represented by the solid ellipse. (b) Average vorticity field in the spanwise direction.
 $H_{y}/a=40$
.

Example of particle locations over one period in one planar slice in the spanwise direction. Here,
 $H_{y}=24a$
,
 $\unicode[STIX]{x1D6FE}_{0}=10$
and
 $\unicode[STIX]{x1D719}=40\,\%$
. The two shaded particles interact through the contact force at
 $t=4.25T$
, with the overtaking particle being displaced towards the upper wall by
 $t=4.5T$
. The particles are displaced from their original positions at the end of the period, with the overtaking particle having a greater displacement in the streamwise direction.

The displacement due to the contact force increases with the strain amplitude, and contributes significantly to the displacement towards the channel walls at higher strain amplitude. This is illustrated in the example trajectories of two particles that come into contact during an oscillation in figure 10. During the forward half-period the overtaking particle is displaced closer to the channel wall, and then moves back past its initial position on the reverse half-period. When
 $R_{ref}$
is increased the overtaking particle has a larger displacement in the cross-stream direction, and thus a higher velocity during the rest of the cycle causing a larger backward extension of the cloud.
To examine when the contact pressure is significant in the particle irreversibility, we consider the average contact pressure,
 $\langle P\rangle /\unicode[STIX]{x1D70F}_{w}$
, defined as in (2.3) and (2.4). Figure 11(a) shows the variation of the particle-averaged contact pressure over one period for strain amplitudes
 $\unicode[STIX]{x1D6FE}_{0}=5$
and
 $\unicode[STIX]{x1D6FE}_{0}=10$
, scaled by the average wall shear stress,
 $\unicode[STIX]{x1D70F}_{w}=\unicode[STIX]{x1D702}\dot{\unicode[STIX]{x1D6FE}}$
. Because the contact force has a very short range relative to the size of the particles a significant contact pressure develops only develops when the particles are tightly squeezed together. When the flow reverses at
 $t=T/2$
the particle contacts are able to relax and the contact pressure instantaneously drops to zero. It takes a few strain units for the contact force to develop again (Peters et al.
Reference Peters, Ghigliotti, Gallier, Blanc, Lemaire and Lobry2016; Cui et al.
Reference Cui, Howard, Maxey and Tripathi2017). When
 $\unicode[STIX]{x1D6FE}_{0}=5$
, the contact pressure reaches its maximum value only at the end of each half-period. In contrast, for
 $\unicode[STIX]{x1D6FE}_{0}=10$
, the maximum on the first half-cycle is only slightly higher than the value at
 $t=T/4$
. The asymmetry between the first half-cycle and the second half-cycle in figure 11(a) occurs because the shearing of the cloud in the first half-cycle results in a long, thin profile, increasing cross-sectional area of the cloud and reducing the volume fraction and the number of particles in contact. At the end of the second half-cycle the cloud returns to close to its initial shape, where the cross-sectional area is at a minimum and the volume fraction is at a maximum.
(a) Average contact pressure over one period for
 $\unicode[STIX]{x1D6FE}_{0}=5$
and
 $\unicode[STIX]{x1D6FE}_{0}=10$
, averaged over
 $4T-12T$
. (b) Average contact pressure at
 $T/4$
and
 $T/2$
, averaged over
 $4T-12T$
. The pressure is still developing for
 $\unicode[STIX]{x1D6FE}_{0}<5$
.
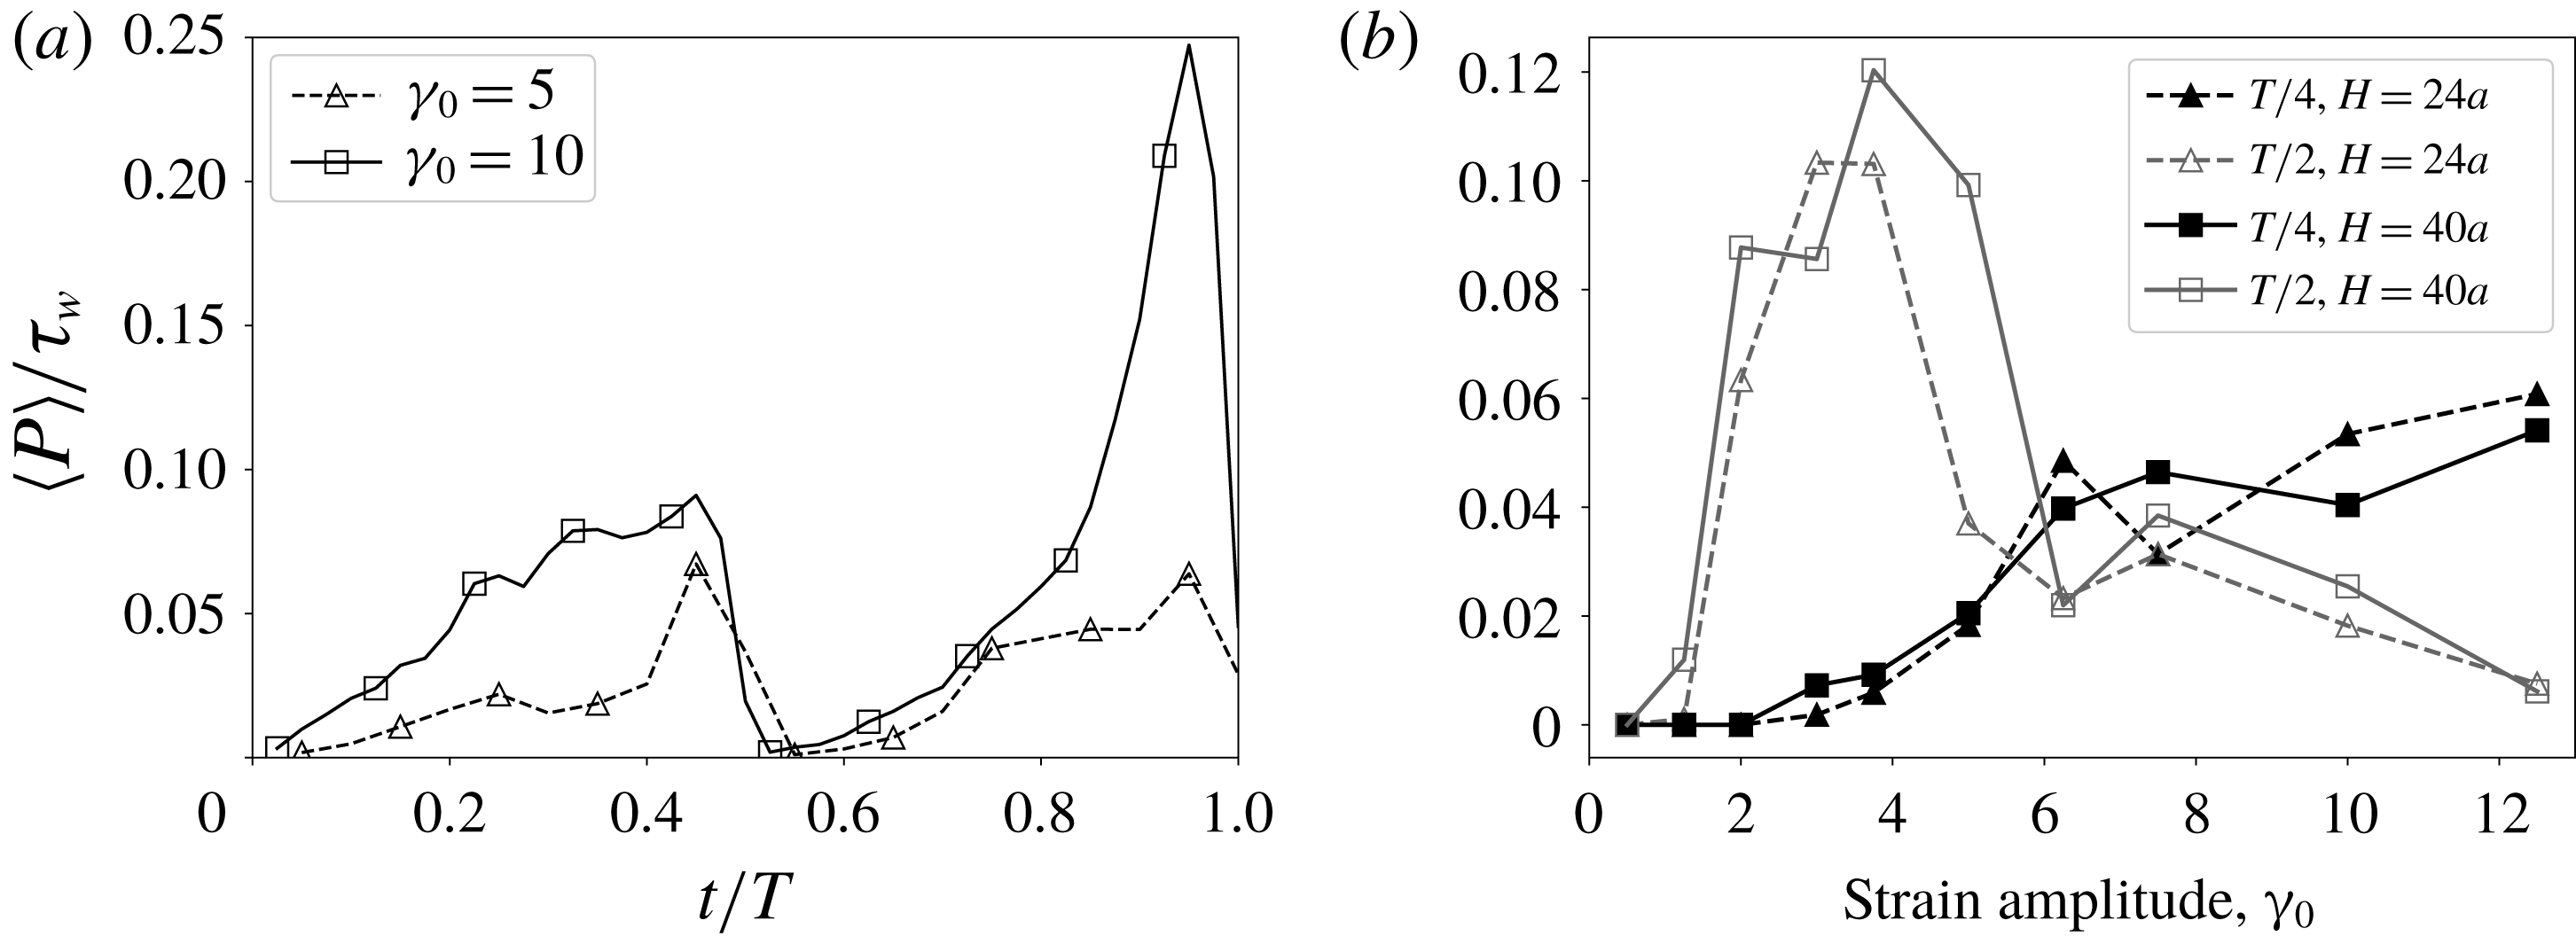
Figure 11(b) shows the contact pressure at times
 $t=T/4$
and just before reversal at
 $t\approx T/2$
for channel heights
 $H_{y}=24$
and
 $H_{y}=40.$
The pressure is still developing for
 $\unicode[STIX]{x1D6FE}_{0}\leqslant 6$
at
 $t=T/4$
, and reaches a maximum at
 $t=T/2$
. For very low strain amplitude,
 $\unicode[STIX]{x1D6FE}_{0}<2$
, the contact pressure is still very low at
 $t=T/2$
, corresponding to the cases that are reversible on the macroscopic scale. At high strain amplitude,
 $\unicode[STIX]{x1D6FE}_{0}>8$
, the contact pressure drops significantly at
 $t=T/2$
due to the elongation of the cloud.
(a,b)
 $\unicode[STIX]{x1D6FE}_{0}=5$
. (c,d)
 $\unicode[STIX]{x1D6FE}_{0}=10$
. (a,c) Scatter plots of all particle displacements in the cross-stream direction over one period (
 $|\unicode[STIX]{x0394}y|$
) with respect to the maximum contact pressure experienced during that period. (b,d) Probabilities of particle displacements. The white bars are particles where the maximum contact pressure for that period is zero, so the particles have no contact with another particle. Solid black bars are non-zero contact pressure at some point during one oscillation. While nonlinear hydrodynamic interactions can cause a displacement in the cross-stream direction, larger displacements are almost always accompanied by a non-zero contact pressure. The higher strain amplitude is associated with higher displacements and larger maximum contact pressures.

Figure 12 shows scatter plots of the maximum contact pressure and cross-stream displacement experienced by each particle during one oscillation. Particles that do not have any contact interactions with other particles are indicated by points on the
 $y$
-axis. Some of these particles do experience a cross-stream displacement, indicating that a particle may not need to come into contact with another particle to experience an irreversible displacement. However, as illustrated in figure 3, even without a direct contact a particle can be irreversibly displaced by the contact interactions of other nearby particles and subsequent hydrodynamic interactions. The maximum contact pressure is typically not associated with the largest displacements because particles that are being squeezed between multiple other particles will experience a large contact pressure but their mobility may be limited by the presence of neighbouring particles. In addition, figure 12 shows the conditional probabilities of cross-stream displacement values given that the particle did or did not experience a contact event during that oscillation. Particles that undergo a direct contact interaction with another particle are statistically more likely to have a larger cross-stream displacement. For
 $\unicode[STIX]{x1D6FE}_{0}=5$
, only
 $0.46\,\%$
of particles that do not experience a contact event have a displacement greater than
 $0.38a$
, versus
 $4.4\,\%$
of particles that experience a contact event. For
 $\unicode[STIX]{x1D6FE}_{0}=10$
,
 $12.56\,\%$
of particles with no contact event have
 $\unicode[STIX]{x0394}y\geqslant 0.34a$
, compared to
 $40.08\,\%$
of particles with a contact event. Here, the particle contact force gives the most significant particle displacements in a single oscillation cycle. But the secondary effects of the contact force on neighbouring particles through short-range hydrodynamics can give small irreversible displacements that accumulate over many oscillations.
3.2 Spherical clouds
Previous experiments have used clouds with an initial spherical shape instead of a circular cylinder (Metzger & Butler Reference Metzger and Butler2012). In order to provide a direct comparison with experiments, as well as to give additional insight into the cylindrical clouds, in this section we consider spherical clouds of densely packed particles in an oscillating flow. The clouds are seeded using the procedure described in § 2 with an initial radius of
 $R/a=10$
and volume fraction
 $\unicode[STIX]{x1D719}=40\,\%$
, and contain 401 particles. The channel height is fixed at
 $H_{y}=40a$
.
Initial particle positions (a) and positions after twenty oscillations for spherical clouds with varying strain amplitudes for channel height
 $H_{y}=40a$
. Particles are actual size and are projected onto the
 $yz$
-plane.

The particle positions after twenty oscillations are shown in figure 13. In comparison to the cylindrical clouds in figure 4, the spherical clouds show greater particle dispersion. The parallelogram shape that appears for high strain amplitude with cylindrical clouds is less obvious in spherical clouds. This could be due to differences in geometry, as cylindrical clouds have a higher proportion of particles towards the upper and lower edges of the clouds, creating more contacts between particles in these locations during each oscillation. Moderate strain amplitude clouds,
 $\unicode[STIX]{x1D6FE}_{0}=5$
and
 $\unicode[STIX]{x1D6FE}_{0}=7.5$
, predominately extend along the channel centreline.
(a) Volume fraction of the spherical cloud after each oscillation, with various values of strain amplitude
 $\unicode[STIX]{x1D6FE}_{0}$
. The cloud is assumed to be an ellipsoid when calculating the volume fraction. (b) Comparison of the initial spherical cloud volume fraction (○) and volume fraction after twenty oscillations (▫). The solid line is the critical curve from Pine et al. (Reference Pine, Gollub, Brady and Leshanksy2005) for irreversibility in a homogenous shear flow, given by
 $\unicode[STIX]{x1D6FE}_{0}=C\unicode[STIX]{x1D719}^{-\unicode[STIX]{x1D6FC}}$
, where
 $C=0.14$
and
 $\unicode[STIX]{x1D6FC}=-1.93$
.

Figure 14 shows the change in the cloud volume fraction over many oscillations, and provides a direct comparison to figure 3 in Metzger & Butler (Reference Metzger and Butler2012). The volume fraction is calculated at the end of each oscillation by assuming the cloud is a perfect ellipsoid with major axis oriented parallel to the streamwise direction,
 $z$
. The lengths of the axes are found by the minimum and maximum particle locations in each direction. Visual inspection of figure 13 shows that this is a reasonable approximation for
 $\unicode[STIX]{x1D6FE}_{0}<7.5$
, but may overestimate the volume fraction for higher strain amplitude clouds when there are loose particles at the front and tail of the cloud. In addition, it should be noted that the initial volume fraction, when calculated in this manner, is lower than the initial seeding of
 $\unicode[STIX]{x1D719}=40\,\%$
, because the particles are not constrained during the seeding expansion step resulting in a slightly larger initial cloud radius. In figure 14(a) the volume fraction shows a large initial drop during the first oscillation, then smaller decreases after each subsequent cycle. Increasing the strain amplitude decreases the volume fraction after each oscillation, with the largest difference during the initial oscillation. Figure 14(b) shows the initial volume fraction and the volume fraction after twenty oscillations from figure 14(a), along with the critical volume fraction curve for self-diffusivity in a homogeneously seeded channel for a given strain amplitude from Pine et al. (Reference Pine, Gollub, Brady and Leshanksy2005). Below this curve, a homogeneous oscillating suspension flow is reversible. As found by Metzger & Butler (Reference Metzger and Butler2012), the spherical cloud elongates over multiple oscillations in the velocity direction, decreasing in volume fraction until it drops below the critical volume fraction for the strain amplitude.
Both the spherical and cylindrical clouds with
 $\unicode[STIX]{x1D719}=40\,\%$
display similar trends that are dependent on the strain amplitude. Below the critical strain amplitude in Pine et al. (Reference Pine, Gollub, Brady and Leshanksy2005), the clouds are macroscopically reversible, with no changes in their size or position over many oscillations. When the strain amplitude is above the critical strain amplitude, and below
 $\unicode[STIX]{x1D6FE}_{0}\approx 7.5$
, the cloud extends along the channel centreline, creating an ellipsoid cloud in the spherical case and an elliptic cylinder in the cylindrical case, and undergoes a slight compression towards the channel centreline. With strain amplitude above
 $\unicode[STIX]{x1D6FE}_{0}\approx 7.5$
, the cloud shows a backward extension of the upper and lower edges of the initial cross section, creating a parallelogram shape. This backward extension is more evident for the cylindrical clouds, which have a greater number of particles in the edges of the cloud closest to the channel walls. The particle contact force drives the backward extension, and a strain amplitude of
 $\unicode[STIX]{x1D6FE}_{0}\approx 7.5$
corresponds to the time that the contact pressure needs to develop its maximum value during each half-cycle.
4 Higher volume fraction clouds,
$\unicode[STIX]{x1D719}=55\,\%$

Distinctive behaviour emerges for large particle clouds in experiments with higher volume fraction, as noted by Metzger & Butler (Reference Metzger and Butler2012). When
 $R/a\approx 20$
and
 $\unicode[STIX]{x1D719}$
is large, the particles form a galaxy shape with the centre of the cloud rotating as if it was a rigid body and shedding particles in the front and back to form the galaxy arms. The galaxy shape did not form at the same volume fraction when
 $R/a\approx 12$
. In this section we will fix the volume fraction at
 $\unicode[STIX]{x1D719}=55\,\%$
, while varying the radius
 $R$
of the cylindrical cloud. The channel height is set as
 $H_{y}/R=4$
, except for cloud radius
 $R/a=5$
where
 $H_{y}/R=4.8$
. In all cases, the strain amplitude is chosen as
 $\unicode[STIX]{x1D6FE}_{0}=10$
to be high enough to allow time for the galaxy arms to develop.
Results similar to those in the experiments are seen in the present simulations, where the galaxy formation depends on the size of the particle cloud, as shown in figure 15. For
 $R/a<10$
, the elongation behaviour discussed in § 3 is present, while for
 $R/a>15$
, galaxies are formed, consistent with the experimental results (Metzger & Butler Reference Metzger and Butler2012). The critical radius for formation of a galaxy depends on the volume fraction of the cloud. If the particles are seeded in a hexagonal pattern, so that the volume fraction is close to the maximum packing limit for spheres, galaxy formation can be seen at
 $R/a=8$
. In contrast, clouds with lower volume fraction,
 $\unicode[STIX]{x1D719}=40\,\%$
, were not observed to rotate at
 $R/a=20,$
 $30$
or
 $80$
.
Particle positions after
 $\dot{\unicode[STIX]{x1D6FE}}t=30$
(a) and
 $\dot{\unicode[STIX]{x1D6FE}}t=40$
(b), for various values of
 $R/a$
with initial volume fraction
 $\unicode[STIX]{x1D719}=55\,\%$
. When
 $R/a\leqslant 10$
, the clouds extend with the imposed shear and return to their original positions after each oscillation. For
 $R/a>10$
, the clouds form a galaxy-like shape both on their extension and at the end of the oscillation. Particles are actual size.

When the particles are forming the galaxy the centre of the cloud appears to rotate as a solid cylinder with a small elongation in the streamwise direction. This can be seen by looking at the wall-normal velocity field,
 $\langle v\rangle$
, around the cloud, shown in figure 16 at
 $\dot{\unicode[STIX]{x1D6FE}}t=30$
(
 $t=1.5T$
). In comparison with figures 8(a) and 9
a) for
 $\unicode[STIX]{x1D719}=40\,\%$
, the blockage caused by the presence of the cloud induces a stronger wall-normal velocity when
 $\unicode[STIX]{x1D719}=55\,\%$
, with a peak blockage of
 $25\,\%$
of the shear flow compared with
 $10\,\%$
for
 $\unicode[STIX]{x1D719}=44\,\%$
. Here, the effect is strong enough that the cloud continues to rotate over the entire period instead of shearing with the flow.
Greater insight into the movement of the particles is found by colour coding and tracking the particles that form the galaxy arms. In figure 17 the particles in the arms are colour coded at
 $\dot{\unicode[STIX]{x1D6FE}}t=30$
(red and blue particles) and
 $\dot{\unicode[STIX]{x1D6FE}}t=40$
(green particles.) The particles are then tracked back to their original positions at
 $\dot{\unicode[STIX]{x1D6FE}}t=0$
. Particles forming the arms come from the cylinder edge, and are localized within the cloud. The supplementary movie available at https://doi.org/10.1017/jfm.2018.534 shows that during the first half-period the cloud rotates as well as extends until the edge of the cloud, represented by the blue particles, is large enough that some particles reach the area outside the cloud where the wall-normal velocity changes sign. At this stage the blue particles break off from the cloud, forming the arm of the galaxy during the first half-cycle. The particles initially closer to the edge of the cloud have positions closer to the tips of the arms. The process reverses during the second half of the oscillation, with the blue and red particles rejoining the cloud and the green particles forming the arms. The shape and length of the cloud arms therefore depend on the flow field outside the cloud, caused by the blockage effect and the modified bulk stresslet of the particle cloud. In test cases changing the channel length effects the length and number of particles in the galaxy arms, but not the onset of rotation in the cloud.
Plot of particle locations relative to the averaged wall-normal velocity
 $\langle v\rangle$
at
 $\dot{\unicode[STIX]{x1D6FE}}t=30$
(
 $t=1.5T$
) for
 $R/a=20$
,
 $H_{y}/a=80$
. The particle arms form in the locations where the wall-normal velocity field induced by the cloud rotation switches direction. As for lower volume fraction clouds, the stresslet of the bulk cloud causes the cloud to rotate. A movie illustrating the particle migration is available in the supplementary material.

 $R/a=20$
. Particles colour coded based on their positions at
 $\dot{\unicode[STIX]{x1D6FE}}t=40$
(green) and
 $\dot{\unicode[STIX]{x1D6FE}}t=30$
(red and blue.) The particles that end up in the galaxy arms outside of the cloud at
 $\dot{\unicode[STIX]{x1D6FE}}t=30$
and
 $\dot{\unicode[STIX]{x1D6FE}}t=40$
originate in the outside of the cloud. The particles that are in the arms at
 $\dot{\unicode[STIX]{x1D6FE}}t=30$
are in the bottom and top of the cloud at
 $\dot{\unicode[STIX]{x1D6FE}}t=0$
, with particles further out in the arm closer to the top and bottom of the cloud. The particles that are in the arms at
 $\dot{\unicode[STIX]{x1D6FE}}t=40$
are in the edge of the cloud, but rotated by about
 $45^{\circ }$
. During the first half-period the cloud rotates approximately
 $90^{\circ }$
in the clockwise direction, shown by the rotation of the green particles.

(a,b)
 $R/a=10$
(extensional). (c,d)
 $R/a=20$
(rotational). (a,c) Scatter plots of all particle displacements in the cross-stream direction over one period (
 $|\unicode[STIX]{x0394}y|$
) with respect to the maximum contact pressure experienced during that period. Particles that end up outside the initial footprint of the cloud, defined as
 $r>R+2a$
to account for the initial transient expansion of the cloud, are coloured red. (b,d) Probabilities of particle displacements.

In the smaller extensional clouds, particles undergo net displacements directly due to particle contact forces and indirectly through hydrodynamic interactions while contacting particles as discussed in figure 12. Figure 18 shows the analogous scatter plots and probabilities for rotational clouds. Here, the particles that form the galaxy arms have a significant displacement in the
 $y$
-direction without a particle contact force. Because of the high volume fraction, almost all particles have contact with another particle at some point during an oscillation, and the particles in the body of the cloud can experience extremely large contact pressures due to the tight packing of the particles. Due to the high volume fraction, all particles in the cloud are within the lubrication force cutoff distance of at least one particle that comes into direct contact with another particle over one oscillation. To achieve a meaningful average, we compare particles with a maximum pressure
 $P/\unicode[STIX]{x1D70F}_{w}\leqslant 1$
instead of
 $P/\unicode[STIX]{x1D70F}_{w}=0$
in figure 12. In comparison to the extensional cloud with
 $R=10a$
, the rotating cloud with
 $R=20a$
has a large population of particles that have a low maximum pressure but a large cross-stream displacement, representing the particles that end up outside the initial footprint of the rotating cloud. This is due to two factors: the induced wall-normal flow outside the cloud, and the tight constraints on particles within the cloud body, limiting two-particle interactions in the shear flow. Because the particles that form the galaxy arms are not displaced out of the cloud solely due to contact forces on those particles, varying the cutoff distance of the contact force,
 $R_{ref}$
, does not change the qualitative behaviour of the cloud, shown in figure 19, as long as the particles still come into contact.
Particle positions after
 $\dot{\unicode[STIX]{x1D6FE}}t=20$
(a) and
 $\dot{\unicode[STIX]{x1D6FE}}t=30$
(b), for various values of
 $R_{ref}$
with
 $R/a=15$
and initial volume fraction
 $\unicode[STIX]{x1D719}=55\,\%$
. Changing
 $R_{ref}$
yields only small changes in the length of the maximum extension, and reduces the number of particles in the arms at the end of each period so that the cloud returns closer to its initial positions. Particles are actual size.

In figure 20 we consider the average area fraction profile, contact pressure, and angular velocity of the cloud taken just before
 $\dot{\unicode[STIX]{x1D6FE}}t=20$
(
 $\dot{\unicode[STIX]{x1D6FE}}t=T$
). The averaged area fraction,
 $\unicode[STIX]{x1D719}(r)$
, is defined as
 $$\begin{eqnarray}\unicode[STIX]{x1D719}(r)=\frac{1}{2\unicode[STIX]{x03C0}rL_{x}}\mathop{\sum }_{i=1}^{N_{p}}\int _{0}^{L_{x}}\int _{0}^{2\unicode[STIX]{x03C0}}\unicode[STIX]{x1D712}_{p}^{i}(x,r,\unicode[STIX]{x1D703})\;\text{d}\unicode[STIX]{x1D703}\,\text{d}x,\end{eqnarray}$$
where
 $\unicode[STIX]{x1D712}_{p}^{i}(x,r,\unicode[STIX]{x1D703})$
is the indicator function for the
 $i\text{th}$
particle,
 $N_{p}$
is the number of particles and
 $r$
is the distance from the centre of mass of the cloud in the
 $yz$
-plane, denoted as in (3.1),
 $\boldsymbol{r}^{m}=(y_{cm},z_{cm})$
. The phasic average of a variable
 $\boldsymbol{g}$
is defined as in Drew (Reference Drew1983):
 $$\begin{eqnarray}\langle \boldsymbol{g}\unicode[STIX]{x1D712}_{p}\rangle (r)=\frac{1}{2\unicode[STIX]{x03C0}rL_{x}}\mathop{\sum }_{i=1}^{N_{p}}\int _{0}^{L_{x}}\int _{0}^{2\unicode[STIX]{x03C0}}\boldsymbol{g}^{i}(x,r,\unicode[STIX]{x1D703})\unicode[STIX]{x1D712}_{p}^{i}(x,r,\unicode[STIX]{x1D703})\;\text{d}\unicode[STIX]{x1D703}\,\text{d}x.\end{eqnarray}$$
The angular velocity of the
 $i\text{th}$
particle,
 $\unicode[STIX]{x1D6FA}^{i}$
, is found from the moment of momentum scaled by
 $m(r^{i})^{2}$
,
 $$\begin{eqnarray}\unicode[STIX]{x1D6FA}^{i}=\frac{\boldsymbol{x}^{i}\times m\boldsymbol{v}^{i}}{m(r^{i})^{2}},\end{eqnarray}$$
where
 $\boldsymbol{x}^{i}=(y^{i},z^{i})$
and
 $\boldsymbol{v}^{i}=(v^{i},w^{i})$
are the
 $y$
and
 $z$
components of the position and velocity, respectively. Here,
 $r^{i}=||\boldsymbol{x}^{i}-\boldsymbol{r}^{m}||$
, the distance between the centre of particle
 $i$
and the centre of mass of the cloud.
Volume fraction profiles (a), average contact pressure profiles (b), average shear stress profile (c) and average angular velocity profiles relative to the centre of mass of the cloud (d) taken just before
 $\dot{\unicode[STIX]{x1D6FE}}t=20$
. The contact pressure increases with the size of the cloud. The angular velocity of the particles is largest at the outside of the cloud, where the particles can be advected by the surrounding fluid flow.

For the non-rotating clouds,
 $R/a\leqslant 10$
, the volume fraction drops significantly from
 $\unicode[STIX]{x1D719}=55\,\%$
after one period, while when
 $R/a>10$
, the volume fraction remains high in the centre of cloud. The volume fraction decreases at the edges of the cloud, as the cloud is free to expand under the influence of the particle pressure stemming from the tightly packed particles.
The contact pressure, shown in figure 20(b), is highest in the centre of the cloud, with the maximum value increasing with the cloud radius
 $R$
. At
 $\dot{\unicode[STIX]{x1D6FE}}t=20$
the cloud has undergone one oscillation cycle, and the particles have expanded outside the initial footprint of the cloud, creating a significant volume fraction at distances greater than the initial cloud radius. However, the contact pressure quickly drops to zero for particles further from the centre of mass of the cloud than the initial cloud radius,
 $r/a>R/a$
, because the particles are not constrained.
The angular velocity of the cloud in figure 20(d) is highest at the outside edge of the cloud, and goes to zero in the centre of the cloud, demonstrating that the cloud is not rotating as solid cylinder but instead the outer layers are shearing in comparison to the cylinder core. The particles that form the arms of the galaxy are primarily advected by the shear flow, with some wall-normal migration due to the velocity field induced by the stresslet and bulk hydrodynamic effect of the cloud, and do not have a significant angular velocity. The maximum angular velocity of the cloud is much less than that expected from solid body rotation of a cylinder in shear flow. The cloud core could plausibly be represented as a deformable porous cylinder using a Brinkman model (Durlofsky & Brady Reference Durlofsky and Brady1987). Such a model with the suspension shear viscosity and permeability varying with decreasing volume fraction towards the edge of the cloud would be consistent with the observed differential rotation.
The present simulations do not include a Coulomb friction with the inter-particle contacts. This was deliberate so as to identify those features that can be reproduced without this additional physics model. Friction models are relevant in dense suspensions, especially where jamming may occur, however, they add additional physics complicating the interpretation of simulation results (Gallier et al.
Reference Gallier, Lemaire, Peters and Lobry2014; Peters et al.
Reference Peters, Ghigliotti, Gallier, Blanc, Lemaire and Lobry2016; Townsend & Wilson Reference Townsend and Wilson2017; Pednekar, Chun & Morris Reference Pednekar, Chun and Morris2018; Singh et al.
Reference Singh, Mari, Denn and Morris2018). They primarily affect the rheology of the suspension, including increasing the suspension viscosity. Even without a frictional force we find that the particle contact force still contributes to the shear stress. Examination of the effective torque due to the contact force on a thin shell of particles transmitted to the particles inside that shell shows that there is a significant net torque associated with this contribution to the particle stress. The magnitude of the contact stress, and resulting torque, is comparable to
 $\unicode[STIX]{x1D70F}_{w}$
for large clouds where
 $R/a>15$
.
Metzger & Butler (Reference Metzger and Butler2012) proposed the ‘pore-pressure feedback’ effect as an explanation of the mechanism causing rotation in the galaxy clouds. The pore pressure is relevant for densely packed granular material which is subjected to an imposed shear, causing the pores between the particles to dilate. Balancing the pore-pressure effect with the shear stress gives a critical cloud size of
 $R/a\approx 15$
for onset of rotation in the high volume fraction clouds (Metzger & Butler Reference Metzger and Butler2012). The results from the simulations show that there is a differential rotation within the cloud, and therefore the cloud does not rotate as a solid body, nor are the particles in a jammed state when the galaxy formation occurs. Further, there is no model for friction between the particles included in the simulations. The present results do not support the hypothesis from Metzger & Butler (Reference Metzger and Butler2012) that the pore-pressure effect is critical for galaxy formation, although further study is needed to fully elucidate the dynamics of rotating high volume fraction clouds.
5 Conclusions
In this study, we have considered cylindrical and spherical clouds of densely packed neutrally buoyant particles suspended in an oscillating Couette flow. Many of the features observed in the experiments by Metzger & Butler (Reference Metzger and Butler2012) have been reproduced in the present simulations. The simulations provide further insights. After many oscillations, the state of the cloud is found to depend both on the cloud volume fraction and the strain amplitude. When the cloud is in a compact state it represents a dense, porous body that significantly blocks the flow. This induced bulk flow from the presence of the cloud generates a wall-normal flow causing the cloud to rotate initially. The bulk stresslet generated by the particles can squeeze and stretch the cloud, which may enhance the rotation. At lower volume fraction,
 $\unicode[STIX]{x1D719}=0.4$
, the shear flow from the imposed Couette flow dominates, and the cloud reaches a long, sheared profile at the end of each half-oscillation. For higher volume fraction,
 $\unicode[STIX]{x1D719}=0.55$
, the induced rotational flow creates a differential rotation in the cloud when the cloud is large enough. While rotation dominates the dynamics of the bulk of the cloud, the cloud does elongate slightly with the shear flow, causing some particles to be displaced and advected away from the cloud forming the galaxy arms. In this case, the rotation of the cloud is determined by the ratio of the cloud radius to particle radius. Clouds with
 $R/a\leqslant 10$
at
 $\unicode[STIX]{x1D719}=0.55$
shear in the same manner as the lower volume fraction clouds with
 $\unicode[STIX]{x1D719}=0.4$
.
When two particles come into contact the particles are irreversibly displaced across streamlines due to a short-range contact force in the simulations, which generates an irreversible stresslet. This cross-stream displacement increases with particle roughness, represented by the size of the cutoff barrier for the particle contact force. At volume fraction
 $\unicode[STIX]{x1D719}=0.4$
, the contact force creates an additional mechanism for particles to progressively escape out of the cloud at high strain amplitude, provided the contact force has sufficient time to develop in each half-oscillation. The contact pressure is shown to instantaneously drop to zero after each oscillation, and must redevelop during the subsequent half-cycle. When two particles come into contact, they produce an irreversible fluid disturbance which can alter the trajectory of a third particle through localized hydrodynamics forces. The effect of this three-body interaction is seen through the number of particles in the cloud which are displaced from their original position, but do not come into contact with another particle.
This study illustrates the complex dynamics that occurs when densely packed suspensions are surrounded by regions of pure fluid in a channel, and the particles are free to expand outside the edges of the suspension. A previous study with plugs of particles in oscillating Poiseuille flow showed that the particle contact pressure plays a key role in generating a net flux of particles (Cui et al. Reference Cui, Howard, Maxey and Tripathi2017). The present work with clouds of particles demonstrates that the particle contact forces contribute significantly to the irreversible particle displacements in suspension systems, both directly through two-particle contacts and indirectly through displacement of nearby neighbours. The cloud shape over many oscillations becomes a balance between the particle contact forces and the induced fluid flow due to the bulk stresslet generated by the presence of the dense cloud.
Acknowledgements
We wish to thank the referees for their helpful comments. This material is based upon work supported by the National Science Foundation Graduate Research Fellowship under grant no. DGE 1058262. Additional support by the U.S. Department of Energy Office of Science under Award Number DE-SC0009247 is gratefully acknowledged.
Supplementary movie
Supplementary movie is available at https://doi.org/10.1017/jfm.2018.534.



