Introduction
Cystic echinococcosis (CE) is a serious, chronic zoonotic disease of humans and domestic animals caused by infection with the larval stage of the parasitic cestode Echinococcus granulosus (Gottstein et al. Reference Gottstein, Soboslay, Ortona, Wang, Siracusano and Vuitton2017; Mandal and Debmandal Reference Mandal and Debmandal2012; Vuitton et al. Reference Vuitton, McManus, Rogan, Romig, Gottstein, Naidich, Tuxun, Wen and Da Silva2020). It remains a major public health concern in the Mediterranean region, particularly in North Africa (Dakkak Reference Dakkak2010; Oudni-M’rad et al. Reference Oudni-M’rad, M’rad, Babba and Rodriguez-Morales2015). The infection is characterised by a long-standing coexistence between the parasite and the host, often without an effective immune rejection, despite the presence of both cellular and humoral immune responses (Margutti et al. Reference Margutti, Profumo, Buttari, Delunardo, Ioppolo, Ortona, Rigano, Teggi, Vaccari and Siracusano2002; Tamarozzi et al. Reference Tamarozzi, Mariconti, Neumayr and Brunetti2016). Host–parasite interactions constitute a highly complex biological process in which the host immune system mounts responses aimed at eliminating the parasite, whereas the parasite develops diverse mechanisms to evade, manipulate, and modulate host immune defences (Tamarozzi et al. Reference Tamarozzi, Mariconti, Neumayr and Brunetti2016; Vuitton et al. Reference Vuitton, McManus, Rogan, Romig, Gottstein, Naidich, Tuxun, Wen and Da Silva2020). In special physiological conditions such as pregnancy, these immunological adaptations may further influence disease progression. Kavari et al. (Reference Kavari, Ebrahimzadeh Mirzaei, Khajehasani, Asadi, Shafiee and Harandi2026) reported that clinical outcomes are influenced by disease severity and gestational age, emphasising the importance of individualised multidisciplinary management. These host immune changes emphasise the importance of exploring immunotherapeutic strategies aimed at enhancing protective responses while limiting parasite-induced immune modulation.
Echinococcus infection alters the hepatic immune response, promoting inflammatory cell infiltration and progressive liver fibrosis (Niu et al. Reference Niu, Chong, Qin, Li, Wei and Zhao2019; Zhang et al. Reference Zhang, Li and McManus2003). This fibrotic response is particularly prominent around parasitic cysts and results from excessive extracellular matrix deposition, largely mediated by activated hepatic stellate cells (HSCs) (Atmaca et al. Reference Atmaca, Gazyagci, Terzi and Sumer2019; Cui et al. Reference Cui, Wu, Lin, Cai, Wu, Xiong, Huang, Fang, Xin and Zhang2025; Tsuchida and Friedman Reference Tsuchida and Friedman2017).
Secondary experimental echinococcosis was established through intraperitoneal inoculation of viable protoscoleces (PSCs), resulting in the progressive development of hydatid cysts in mice. This experimental approach has been extensively validated and is commonly used to study parasite growth, host tissue responses, and immunomodulatory interventions against Echinococcus granulosus infection (Emery et al. Reference Emery, Leclerc, Sengphommachanh, Vuitton and Liance1998; Liance et al. Reference Liance, Ricard-Blum, Emery, Houin and Vuitton1998; Wen et al. Reference Wen, Vuitton, Tuxun, Li, Vuitton, Zhang and McManus2019). Building on this model, our earlier clinical studies demonstrated elevated levels of nitric oxide (NO) and interferon (IFN)-γ in both the sera and the supernatants of peripheral blood mononuclear cells (PBMCs) obtained from patients infected with Echinococcus granulosus (Ait Aissa et al. Reference Ait Aissa, Amri, Bouteldja, Wietzerbin and Touil-Boukoffa2006; Touil-Boukoffa et al. Reference Touil-Boukoffa, Bauvois, Sanceau, Hamrioui and Weitzerbin1998). These findings were further supported by the detection of increased levels of interleukin (IL)-17A and IL-6 in the same patients (Mezioug and Touil-Boukoffa Reference Mezioug and Touil-Boukoffa2012). Importantly, our previous experimental studies demonstrated that IL-17A plays an immunoprotective role during hydatid infection by contributing to the host’s defence mechanisms against the parasite (Labsi et al. Reference Labsi, Soufli, Khelifi, Amir and Touil-Boukoffa2018).
Given the central role of the liver in cystic echinococcosis, it appears essential to elucidate the pathological changes induced by Echinococcus infection to identify potential therapeutic strategies. CE is associated with marked hepatic injury, driven by persistent inflammation and progressive extracellular matrix accumulation, ultimately leading to fibrosis. In our current study, we investigated the antihydatid and immunoprotective effects of IL-17A in a murine model of secondary echinococcosis, with a particular focus on its impact on liver function and architecture. We also evaluated hepatic histopathological alterations, including the deposition of glycoproteins and reticulin fibres, as well as the expression of key inflammatory and fibrotic markers, including inducible nitric oxide synthase (iNOS), nuclear factor kappa B (NF-κB), tumour necrosis factor (TNF)-α, cluster of differentiation 68 (CD68), and vimentin. In addition, NO production was assessed in vitro during experimental CE to further characterise the underlying immune-inflammatory response.
Methods
Collection of E. granulosus protoscoleces and initiation of experimental echinococcosis
E. granulosus PSCs were collected as previously described (Amri and Touil-Boukoffa Reference Amri and Touil-Boukoffa2015). PSC viability was assessed prior to inoculation and determined by body movement observed under inverted microscopy and vital staining with 0.1% eosin. All samples showed >98% viability at the time of the experiment. Swiss mice were inoculated intraperitoneally (i.p.) with 2000 viable PSCs resuspended in 200 μL of sterile phosphate-buffered saline (PBS) (Labsi et al. Reference Labsi, Soufli, Khelifi, Amir and Touil-Boukoffa2018; Urrea-Paris et al. Reference Urrea-Paris, Moreno, Casado and Rodriguez-Caabeiro2002).
After two weeks of experimental infection, Swiss mice received a single intravenous (i.v.) administration of recombinant mouse IL-17A (Gibco, Life Technologies, California, USA) at concentrations of 100 pg/mL, 125 pg/mL, and 150 pg/mL via the lateral tail vein. Each mouse received a fixed injection volume of 200 μL.
Experimental design
Female Swiss albino mice (4–6 weeks old) were purchased from the Pasteur Institute (Algiers, Algeria). These mice were acclimated for 1 week before the start of experiments and kept under normal conditions with a 12-h dark/light cycle and ad libitum access to food and water. Mice ranging in weight from 21 to 23 g were divided into six groups (n = 6 mice per group) (Fig. 1). This study was approved by the National Thematic Agency for Research in Health (no. 43-ANDRS-2011).
Experimental plan. Mice were randomly divided into six experimental groups. The Ctrl group received no treatment. The PBS group received an intraperitoneal injection (i.p.) of 200 μL of sterile PBS instead of PSCs. The CE and IL-17A/CE groups received intraperitoneal injection with a suspension of 2000 viable PSCs in 200 μL of sterile PBS. The IL-17A (100 pg/mL)/CE group, IL-17A (125 pg/mL)/CE group, and IL-17A (150 pg/mL)/CE group were treated by intravenous administration (i.v.) of 200 μL of IL-17A solution at concentrations of 100, 125, and 150 pg/mL, respectively, two weeks after infection. All mice were euthanised 3 months post-PSC inoculation.

Figure 1. Long description
The flowchart organizes six experimental groups of mice. A horizontal timeline at the bottom marks three key points: Day 0: Infection, Week 2: Start I V I L-17 A for groups 4-6, and 3 months: Sacrifice endpoint.
Top section (Groups 1-3 in light blue boxes):
• Group 1: Ctrl (no treatment).
• Group 2: P B S (200 mu L P B S, I P).
• Group 3: C E (2000 P S C s in 200 mu L P B S, I P).
Bottom section (Groups 4-6 in green boxes, branching from Group 3 at Week 2):
• Group 4: I L-17 A (100 pg/m L)/C E (I V 200 mu L Prows of 100 pg/m L).
• Group 5: I L-17 A (125 pg/m L)/C E (I V 200 mu L Prows of 125 pg/m L).
• Group 6: I L-17 A (150 pg/m L)/C E (I V 200 mu L Prows of 150 pg/m L).
Horizontal arrows extend from each group box to the 3-month sacrifice endpoint.
Three months after PSC inoculation, all mice were euthanised using inhalational anaesthesia. Hydatid cysts were collected from the peritoneal cavity, and their weight and diameter were measured. The larval growth and the inhibition rate were calculated as described by Moreno et al. (Reference Moreno, Urrea-Paris, Casado and Rodriguez-Caabeiro2001).
Liver biopsies and culture
Full-thickness liver biopsies with a diameter of 3 mm were obtained from all mice. The tissue specimens were subsequently cultured in complete Dulbecco’s Modified Eagle Medium (DMEM) supplemented with 10% heat-inactivated fetal bovine serum (FBS), 100 U/mL penicillin, 0.1 mg/mL streptomycin, and 20 mM L-glutamine, at 37°C and 5% CO2 for 24 h. After incubation, supernatants were collected for nitrite level measurements. Nitrite levels were expressed as μM/mg of total protein. Estimation of total protein per well was performed using the Bradford method.
Nitrite measurement
The Griess reaction was used to determine nitrite levels in plasma as an indicator of nitric oxide production, as described previously (Touil-Boukoffa et al. Reference Touil-Boukoffa, Bauvois, Sanceau, Hamrioui and Weitzerbin1998). Briefly, 100 μL of each sample was mixed with 50 μL of Griess reagent (5% sulfanilamide, 0.5% naphthylethylenediamine dihydrochloride, 20% HCl). Samples were incubated at room temperature for 20 min, and the absorbance was read at 543 nm by spectrophotometer. The nitrite concentration was determined using a standard curve constructed with sodium nitrite (NaNO2; 0–200 μmol/mL).
Histopathological analysis
Liver samples infected with hydatid cysts and spleen samples were fixed in 10% formalin, mounted in paraffin blocks, and cut into 2-μm-thick sections. The liver sections were stained with haematoxylin and eosin to study histological changes, Masson’s trichrome stain to assess hepatic fibrosis, and toluidine blue stain to quantify inflammatory cell infiltration. The Periodic acid-Schiff stain method (PAS) was applied to assess glycoprotein content. Gomori’s silver impregnation staining was also used for the evaluation of reticulin fibres in liver and spleen.
Histological criteria were based on the degree of architectural tissue changes and cellular infiltration. Images were captured from each slide with a digital camera (Casio) on a light microscope (Motic) with ×10, ×40, and ×100 objectives. Histopathological diagnoses were performed in a double-blind fashion by pathologists.
Necroinflammatory activity was scored according to the histological activity index (HAI) of Mekonnen et al. (Reference Mekonnen, Ijzer and Nederbragt2007). Venous congestion was included in the HAI: 0, absence; 1, weak; 2, moderate; 3, severe. The HAI was also assigned according to the extent of fibrosis: 0, absence; 1, mild portal fibrosis; 2, moderate fibrosis; 3, severe fibrosis; and 4, cirrhosis. Steatosis was graded as follows: 0, absent; 1, 1–10% of hepatocytes affected; 2, 11–30% of hepatocytes affected; 3, 31–60% of hepatocytes affected; and 4, >60% of hepatocytes affected (Brissot et al. Reference Brissot, Bourel, Herry, Verger, Messner, Beau-Mont, Regnouard, Ferrand and Simon1981).
Fibrosis, characterising the pathology, is reflected by a noticeable increase in the level of reticulin. A score of 0 to 4 is given according to Bauermeister (Reference Bauermeister1971): score 0, no reticulin fibres or only fine and occasional individual perivascular fibres; score 1, occasional fine individual fibres with foci of fine fibre network; score 2, network of fine fibres in most of the section; score 3, diffuse fibre network (but no true collagen, negative trichrome staining); score 4, diffuse and often thick (network of fibres with areas of collagenisation, positive trichrome staining).
Immunohistochemical procedures
Immunohistochemical analyses of vimentin, CD68, NF-κB, TNF-α, and iNOS expression were conducted following previously described protocols, with minor modifications to adapt the procedure to local laboratory conditions (Labsi et al. Reference Labsi, Khelifi, Mezioug, Soufli and Touil-Boukoffa2016).
Slides were submitted to immunohistochemistry for incubation with rabbit monoclonal antibodies against mouse vimentin, CD68, NF-κB/p65 subunit, TNF-α, and iNOS (Santa Cruz Biotechnology, Dallas, TX, USA; diluted 1:100, 1:100, 1:100, 1:100, and 1:500, respectively). Indirect immunoperoxidase staining was performed according to the manufacturer’s instructions (DAKO, Denmark A/S). The sections were counterstained with haematoxylin. Slides were covered with Faramount Mounting Medium (S3025, DAKO, Denmark A/S) and observed using a standard microscope (Motic). Pictures were taken using a digital camera (Casio) at 40× magnification.
The percentage of cells positively stained for iNOS, TNF-α, NF-κB, vimentin, and CD68 was scored semiquantitatively. The quantification of positive cells was performed using FIJI image processing software after calibration with a graduated slide. The intensity of NF-κB/p65 immunostaining was evaluated as weak, moderate, or intense on a subjective basis. The quantification was carried out on 30 high-power fields in each liver sample by two observers. iNOS, TNF-α, and vimentin expression was evaluated on the basis of a four-point scale: ‘−’: negative staining; ‘+’: low expression, less than 10% positive cells; ‘++’: moderate expression, 10–30% positive cells; ‘+++’: intense expression, more than 30% positive cells.
Statistical analysis
A Kruskal–Wallis one-way analysis of variance by ranks was employed to compare differences among all groups. In addition, one-way ANOVA tests were used to assess the effects of treatment across groups. Probability values of P ≤ 0.05 were considered to be statistically significant. Principal components and data analyses were carried out with the use of the statistical software PAST version 4.03 and GraphPad Prism 10.
Results
Effect of IL-17A treatment on clinical parameters of experimental echinococcosis
Three months post-infection, IL-17A treatment at 125 and 150 pg/mL reduced the infectivity rate to 66.67%. Conversely, a 100% infectivity rate was recorded in the CE group and in mice treated with IL-17A at 100 pg/mL, with mortality rates of 2/6 and 1/6 animals, respectively. Hydatid cysts were mainly localised in the liver parenchyma, affecting 3/4, 4/5, 4/6, and 3/6 mice in the CE, IL-17A (100 pg/mL)/CE, IL-17A (125 pg/mL)/CE, and IL-17A (150 pg/mL)/CE groups, respectively. Histological and immunohistochemical analyses confirmed the intrahepatic localisation of hydatid cysts and the associated inflammatory response.
IL-17A treatment inhibited cyst growth by 72.3% in mice treated with 100 pg/mL, by 93.8% in the 125 pg/mL group, and by 96.9% in the 150 pg/mL group. Thus, IL-17A treatment induced a significant reduction in the clinical symptoms observed during CE. Macroscopically, IL-17A treatment at 125 pg/mL and 150 pg/mL was associated with more pronounced effects compared with the 100 pg/mL dose.
The concentration of 125 pg/mL of IL-17A decreases nitrite levels in the supernatants of cultured liver biopsies
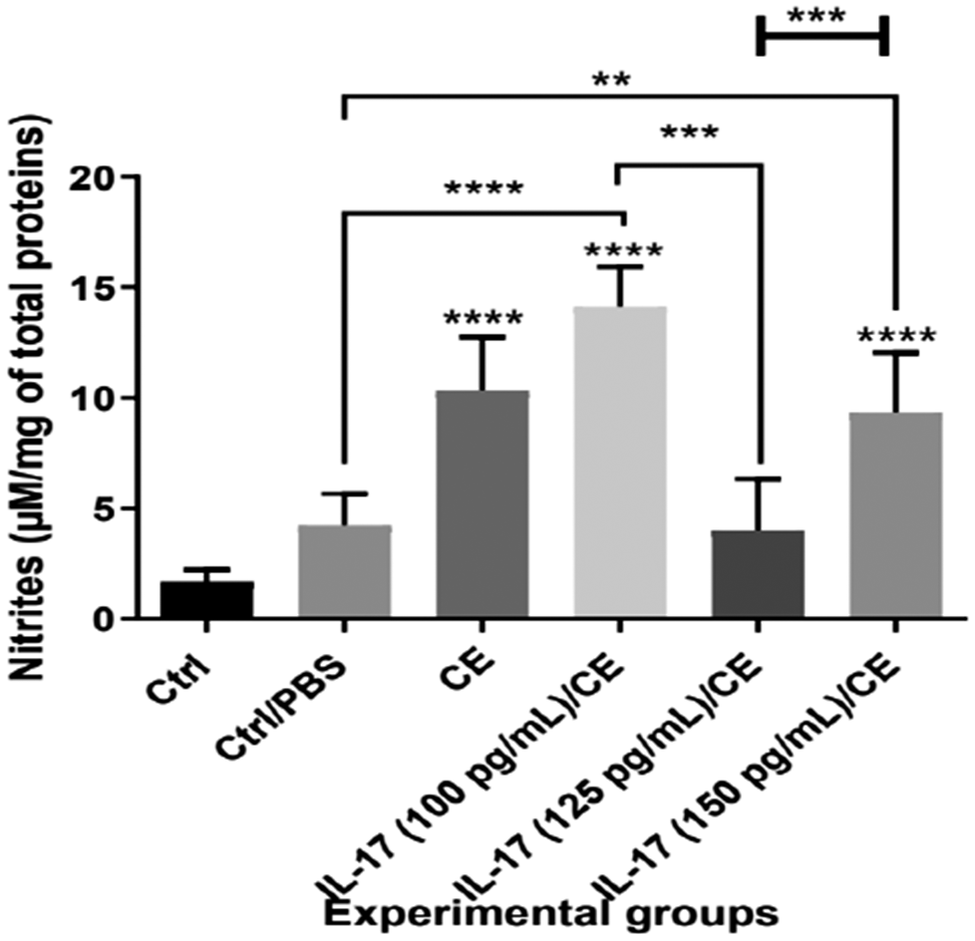
Three months after infection, NO levels in the culture supernatants of liver biopsies isolated from the CE group were significantly higher compared with the Ctrl group (10.30 ± 1.22 μM/mg of total protein vs. 1.70 ± 0.22 μM/mg of total protein, ****P ≤ 0.0001; Fig. 2). In contrast, treatment of infected mice with 125 pg/mL of IL-17A reduced NO production in culture supernatants of liver biopsies compared to CE group (4.03 ± 0.95 μM/mg of total protein vs. 10.30 ± 1.22 μM/mg of total protein, ***P ≤ 0.001; Fig. 2). No significant difference was observed between the Ctrl and PBS groups and mice treated with IL-17A at 125 pg/mL (Fig. 2).
Intravenous administration of IL-17A decreased the production of nitrites at 125 pg/mL of IL-17A in the supernatant culture of liver biopsies.
Data are reported as means ± SD. P values from one-way ANOVA test are indicated (*P ≤ 0.05, **P ≤ 0.01, ***P ≤ 0.001, ****P ≤ 0.0001).

Figure 2. Long description
A bar graph measuring Nitrites in micromolar per milligram of total proteins on the Y axis, ranging from 0 to 20. The X axis lists six experimental groups from left to right.
* Ctrl: The lowest bar, approximately 2 units.
* Ctrl forward slash P B S: Approximately 4 units.
* C E: Approximately 10 units with a significant increase indicated by four asterisks compared to Ctrl.
* I L 17 (100 pg forward slash m L) forward slash C E: The highest bar, approximately 14 units, with four asterisks compared to Ctrl.
* I L 17 (125 pg forward slash m L) forward slash C E: Approximately 4 units, showing a significant decrease compared to the 100 pg forward slash m L group (three asterisks) and the C E group (two asterisks).
* I L 17 (150 pg forward slash m L) forward slash C E: Approximately 9 units, with four asterisks compared to Ctrl.
Statistical brackets at the top highlight significant differences between the C E group and I L 17 treated groups, as well as between the different I L 17 dosage groups.
Liver architecture was improved in infected mice treated with 125 pg/mL of IL-17A
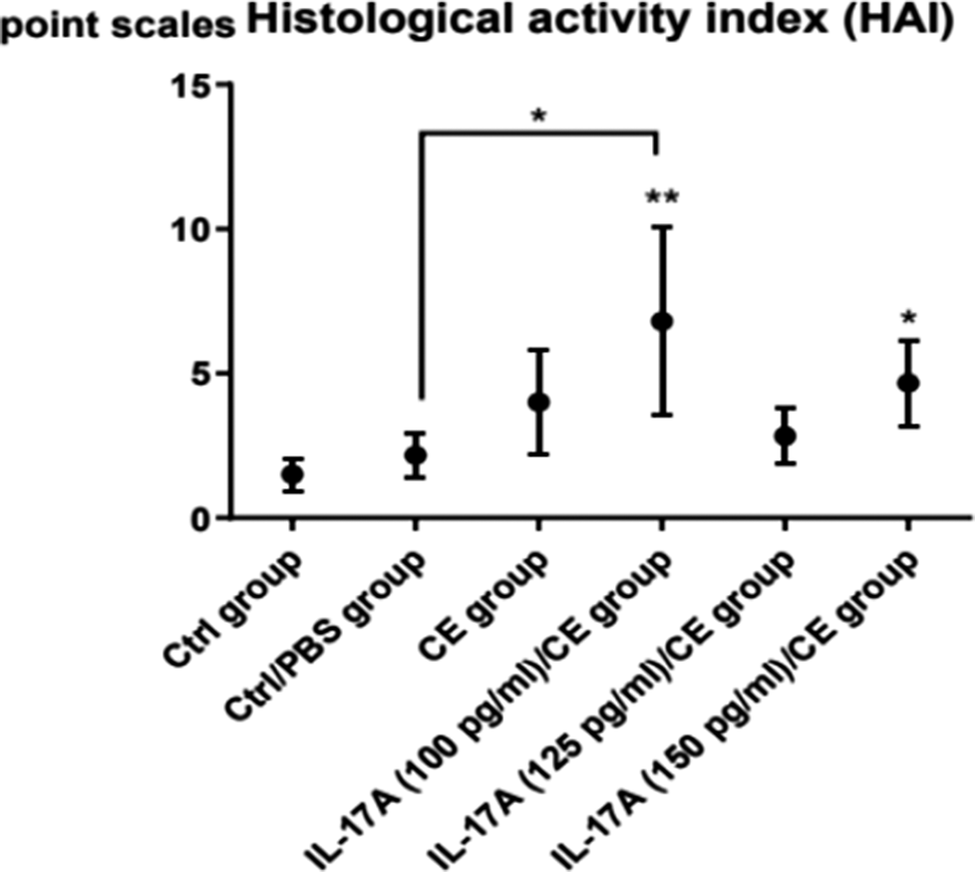
Histological analysis of livers isolated from the CE group, IL-17A (100 pg/mL)/CE group, and IL-17A (150 pg/mL)/CE group indicated proliferation of Kupffer cells, venous congestion, infiltration of inflammatory cells within the portal area, and degeneration of hepatocytes with fatty vacuoles (Labsi et al. Reference Labsi, Soufli, Khelifi, Amir and Touil-Boukoffa2018). In addition, a strong intracytoplasmic PAS staining was observed, showing an accumulation of excessive amounts of glycogen deposits and macrovesicular steatosis structures throughout the liver (Fig. 3C, D, F). All these observations correlated with high histological activity index in these groups in comparison to control groups (Fig. 4).
Representative photomicrographs (×10 and ×40) of periodic acid–Schiff (PAS)-stained liver tissue.
A: liver section graded 1 in Ctrl group; B: liver section graded 1 in PBS group; C: damaged liver with hydatid-cyst localisation graded 3 in CE group; D: damaged liver with hydatid-cyst localisation graded 3 in IL-17A (100 pg/mL)/CE group; E: improved liver section graded 1 in IL-17A (125 pg/mL)/CE group; F: damaged liver with hydatid-cyst localisation graded 3 in IL-17A (150 pg/mL)/CE group. (▼) hepatocyte with positive reaction; (∆) hepatocyte with negative reaction; (H.C.) hydatid cyst; (P.C.) pericyst; (L.L.) laminated layer with mucopolysaccharide substances; (v) hepatic vein; (⇒) degeneration of hepatocytes with fatty vacuoles.

Figure 3. Long description
A multi-panel set of photomicrographs labeled A through F. Each panel contains a wide view and a times 40 magnification inset.
* Panel A and B: Control and P B S groups showing healthy liver tissue with clear hepatic veins labeled v. The times 40 insets show hepatocytes with negative reactions marked by open triangles.
* Panel C: C E group showing a large hydatid cyst (H dot C dot) at the bottom, surrounded by a thick pink laminated layer (L dot L dot) and a pericyst (P dot C dot). The inset shows a hepatocyte with a positive reaction marked by a solid black triangle.
* Panel D: I L-17 A (100 pg per m L) and C E group showing damaged tissue. An open arrow points to hepatocyte degeneration with fatty vacuoles. The inset shows both a solid black triangle (positive reaction) and an open arrow.
* Panel E: I L-17 A (125 pg per m L) and C E group showing improved tissue structure. The wide view shows the H dot C dot, L dot L dot, and P dot C dot layers on the right. The inset shows open triangles (negative reaction) and an open arrow.
* Panel F: I L-17 A (150 pg per m L) and C E group showing severe damage. The wide view features a large H dot C dot area. The inset contains multiple solid black triangles indicating positive reactions and open arrows indicating fatty vacuole degeneration.
Improvement of the histological structure by intravenous administration of 125 pg/mL of IL-17A.
P values from Kruskal–Wallis test are indicated (*P ≤ 0.05, **P ≤ 0.01).

Figure 4. Long description
A dot plot titled Histological activity index H A I. The y-axis represents point scales ranging from 0 to 15 in increments of 5. The x-axis lists six groups from left to right.
* Ctrl group: Mean score is approximately 1.5.
* Ctrl forward slash P B S group: Mean score is approximately 2.
* C E group: Mean score is approximately 4.
* I L-17 A 100 p g per m l forward slash C E group: Mean score is approximately 7. This point has a double asterisk above it and is connected by a bracket to the Ctrl forward slash P B S group which has a single asterisk above the bracket.
* I L-17 A 125 p g per m l forward slash C E group: Mean score is approximately 3.
* I L-17 A 150 p g per m l forward slash C E group: Mean score is approximately 5 with a single asterisk above it.
Vertical error bars extend above and below each data point to indicate variability.
Mice from the Ctrl and PBS groups exhibited normal hepatic tissue (Fig. 3A, B; Fig. 4).
Histopathological analysis of livers from the IL-17A (125 pg/mL)/CE group showed the absence of toxic secondary effects of IL-17A (Fig. 3E), a weaker fibrotic reaction and lower inflammatory-cell infiltration in hepatic parenchyma (Fig. 4). Interestingly, these observations correlated with a significant decrease in hydatid-cyst growth. The polysaccharide structure of the laminated layer of cysts was again revealed using PAS staining (Fig. 3C–F).
Reticulin, like collagen, responds to acidic dyes although more weakly; because it is thinner, reticulin fibres are less visible. Reticulin stains black with silver impregnation and is strongly PAS-positive because of the associated glycoproteins. Fibrosis, which characterises hydatid pathology, was reflected by a significant increase in the level of reticulin. Based on these data, it appears that the CE, IL-17A (100 pg/mL)/CE, and IL-17A (150 pg/mL)/CE groups have a grade 2 disease state (Fig. 5B1,C1,E1). In the same line, we noted that the Ctrl and PBS groups and IL-17A (125 pg/mL)/CE were graded 1 (Fig. 5A1,A2,D1).
Representative photomicrographs (×40) of Gomori’s silver impregnation-stained liver tissue.
A1, A2, D1: liver section graded 1 in Ctrl, PBS and IL-17A (125 pg/mL)/CE groups; B1, C1, E1: network of fine fibres in most of the liver section from CE, IL-17A (100 pg/mL)/CE, and IL-17A (150 pg/mL)/CE groups, graded 2; B2, C2, D2, E2: network of fibres with areas of collagenisation in pericystic layer of hepatic hydatid cyst from CE, IL-17A (100 pg/mL)/CE, IL-17A (100 pg/mL)/CE and IL-17A (150 pg/mL)/CE groups, scored 4. (H.C.) hydatid cyst; (P.C.) pericyst; (L.L.) laminated layer; (v) hepatic vein; (↱) reticulin fibres.

Figure 5. Long description
A multi-panel set of 10 photomicrographs arranged in two columns and five rows. Each panel includes a 400 micrometer scale bar and a speech bubble indicating a fibrosis score.
Left Column (Panels A1, B1, C1, D1, E1):
- A1: Score 1. Shows a central hepatic vein (v) with a thin, dark ring of reticulin fibers.
- B1: Score 2. Shows a more extensive network of fine black fibers branching through the pink-stained hepatocytes.
- C1: Score 2. Similar to B1, with black reticulin fibers forming a loose meshwork.
- D1: Score 1. A large hepatic vein (v) at the top with minimal fiber extension into the surrounding tissue.
- E1: Score 2. Fine black fibers are visible throughout the cellular area.
Right Column (Panels A2, B2, C2, D2, E2):
- A2: Score 1. A hepatic vein (v) on the right edge with sparse fibers.
- B2: Score 4. Shows a dense, thick band of black collagenized fibers in the pericystic layer (P.C.) adjacent to the hydatid cyst (H.C.).
- C2: Score 4. A complex, heavy network of thick black fibers throughout the P.C. region.
- D2: Score 4. A very dense horizontal band of black fibers separates the H.C. at the bottom from the P.C. above.
- E2: Score 4. Thick, parallel black fiber bundles in the P.C. layer bordering the H.C. cavity.
Throughout the panels, right-angled arrows point to specific reticulin fibers, and labels identify the hepatic vein (v), hydatid cyst (H.C.), and pericyst (P.C.).
Reticulin is the stiffest of the fibres. It is interesting to note an abundance of reticulin in the pericyst of the CE, IL-17A (100 pg/mL)/CE, IL-17A (125 pg/mL)/CE, and IL-17A (150 pg/mL)/CE groups, scored 4 (Fig. 5B2,C2,D2,E2).
Toluidine blue staining was performed to evaluate inflammatory cell infiltration in the pericystic layer of hepatic hydatid cysts, allowing the identification of macrophages and plasma cells. Histological examination revealed a pronounced inflammatory response in the CE group, characterised by dense infiltration of inflammatory cells (Fig. 6A). This cellular infiltration was significantly greater than that observed in the IL-17A-treated groups (****P ≤ 0.001; Fig. 6), indicating attenuation of the pericystic inflammatory response following IL-17A treatment. In contrast, mice treated with the less effective IL-17A doses, which were also associated with greater hepatotoxicity, exhibited a stronger inflammatory response (Fig. 6B,D).
Representative photomicrographs (×40, ×100) of toluidine blue-stained liver sections with Lison’s method from the pericystic layer of hepatic hydatid cysts in the CE group (A), in the IL-17A (100 pg/mL)/CE group (B), in the IL-17A (125 pg/mL)/CE group (C), and in the IL-17A (150 pg/mL)/CE group (D).
(H.C.) hydatid cyst; (P.C.) pericyst; (M): macrophages; (Pc): plasma cells; (L.L.) laminated layer; (G.L.): germinal layer; (v): hepatic vein; (Fi.): fibrosis localised in the pericyst; (►): inflammatory cells quantified (P values from Kruskal–Wallis test are indicated (*P ≤ 0.05, ****P ≤ 0.0001)).

Figure 6. Long description
A five-panel figure consisting of four photomicrographs (A-D) and one box plot.
Photomicrographs A through D show toluidine blue-stained liver sections at times 40 and times 100 magnification. Each panel includes a main view and a high-magnification inset.
* Panel A (C E group): Shows the H dot C dot (hydatid cyst) at the bottom right, moving inward to the G dot L dot (germinal layer) and outward to the P dot C dot (pericyst) containing Fi dot (fibrosis). A black arrowhead points to inflammatory cells. The inset shows M (macrophages) and Pc (plasma cells).
* Panel B (I L 17 A 100 pg/mL group): Displays increased Fi dot and v (hepatic veins) within the pericyst. Inset highlights M and Pc near a vein.
* Panel C (I L 17 A 125 pg/mL group): Shows a thick L dot L dot (laminated layer) and G dot L dot. The pericyst area is stained blue, indicating dense fibrosis.
* Panel D (I L 17 A 150 pg/mL group): Features a highly cellular pericyst with dense inflammatory infiltration marked by a black arrowhead. Inset shows Pc and M near fibrosis.
The bottom panel is a horizontal box plot titled Infiltrating inflammatory cells per 10 micrometers squared. The y-axis lists four groups from bottom to top: pericyst C E group, pericyst I L 17 100 pg/mL group, pericyst I L 17 125 pg/mL group, and pericyst I L 17 150 pg/mL group. The x-axis ranges from 0 to 10.
* The C E group has the highest median (approximately 5) and widest range (2 to 8.5).
* All I L 17 A treated groups show a significant decrease in cell counts compared to the C E group, with medians between 2 and 4.
* Statistical significance is indicated by asterisks: four asterisks (P less than or equal to 0.0001) for each I L 17 group compared to control, and a single asterisk (P less than or equal to 0.05) comparing the 100 and 150 pg/mL groups.
The concentration of 125 pg/mL of IL-17A downregulate the hepatic expression of vimentin, iNOS, TNF-α, NF-κB, and CD68
To assess the immunomodulatory effect of IL-17A in our CE model, we analysed hepatic expression levels of vimentin, iNOS, TNF-α, CD68, and NF-κB. Strong intracytoplasmic vimentin expression was observed in the hepatic parenchyma of CE, IL-17A (100 pg/mL)/CE, and IL-17A (150 pg/mL)/CE groups compared to control groups (Fig. 7B6,C6,E6). However, decreased vimentin expression was observed in the pericystic layer in the IL-17A (125 pg/mL)/CE and IL-17A (150 pg/mL)/CE groups (Fig. 7D7,E7). Importantly, treatment of infected mice with 125 pg/mL of IL-17A induced a significant hepatic architecture improvement associated with a loss of expression of vimentin in hepatic parenchyma in these mice (Fig. 7D6).
Representative images (×40) of immunohistochemical analysis for iNOS, TNF-α, NF-κB, CD68 and vimentin expression in liver with hepatic hydatid cysts. (A1, A2) Liver sections of Ctrl group with low expression of iNOS and TNF-α, scored as ‘+’. (A3) Intensity of NF-κB in liver sections of Ctrl group was evaluated as weak. (A4, A5) Liver sections of the Ctrl group showed no positive reaction for CD68 and vimentin. (B1, B2, B6) Liver sections of the CE group showed diffuse expression of iNOS, TNF-α, and vimentin, scored as ‘+++’. (B3) Intensity of NF-κB in liver tissue of the CE group was evaluated as intense. (B4) Liver sections of the CE group showed an intense positive reaction in Kupffer cells for CD68 expression. (B5) In the pericystic layer of hepatic hydatid cysts in the CE group, a positive reaction was found for marker CD68 macrophages. (B7, C7) Abundance of vimentin in pericystic section of CE and IL-17A (100 pg/mL)/CE groups, graded ‘+++’; (C1, C2, C6) Liver sections of the IL-17A (100 pg/mL)/CE group showed moderate expression of iNOS, TNF-α, and vimentin, scored as ‘++’. (C3) Intensity of NF-κB in liver tissue of the IL-17A (100 pg/mL)/CE was evaluated as moderate. (C4) Liver sections of the IL-17A (100 pg/mL)/CE group showed a moderate positive reaction in Kupffer cells for CD68 expression. (C5) In the pericystic layer of hepatic hydatid cysts in the IL-17A (100 pg/mL)/CE group a moderate positive reaction was found for marker CD68 macrophages. (D1, D2) Liver sections of IL-17A (125 pg/mL)/CE group with low expression of iNOS and TNF-α, both graded as ‘+’. (D3) Liver sections of IL-17A (125 pg/mL)/CE group with weak intensity of NF-κB. (D4) Treatment with IL-17A at 125 pg/mL reduced the intensity of CD68 expression. (D5) In the IL-17A (125 pg/mL)/CE group, a decrease of brown staining in fibrotic tissue was observed in comparison with untreated infected mice and treated mice with 100 pg/mL of IL-17A. (D6) IL-17A (125 pg/mL)/CE group with no vimentin expression in liver sections, scored ‘−’. (D7, E7) Little vimentin expression in pericystic section of IL-17A (125 pg/mL)/CE and IL-17A (150 pg/mL)/CE groups, graded ‘+’. (E1, E2) Liver sections of the IL-17A (150 pg/mL)/CE group showed moderate expression of iNOS and TNF-α, scored as ‘++’. (E3) Intensity of NF-κB in liver tissue of the IL-17A (150 pg/mL)/CE group was evaluated as moderate. (E4, E5) Liver and pericystic sections of the IL-17A (150 pg/mL)/CE group showed a moderate positive reaction for CD68 expression. (E6) IL-17A (150 pg/mL)/CE group with vimentin expression in liver sections, graded ‘+’.
(∆) hepatocytes with positive staining; (►) Kupffer cells with positive staining; (↱) vimentin; (V) hepatic vein. (P.C.) pericystic layer of hepatic hydatid cyst; (H.C.) hydatid cyst.

Figure 7. Long description
The grid is organized by rows representing experimental groups: Row A is Control, Row B is C E, Row C is I L 17 A 100 pg/mL plus C E, Row D is I L 17 A 125 pg/mL plus C E, and Row E is I L 17 A 150 pg/mL plus C E.
Columns represent specific markers and tissue types:
- Column 1: i N O S expression.
- Column 2: T N F alpha expression.
- Column 3: N F kappa B expression.
- Column 4: C D 68 expression in liver sections.
- Column 5: C D 68 expression in the pericystic layer.
- Column 6: Vimentin expression in liver sections.
- Column 7: Vimentin expression in the pericystic layer.
Key observations by row:
- Row A (Control): Shows minimal brown staining (low expression) for i N O S, T N F alpha, and N F kappa B. C D 68 and vimentin panels (A4, A5) show no positive reaction.
- Row B (C E): Shows intense brown staining across all markers. Panel B1 shows a hepatic vein (V) with positive hepatocytes (triangle) and Kupffer cells (arrowhead). Panels B5 and B7 show the pericystic layer (P.C.) and hydatid cyst (H.C.) with high vimentin (bent arrow).
- Row C (100 pg/mL I L 17 A): Shows moderate brown staining for all markers, indicating a slight reduction compared to Row B.
- Row D (125 pg/mL I L 17 A): Shows a significant reduction in brown staining across all panels. Panel D6 shows no vimentin expression in liver sections.
- Row E (150 pg/mL I L 17 A): Shows a return to moderate staining levels, higher than Row D but lower than Row B.
Symbols used throughout:
- Open triangles point to hepatocytes with positive staining.
- Solid arrowheads point to Kupffer cells with positive staining.
- Bent arrows point to vimentin expression.
- V indicates the hepatic vein.
- P.C. indicates the pericystic layer.
- H.C. indicates the hydatid cyst.
High expression of iNOS, TNF-α, and NF-κB was observed in hepatocytes and Kupffer cells in liver sections of mice from CE, IL-17A (100 pg/mL)/CE, and IL-17A (150 pg/mL)/CE groups compared to control groups (Fig. 7B1,B2,B3,C1,C2,C3,E1,E2,E3). The increase observed in liver sections correlates with a significant increase in CD68-expressing cells (Kupffer cells) in damaged liver tissues of infected mice compared with the Ctrl and PBS groups and IL-17A (125 pg/mL)/CE group (Fig. 7B4,C4,E4 vs. A4,D4).
Relationship between echinococcosis and splenomegaly observed in the groups showing hepatotoxicity
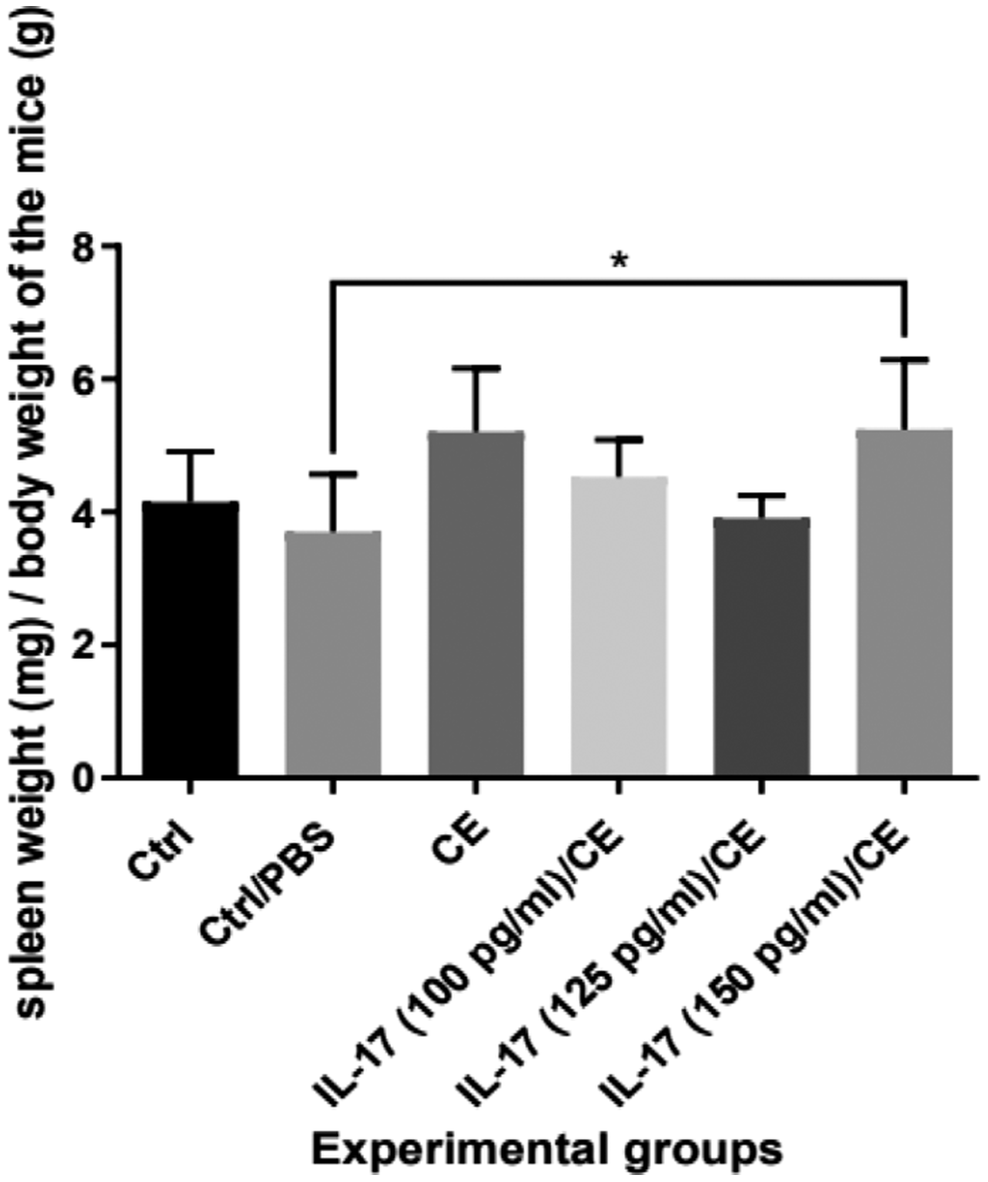
Splenomegaly can occur in cases of chronic liver disease (cirrhosis), leukaemia, and parasitic infections (Li et al. Reference Li, Duan, Chen, Jiang, Li, Yang and Li2017). Cystic development in the liver is therefore responsible for the splenomegaly. Our macroscopic observations, together with the histological study, demonstrate this relationship (Fig. 8; Fig. 9).
Results of the macroscopic observation of the spleen in the Ctrl, PBS, CE, IL-17A (100 pg/mL)/CE, IL-17A (125 pg/mL)/CE, and IL-17A (150 pg/mL)/CE groups.
Results of the ratio (spleen weight/body weight) expressed as mean ± SD. P values from the one-way ANOVA test are indicated (*P ≤ 0.05).

Visualisation of reticulin fibres (×10) in splenic sections from the Ctrl and PBS groups (A), CE group (B), IL-17A (100 pg/mL)/CE (C), IL-17A (125 pg/mL)/CE (D), and IL-17A (150 pg/mL)/CE (E). (↔): lymphoid follicle or white pulp; (⇒): red pulp; (↱): reticulin fibres.

Figure 9. Long description
A collection of six histological micrographs at 10 times magnification, each featuring a 1000 micrometer scale bar.
* Panel A1 (Ctrl group): Shows a follicle diameter of 0.123 plus or minus 0.002 millimeters. Double-headed arrows span the white pulp. A thick yellow arrow points to the red pulp, and a thin black bent arrow indicates reticulin fibers.
* Panel A2 (Ctrl or P B S group): Shows a follicle diameter of 0.120 plus or minus 0.001 millimeters. Similar arrow indicators show the white pulp, red pulp, and reticulin fibers.
* Panel B (C E group): Shows a follicle diameter of 0.207 plus or minus 0.016 millimeters. The white pulp area indicated by the double-headed arrow is visibly larger than in the control groups.
* Panel C (I L 17 A 100 p g per m l or C E group): Shows a follicle diameter of 0.205 plus or minus 0.008 millimeters. Reticulin fibers are marked by the bent arrow in the lower right quadrant.
* Panel D (I L 17 A 125 p g per m l or C E group): Shows a follicle diameter of 0.177 plus or minus 0.005 millimeters. The white pulp is clearly demarcated by a curved boundary and a double-headed arrow.
* Panel E (I L 17 A 150 p g per m l or C E group): Shows a follicle diameter of 0.198 plus or minus 0.005 millimeters. Multiple bent arrows indicate a high density of reticulin fibers throughout the tissue section.
We measured the spleen weights for the Ctrl, PBS, and treated groups (Fig. 8). In the CE group and the groups showing hepatotoxicity (IL-17A (100 pg/mL)/CE and IL-17A (150 pg/mL)/CE), splenomegaly was indicated through clinical assessment. Histological analysis of splenic sections using reticulin staining points to the presence of well-developed lymphoid follicles (Fig. 9). Reticulin is very abundant in the red pulp and allows for the delineation of the lymphoid follicle (Fig. 9). We highlighted these fibres using a specific staining method in order to accurately determine the size of the follicles. The concentration of 125 pg/mL of IL-17A led to a decrease in spleen weight (Fig. 8), and a significant reduction in the diameter of the white pulp compared to the groups showing hepatotoxicity (Fig. 9D vs. B, C, E).
Discussion
Intravenous administration of IL-17A at a concentration of 125 pg/mL in Echinococcus granulosus-infected Swiss mice demonstrated a marked reduction in the development of hydatid cysts. Specifically, IL-17A treatment induced a dose-dependent reduction in hydatid cyst weight and diameter in mice experimentally infected with protoscoleces. This reduction was also associated with decreased fibrosis and improved hepatic tissue architecture.
These findings are consistent with previous studies showing that cytokine-mediated immune modulation can effectively limit parasite development in experimental echinococcosis. Administration of exogenous IFN-γ in murine models of Echinococcus multilocularis infection can inhibit metacestode proliferation and mitigate liver fibrosis (Liance et al. Reference Liance, Ricard-Blum, Emery, Houin and Vuitton1998). Similarly, recombinant IL-12 administration promoted a protective Th1 immune response, resulting in reduced parasite burden and improved outcome in secondary alveolar echinococcosis (Emery et al. Reference Emery, Leclerc, Sengphommachanh, Vuitton and Liance1998). More recently, cytokine therapy using IL-12 and IFN-γ significantly decreased the number, size, and weight of hydatid cysts in infected mice, further supporting the protective role of Th1 cytokine responses (Rahdar et al. Reference Rahdar, Rafiei and Valipour-Nouroozi2018). Moreover, combining IL-12 and IFN-γ with albendazole enhanced therapeutic efficacy against hydatid cyst development (Rahdar et al. Reference Rahdar, Rafiei and Valipour-Nouroozi2020).
Resident macrophages are known to play a critical role in initiating inflammatory responses following tissue injury, whereas infiltrating monocyte-derived macrophages contribute to the persistence of chronic liver inflammation and the development of fibrosis (Heymann et al. Reference Heymann, Trautwein and Tacke2009; Tacke and Zimmermann Reference Tacke and Zimmermann2014). In parallel, macrophage biology has gained increased attention in the context of chronic liver disease. Kupffer cells are known to initiate early inflammatory responses following tissue injury, whereas infiltrating monocyte-derived macrophages have been implicated in sustaining inflammation and promoting fibrosis. Wang et al. (Reference Wang, Yu, Wang, Hou, Wang, Kang, Hou, Li, Rousu, Jiang, Li, Wen and Zhang2023) discussed the heterogeneity and functional specialisation of hepatic macrophages, emphasising their roles in the progression of liver fibrosis and potential as therapeutic targets. These insights collectively suggest that modulating macrophage function and broader immune responses may hold therapeutic potential for managing hydatid cyst and related hepatic pathologies.
An in vitro analysis of NO production from cultured liver biopsy samples revealed increased NO levels, which were associated with elevated iNOS expression and significant architectural damage in the liver parenchyma. Notably, a hepatotoxic effect was observed in infected mice, as well as in those treated with IL-17A at doses of 100 and 150 pg/mL. Conversely, treatment with IL-17A at 125 pg/mL led to a marked reduction in NO production by liver explants compared to all other groups. The decrease in NO levels was strongly related to improved liver histology, reduced fibrotic responses, and downregulation of key inflammatory and fibrotic markers, including iNOS, CD68, TNF-α, NF-κB, and vimentin.
Histological examination of the liver revealed extensive fibrosis in infected mice. In contrast, the percentage of fibrotic area was significantly lower in mice treated with 125 pg/mL IL-17A compared with the CE, IL-17A (100 pg/mL)/CE, and IL-17A (150 pg/mL)/CE groups (Labsi et al. Reference Labsi, Soufli, Khelifi, Amir and Touil-Boukoffa2018). Concomitantly, treatment with IL-17A at this dose led to a significant reduction in the HAI score, glycogen storage, and infiltration of inflammatory cells. These effects were associated with the downregulation of iNOS, CD68, TNF-α, NF-κB, and vimentin expression in this group of mice.
Experimental studies in murine models have demonstrated that hepatic macrophage activity largely depends on the recruitment of circulating monocytes, which differentiate into tissue macrophages (Zimmermann et al. Reference Zimmermann, Trautwein and Tacke2012). Macrophages, including resident Kupffer cells and infiltrating monocyte-derived populations, play a central role in both initiating and maintaining liver inflammation and fibrosis (Heymann et al. Reference Heymann, Trautwein and Tacke2009; Tacke and Zimmermann Reference Tacke and Zimmermann2014; Wang et al. Reference Wang, Yu, Wang, Hou, Wang, Kang, Hou, Li, Rousu, Jiang, Li, Wen and Zhang2023). During echinococcosis, macrophages also represent a major source of nitric oxide, a molecule with well-established cytotoxic effects against Echinococcus granulosus (Amri and Touil-Boukoffa Reference Amri and Touil-Boukoffa2015; Touil-Boukoffa et al. Reference Touil-Boukoffa, Bauvois, Sanceau, Hamrioui and Weitzerbin1998).
Under pathological conditions, excessive NO production, primarily mediated by iNOS, exacerbates hepatic inflammation and oxidative stress, leading to hepatocellular injury and activation of hepatic stellate cells, which collectively drive the progression of liver fibrogenesis (Iwakiri and Kim Reference Iwakiri and Kim2015; Yang et al. Reference Yang, Yang, Zhang, Wan, Chen, Xiao, Liang, Yang, Zhong, Huang, Chen and Zhao2025). Our results support previous observations by Wang et al. (Reference Wang, Yu, Wang, Hou, Wang, Kang, Hou, Li, Rousu, Jiang, Li, Wen and Zhang2023), who identified hepatic macrophages as key regulators of the immune response during E. granulosus infection. The predominance of iNOS-expressing macrophages during the early phase of infection is associated with activation of pro-inflammatory pathways, including NF-κB-dependent cytokine production and TNF-α secretion, thereby contributing to the development of hepatic inflammatory lesions.
Studies investigating the pathogenesis of liver fibrosis have focused on histopathological alterations, toxicological mechanisms, cytokine production, and molecular pathways. Hepatic stellate cells are the principal fibrogenic cells and key mediators of liver fibrosis progression (Niu et al. Reference Niu, Chong, Qin, Li, Wei and Zhao2019; Schwabe and Brenner Reference Schwabe and Brenner2025). Reactive oxygen species (ROS), primarily generated by injured hepatocytes, HSCs, and infiltrating inflammatory cells, play a central role in promoting liver inflammation and fibrogenesis (Meurer et al. Reference Meurer, Lahme, Tihaa, Weiskirchen and Gressner2005). ROS contribute to the recruitment of immune cells and the activation of HSCs, which transition from a quiescent to an activated myofibroblastic phenotype characterised by proliferation, contractility, and enhanced fibrogenic potential (Novo et al. Reference Novo, Cannito, Morello, Paternostro, Bocca, Miglietta and Parola2015; Wang et al. Reference Wang, Wu, Lin, Chen, Yeh and Pan2019). The cytoskeletal system, particularly intermediate filaments such as vimentin, is closely associated with changes in cell morphology, motility, and epithelial–mesenchymal transition (EMT) (Hohmann and Dehghani Reference Hohmann and Dehghani2019; Wang et al. Reference Wang, Wu, Lin, Chen, Yeh and Pan2019).
Vimentin, a key EMT marker, is not only associated with HSC activation but also positively correlates with the expression of CD68, NF-κB, and TNF-α in the hepatic parenchyma and the pericystic layer of hydatid cysts (Labsi et al. Reference Labsi, Soufli, Amir and Touil-Boukoffa2022). Its expression is upregulated by inflammatory stimuli, such as TNF-α, and vimentin is secreted by activated macrophages (Mor-Vaknin et al. Reference Mor-Vaknin, Punturieri, Sitwala and Markovitz2003). Vimentin-positive cells vary in morphology and are typically dispersed throughout the perisinusoidal space and portal triads, with prominent localisation in fibrotic pericystic regions of the liver in heavily infected mice (Knezevic et al. Reference Knezevic, Gledic, Kukoli, Knezevic, Jovanovic, Bozic and Aleksic-Kovacevic2009).
Severe hepatotoxicity can lead to fibrosis or cirrhosis, resulting in increased intrahepatic vascular resistance and the development of portal hypertension, which elevates splenic venous pressure and promotes splenic congestion and splenomegaly (Li et al. Reference Li, Duan, Chen, Jiang, Li, Yang and Li2017; Yoshida et al. Reference Yoshida, Shimizu, Yoshioka, Matsushita, Kawano, Ueda, Kawashima, Taniai and Mamada2023). Administration of IL-17A at a concentration of 125 pg/mL resulted in a reduction in spleen weight, accompanied by a significant decrease in white pulp diameter compared with groups exhibiting hepatotoxicity. These findings suggest a modulatory effect of IL-17A on splenic lymphoid architecture. Furthermore, these results may indicate a potential protective effect of this IL-17A dose against echinococcosis.
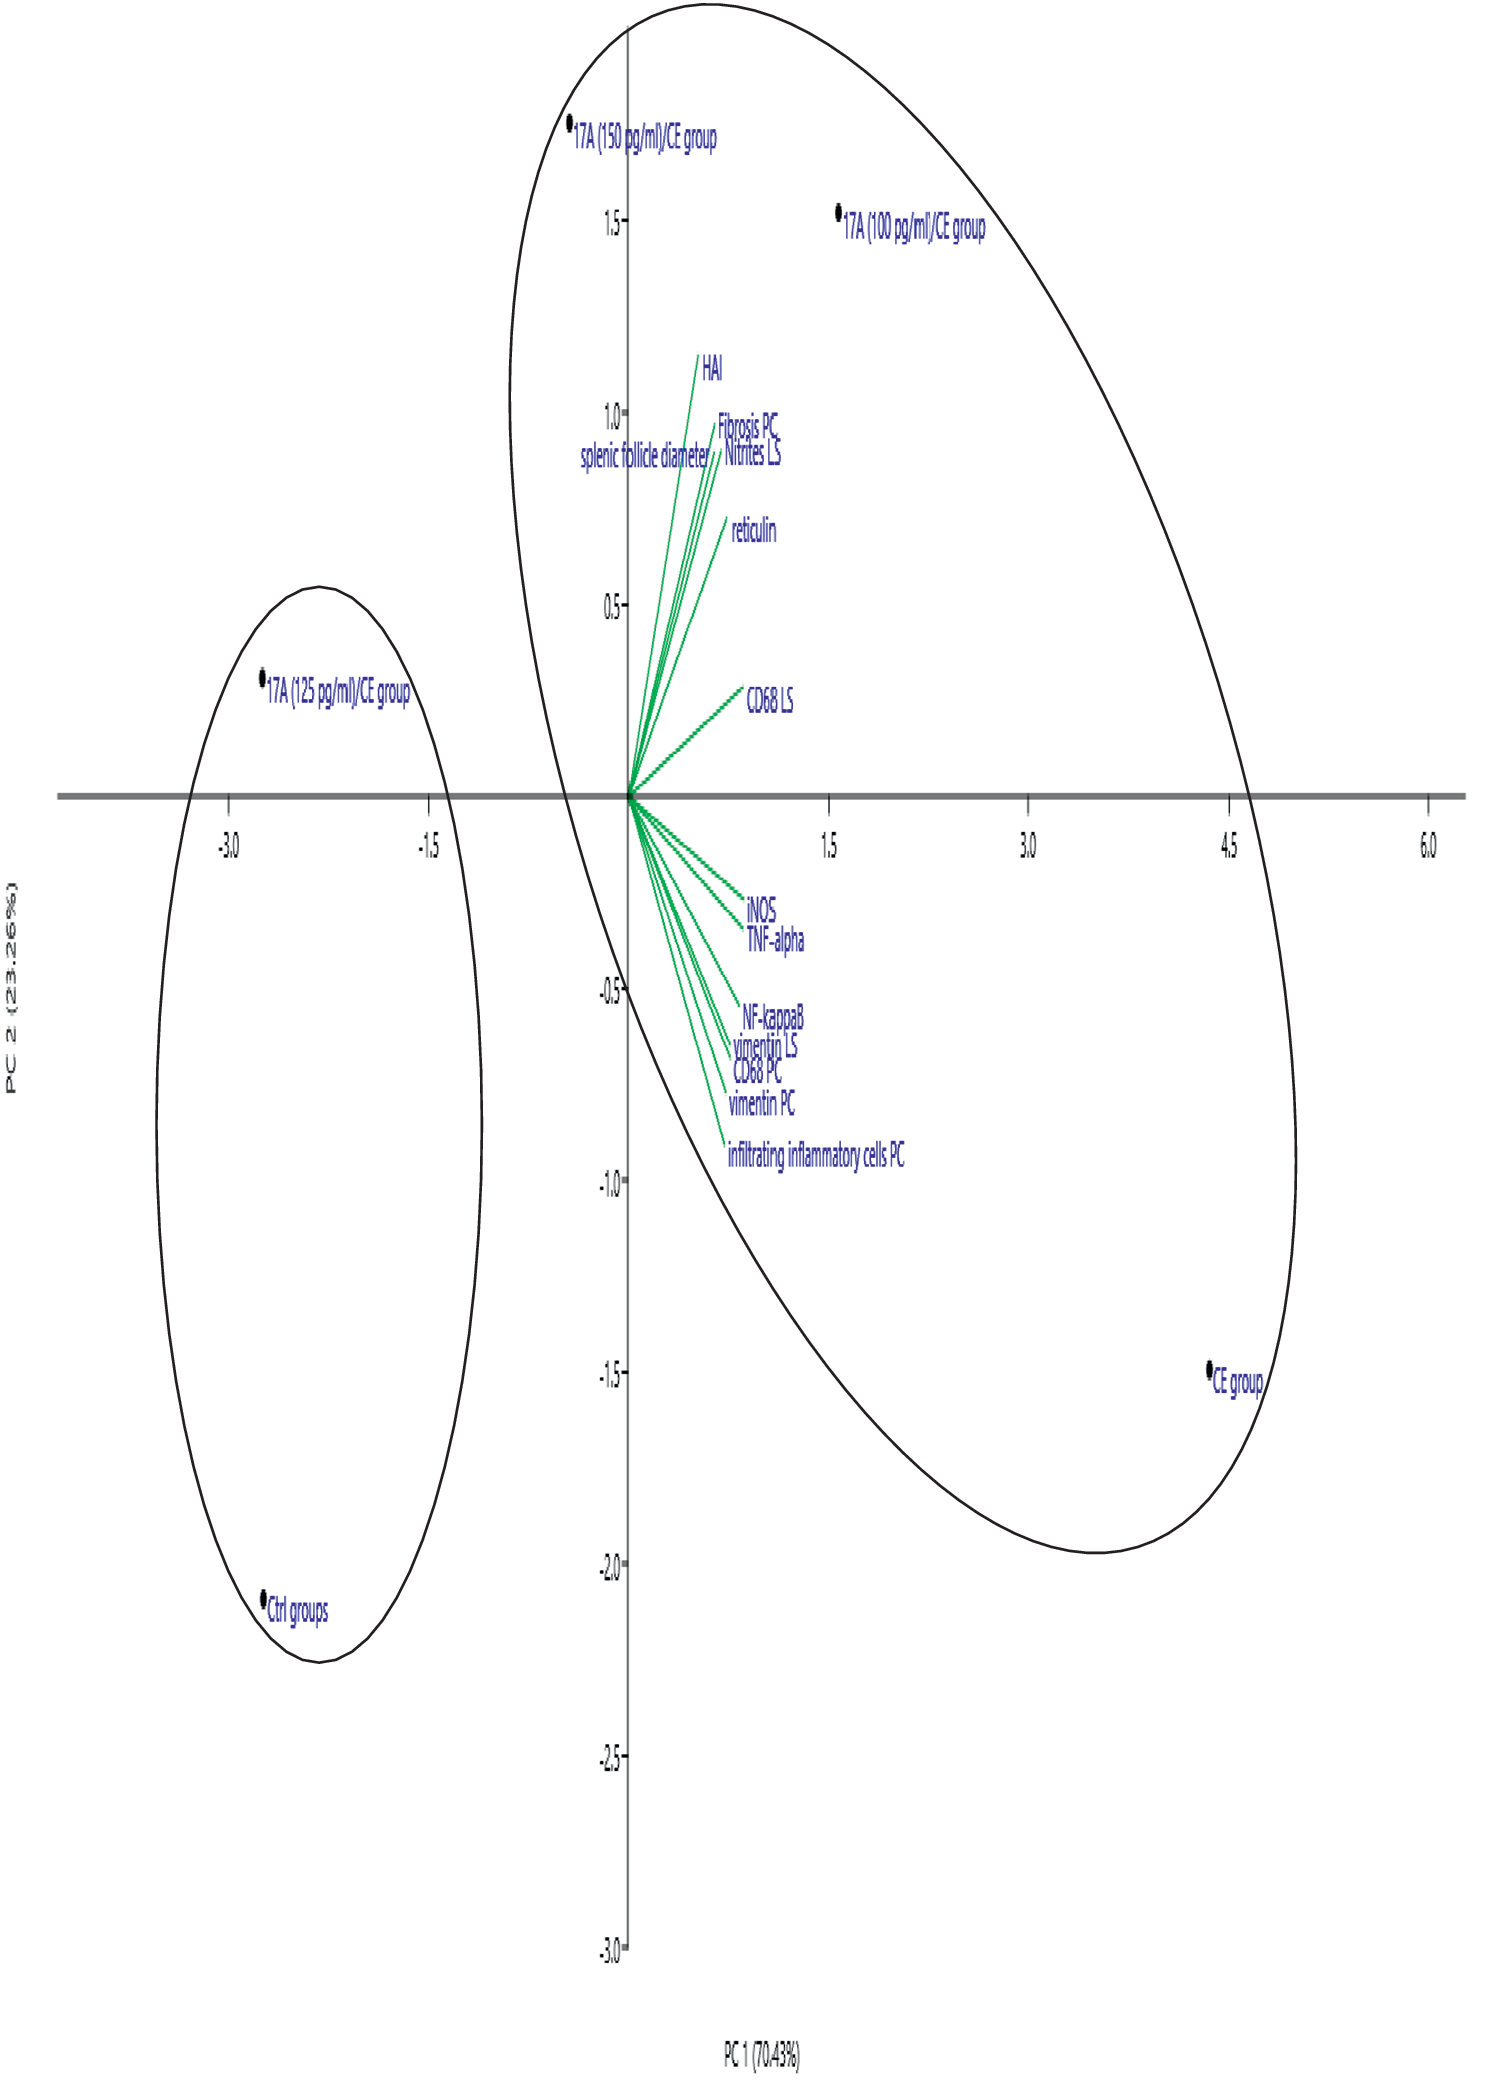
To better understand the relationships among inflammatory and fibrotic markers, a principal component analysis was conducted. This statistical approach reduces multidimensional data into a smaller number of principal components, which capture the most significant variance within the dataset. In this study, two principal components were extracted, accounting for 70.43% and 23.26% of the total variance, respectively, and are illustrated in Fig. 10. The variables analysed in the PCA included iNOS, NF-κB, TNF-α, CD68, vimentin, reticulin fibres, HAI, splenic follicle diameter, infiltrating inflammatory cells in the pericyst (PC) and NO levels in the supernatants of cultured liver biopsies. The distribution of experimental groups along these components revealed distinct clustering patterns. The CE group, along with the IL-17A (100 pg/mL)/CE and IL-17A (150 pg/mL)/CE groups, was located on the positive side of the principal component axis. These groups exhibited elevated expression levels of both inflammatory and fibrotic markers, indicating an enhanced hepatic inflammatory response and fibrogenesis, as well as associated splenomegaly. In contrast, the Ctrl and PBS groups and the IL-17A (125 pg/mL)/CE group were positioned on the negative side of the principal component axis, reflecting minimal or no expression of these markers.
Principal component analysis loading plot of inflammatory and fibrotic markers from the Ctrl, CE, IL-17A (100 pg/mL)/CE, IL-17A (125 pg/mL)/CE, and IL-17A (150 pg/mL)/CE groups. (PC) pericyst. (LS) liver section.

Figure 10. Long description
A P C A loading plot with P C 1 on the horizontal axis (70.43 percent) and P C 2 on the vertical axis (23.26 percent). The plot features two distinct elliptical clusters.
* The left cluster contains the Ctrl groups at the bottom and the I L-17 A 125 p g / m L / C E group at the top.
* The larger right cluster contains the I L-17 A 150 p g / m L / C E group at the top left, the I L-17 A 100 p g / m L / C E group at the top center, and the C E group at the bottom right.
Green loading vectors originate from the center (0,0) and extend into the right quadrants.
* Vectors pointing into the upper right quadrant include H A I, Fibrosis P C, Nitrites L S, splenic follicle diameter, reticulin, and C D 68 L S.
* Vectors pointing into the lower right quadrant include i N O S, T N F-alpha, N F-kappa B, vimentin L S, C D 68 P C, vimentin P C, and infiltrating inflammatory cells P C.
The PCA results suggest a strong correlation among the studied variables, implying a coordinated involvement of these markers in hepatic inflammation and fibrosis. These observations are in agreement with previous studies reporting the involvement of immune-mediated pathways in regulating hepatic inflammation, oxidative stress, and fibrosis progression in experimental echinococcosis (Tian et al. Reference Tian, Jiang, Qi, Zhao, Li, Aibibula, Min, Zhang, Liu and Ma2021; Yasen et al. Reference Yasen, Li, Ran, Aini, Wang, Jiang, Shao, Aji and Wen2021).
Conclusion
Our findings support the hypothesis that IL-17A exerts both antihydatid and immunomodulatory effects in the context of experimental CE. Among the tested concentrations, IL-17A at 125 pg/mL showed the most pronounced effect, characterised by a reduction in cyst development, while maintaining hepatic integrity without inducing detectable toxic effects. This therapeutic activity was associated with the modulation of the host inflammatory response and attenuation of tissue remodelling processes induced by Echinococcus granulosus infection.
In untreated infected mice, hepatic lesions were associated with marked activation of inflammatory pathways, as evidenced by increased expression of iNOS, CD68, TNF-α, and NF-κB, together with enhanced expression of fibrosis-related markers, including vimentin and reticulin. These molecular alterations reflected an exacerbated inflammatory and fibrotic response contributing to hepatic damage during CE progression. IL-17A treatment at 125 pg/mL reduced these pathological changes, suggesting its ability to restore immune balance by limiting excessive inflammation and fibrosis while promoting an effective antihelminthic response.
These alterations were accompanied by splenomegaly, suggesting a systemic response associated with the progression of infection. The capacity of IL-17A to modulate both local hepatic inflammation and systemic immune responses supports its potential as a therapeutic immunomodulator in CE. Collectively, these findings identify IL-17A and its associated inflammatory pathways as promising targets for controlling parasite-induced liver injury and provide new insights into cytokine-based strategies for the management of cystic echinococcosis.
Acknowledgements
The authors would like to thank Mohamed-Amine Lazourgui for his important contribution to the histological study and for his technical help.
Competing interests
The authors report no competing interests.
Ethical standards
Ethics approval and permits. The local ethics committee of the “National Thematic Agency Research in Health ANDRS” has approved our study.