I. INTRODUCTION
In the past several decades, the mechanical properties of thin films have been an important aspect in applications, such as electronics, protective coatings, and microelectrical mechanical systems. Nanoindentation has become a popular tool to evaluate these properties of thin film materials because it is minimally destructive and there is no need to image the indent.Reference Oliver and Pharr1–Reference Pharr9 Various models have been developed to account for substrate effects, including Doerner and NixReference Doerner and Nix4 with modifications,Reference King5,Reference Saha and Nix6 Gao et al.,Reference Gao, Chiu and Lee7 and more recently from Zhou and Prorok.Reference Zhou and Prorok10,Reference Zhou and Prorok11 In addition, there have been barriers to collecting accurate values due to pile-up and sink-in during nanoindentation.Reference Nix12
Generally in film/substrate systems, pile-up occurs when there is a compliant film on a stiff substrate, and sink-in when there is a stiff film on a compliant substrate,Reference Chen and Vlassak13 leading to a difference in the indent impression, see Fig. 1. A normal indent from a Berkovich indenter tip is presented in Fig. 1(a), followed by (b) pile-up, and (c) sink-in. These are represented by platinum films on (a) platinum, (b) silicon oxide, and (c) tin. Previous researchers have shown that pile-up and sink-in can affect the contact area of the indenter, which in turn can alter the extracted mechanical properties.Reference McElhaney, Vlassak and Nix14,Reference Bolshakov and Pharr15 An indent experiencing pile-up underestimates contact area because area due to the additional pile-up is not included. Inversely, sink-in produces an overestimation of contact area.Reference Saha and Nix6,Reference McElhaney, Vlassak and Nix14–Reference Taljat and Pharr16
(a) Normal indent impression with Berkovich tip, (b) indent with pile-up, and (c) indent with sink-in.

These phenomena can play a role in the calculations of extracting film properties when using the Oliver–Pharr method.Reference Oliver and Pharr1 Here, a reduced modulus is found that eliminates deformation of the indenter tip itself via:  ${1 /\mathord{\left{\vphantom {1 {{E_{\rm{r}}}}}} \right\kern-\nulldelimiterspace} {{E_{\rm{r}}}}} = {{\left( {1 - {\nu ^2}} \right)} /\mathord{\left{\vphantom {{\left( {1 - {\nu ^2}} \right)} E}} \right\kern-\nulldelimiterspace} E} + {{\left( {1 - \nu _{\rm{i}}^2} \right)}/ \mathord{\left{\vphantom {{\left( {1 - \nu _{\rm{i}}^2} \right)} {{E_{\rm{i}}}}}} \right\kern-\nulldelimiterspace} {{E_{\rm{i}}}}}$ where E and ν are elastic modulus and Poisson's ratio relating to the material, and E i and νi pertain to the indenter properties.Reference Oliver and Pharr1 This reduced modulus is then related to the unloading stiffness via Eq. (1).
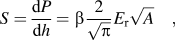 $$S = {{{\rm{d}}P} \over {{\rm{d}}h}} = \beta{2 \over {\sqrt \pi }}{E_{\rm{r}}}\sqrt A \quad ,$$
where S is the stiffness, defined by dP/dh, P being the load, h the displacement, and β a geometrical term, close to 1 for a Berkovich tip.Reference Oliver and Pharr1 Here, A is the projected contact area from Berkovich tip geometry based upon indent depth. Typically, this variable is not adjusted when contact area changes under pile-up or sink-in conditions.
The Zhou–Prorok model was chosen as an analysis technique because it appears to be adept at describing the elastic behavior of many different film and substrate combinations.Reference Zhou and Prorok10,Reference Zhou and Prorok11 Eq. (2) is the Zhou–Prorok model which has a basic form of the inverse rule of mixtures with weighting factors that describe the interplay between film and substrate:
 $${1 \over {E\prime }} = {1 \over {E_{\rm{f}}^\prime }}\left( {1 - {\Phi _{\rm{s}}}} \right) \cdot {\left( {{{E_{\rm{f}}^\prime } \over {E_{\rm{s}}^\prime }}} \right)^{0.1}} + {1 \over {E_{\rm{s}}^\prime }}{\Phi _{\rm{f}}}\quad .$$
Here, E′ is the composite or reduced modulus from the indenter,  $E_{\rm{f}}^\prime$ is the film modulus,
 $E_{\rm{s}}^\prime$ is the substrate modulus, the weighting factors
 ${\Phi _{\rm{f}}} = {e^{ - {\nu _{\rm{f}}}\left( {{t \mathord{\left{\vphantom {t h}} \right\kern-\nulldelimiterspace}/ h}} \right)}}$ and
 ${\Phi _{\rm{s}}} = {e^{ - {\nu _{\rm{s}}}\left( {{t \mathord{\left{\vphantom {t h}} \right\kern-\nulldelimiterspace} /h}} \right)}}$ where υf and υs are film and substrate Poisson's ratios, respectively, t is the thickness of the film, and h is the displacement into the film. A comparison of this model with other models is seen in prior work.Reference Zhou and Prorok10,Reference Zhou and Prorok11 In this work, the described model was leveraged to assess how additional contact area due to pile-up affects elastic properties.
II. EXPERIMENTAL PROCEDURE
A. Materials selection
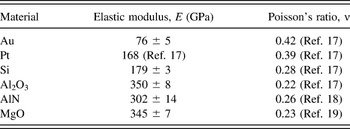
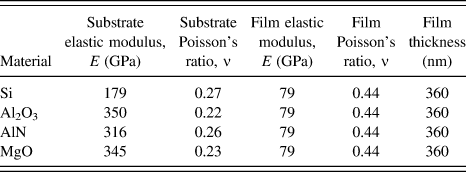
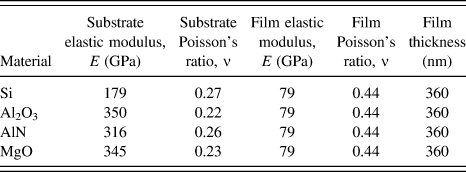
In this work, the authors chose to study how pile-up affects the extraction of elastic properties of the film/substrate composite by selecting a series of materials that consisted of compliant films on stiff substrates. Gold was an ideal choice for the film material due to its low modulus, capacity for plastic deformation, ease of deposition, and inertness. Substrate materials included single crystal forms of silicon (Si), aluminum oxide (Al2O3), aluminum nitride (AlN), and magnesium oxide (MgO). Negligibly plastically deforming substrates, termed nonplastically deforming in this work, were chosen to avoid accounting for plastic deformation in the substrate during the analysis.Reference Taljat and Pharr16 The elastic modulus from indenting bulk samples as well as literature values of Poisson's ratios of these materials are given in Table I.
Material properties from experimental and literature values.

B. Film deposition
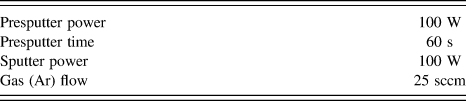
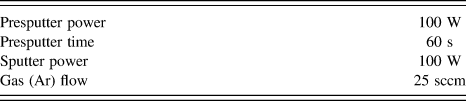
Gold films were simultaneously deposited on all four substrates using a Denton Discovery 18 sputtering system under DC power and substrate rotation. Conditions were chosen from previous work on sputtering gold films.Reference Zhou and Prorok10,Reference Zhou and Prorok11,Reference Liang and Prorok20–Reference Wang and Prorok22 The resulting microstructure is typically columnar with a (111) texture.Reference Wang and Prorok23 A titanium layer 10 nm thick was sputtered beforehand to promote adhesion. Table II lists the physical parameters used with film thickness being controlled by sputter time. Three film thicknesses were used (360, 625, and 950 nm) to ascertain the role that film thickness may play during film pile-up. Film thickness was measured in multiple locations with a Bruker/Veeco Dektak 150 Profilometer (Billerica, MA).
Sputter coating conditions.
C. Testing and evaluating
Nanoindentation was performed using an MTS Nanoindenter XP with a Berkovich diamond tip under continuous stiffness operation with a harmonic displacement target set at 2 nm and a minimum thermal drift rate of 0.05 nm/s. The samples were indented to various depths and the values of elastic modulus were continually recorded throughout displacement. Arrays of at least twenty five indents with 50 micrometer spacing were performed for each experimental condition to obtain a statistical response. Residual indents were imaged with a JEOL JSM 7000F scanning electron microscope (SEM; Tokyo, Japan). ImageJ softwareReference Schneider, Rasband and Eliceiri24 was used to accurately measure the projected indenter area and projected pile-up area. These measurements were recorded and compared among all film/substrate combinations at varying depths.
III. RESULTS AND DISCUSSION
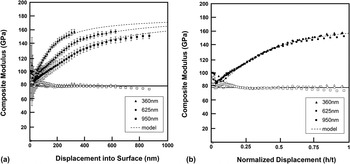
Plots of the measured composite modulus versus displacement into the surface obtained from indenting three gold films 360, 625, and 950 nm thick on a silicon substrate are shown in Fig. 2(a). This plot shows the average values of measured modulus for 25 indents in each film thickness denoted by: 360 nm (▲), 625 nm (●), and 950 nm (■). The error bars illustrate the standard deviation at each indentation depth. It should be noted that this analysis was confined to metallic films under 1 micrometer thick. As film thickness increases beyond this, grain size and microstructure evolve, altering the yield stress of the material and consequently the degree of pile-up. Each set of data was truncated at the point where the indent depth equaled the film thickness, or when the indenter penetrated to the substrate. The thinner films exhibited a stiffer composite response, as at any given displacement, more of the stiffer substrate would have been engaged. The Zhou–Prorok model described in Eq. (2) was applied to this plot using the material property values listed Table I, represented by the dashed lines. The agreement between the model and experiments indicated that one could extract film elastic modulus from the experimental data using bulk literature values of the other parameters. These extracted film modulus values are designated by open symbols for 360 nm (△), 625 nm (○), and 950 nm (□). Results from each film thickness fall on a single consistent line of approximately 79 GPa, which agree well with experimental literature values using alternate techniques (solid line).Reference Liang and Prorok20–Reference Wang and Prorok22,Reference Espinosa and Prorok25–Reference Prorok and Espinosa28
(a) Experimental values of modulus versus displacement for the three gold films deposited on a silicon substrate (closed markers), the Zhou–Prorok model prediction (dashed lines), and extracted film modulus (open markers). (b) Experimental data collapsed onto a single line using the normalized displacement, i.e., removing thickness dependence.

To better illustrate how the Zhou–Prorok model describes these three composites, the composite modulus was plotted as a function of normalized displacement, (h/t), in Fig. 2(b). In other words, the effect of film thickness was removed. In this representation, all the experimental results and model predictions from the three film thicknesses converged onto a single curve. The extracted film modulus remained consistently around 79 GPa, regardless of film thickness or penetration depth.
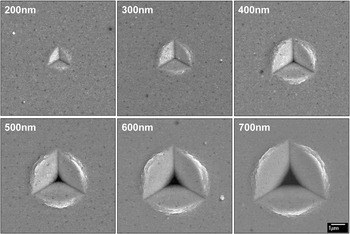
One can question, then, how this model performs so well when considering that varying degrees of pile-up must exist for different film thicknesses and penetration depths. Figure 3 is a compilation of scanning electron micrographs illustrating the residual indent and its associated pile-up as the indenter penetrates the film. These images are from the 360 nm thick gold film on a silicon substrate at penetration depths of 200 through 700 nm. As the indenter penetrated the film, the degree of pile-up significantly increased. At 400 nm depth and deeper, the silicon substrate can be seen as the dark region in the center of the indent where the indenter has punched through the film. It is curious to note that the Zhou–Prorok model applied here appeared to accurately predict the elastic behavior of the composite even though the film experienced an increasing degree of material pile-up with indent penetration. Furthermore, when the film modulus was extracted, it did not appear to be influenced by this increased degree of pile-up. It has been generally accepted in the indentation community that when this pile-up is not accounted for, the indenter should overestimate the composite modulus.Reference Saha and Nix6,Reference McElhaney, Vlassak and Nix14–Reference Taljat and Pharr16 This arises as the Oliver–Pharr method models indenter contact as a function of Berkovich contact area via A = 24.5h c2.Reference Oliver and Pharr1,Reference Oliver and Pharr2 The method was used to obtain the composite modulus values shown in Fig. 2. These were all calculated from the unloading stiffness using Eq. (1) with no correction or consideration of additional pile-up area. It appears that the applied Zhou–Prorok model either accounted for the influence of the additional pile-up area or the additional area played no role in the elastic property extraction. In examining the construct of the model [Eq. (2)] there appears to be no variables that are physically connected to any aspect of projected contact area, be it from the indenter tip or pile-up. The only time a projected area played a role in determining the data in Fig. 2 was through the Oliver–Pharr use of Eq. (1). Thus, it appears more likely that the extra contact from pile-up may not have contributed to the measured elastic response during indent unloading.
Indent impression progression of 360 nm gold film on silicon from 200 to 700 nm.

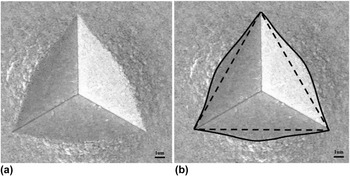
To assess whether or not pile-up played a role in elastic modulus calculations, a method to directly measure and quantify the degree of additional projected contact area from pile-up was developed. Here, the authors sought a method that enabled the additional contact area to be calculated from two-dimensional electron micrographs, mainly to reduce tedious atomic force microscopy (AFM) measurements. Of the many techniques described in the literature,Reference Kese and Li29–Reference Bolshakov, Oliver and Pharr32 the method developed by Kese et al. best fit this role. A semi-ellipse shape was used to measure and predict pile-up area by roughly fitting geometric shapes to the piled-up area. The authors adapted insight in this work into a simpler method using only the two-dimensional electron micrograph and ImageJ software. Here, the micrograph is imported into ImageJ and then the features of the indent are traced, seen in Fig. 4. First, the projected area from only the indenter is traced by the three corners of the Berkovich tip, denoted by the dashed line in Fig. 4(b). Next, the outer boundary of the total indent contact area is traced, denoted by the solid line in Fig. 4(b). It was realized that there may be some subjectivity in this method, but the authors verified that results did not vary when performed by several separate individuals. Future work will focus on standardizing this method further. The ImageJ software then determined the area of each defined shape by counting pixels. The difference between the two measurements was the projected contact area of only the piled-up region.
(a) Indent impression with pile-up, (b) dotted lines depicting Berkovich projected area, solid lines for total area. Subtracting projected area total area results in pile-up area.

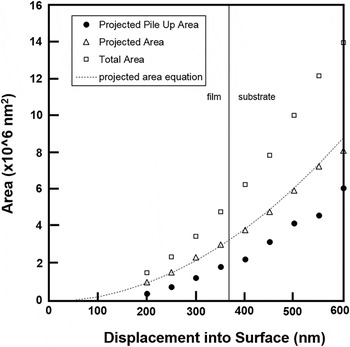
An example of this analysis for the 360 nm gold film on silicon is shown in Fig. 5. Here, a series of 9 indents were created to depths ranging from 200 to 600 nm. The measured projected contact area from the Berkovich tip only is denoted by the open triangles (△) and is verified as an accurate measurement by comparing it with the Berkovich tip's calculated contact area using: A = 24.5h c2 (dashed line). The open squares (□) indicate the measured total projected contact area, and their difference is the projected pile-up area, closed circles (●). All three trends increase as expected with indent depth. The vertical solid line shows the point at which the indenter penetrated through the 360 nm thick film. Interestingly, even past the film thickness, the pile-up trends still hold. It should be noted that at indent depths below 200 nm, there was not sufficient pile-up to use this technique.
Projected pile-up area (●), projected area (△), and total area (□) for 360 nm gold film on silicon, where the projected area follows the equation for the Berkovich tip.

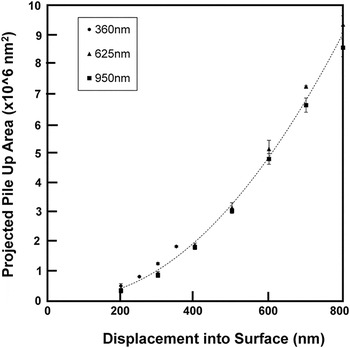
The projected contact area was also measured for the other two gold films on silicon, 625 and 950 nm, and compared with the 360 nm gold film in Fig. 6. Here, only the projected pile-up area is plotted versus indenter displacement into the surface, and error bars are shown as the average of four measured indent pile-up areas at each depth. The data from all three film thicknesses align and exhibit the same behavior. In other words, as the indenter penetrated into each film, the degree of pile-up developed was independent of film thickness. Considering that these three film/substrate combinations represented three different composite forms, an indent of a specific depth in all three would engage the substrate in different amounts. The results in Fig. 6 then suggest that the degree of pile-up was not influenced by the film thickness. It appeared to be solely dependent on the indent depth.
Pile-up area for three thicknesses of gold on silicon, all following the same trend with increasing displacement into surface.

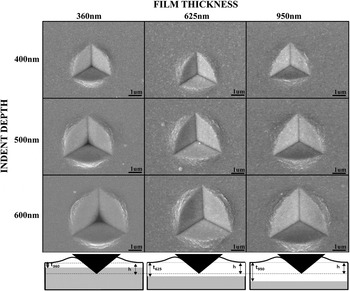
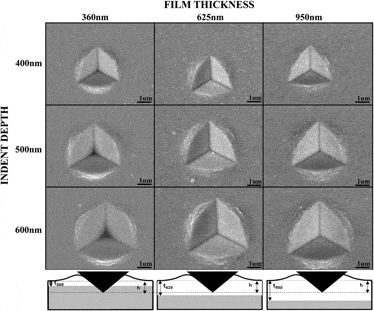
Further verification of this finding is seen when comparing residual indents at the same depth for different film thicknesses, seen in Fig. 7. Here, each row represents a single indent depth, whereas each column represents a particular film thickness. All micrographs were taken at the same magnification. In accordance with the ImageJ results, the pile-up appears to be visually equivalent between the three films when indented to the same depth. Below each column in Fig. 7, there is a schematic illustrating the cross-section of each indent for the 600 nm indent depth. Here, each film (white) on silicon substrate (gray) is depicted with an indent approximately 600 nm deep (h), into each film. For the 360 nm film, the indent has significantly penetrated to the substrate while the indenter remains in the film for the two thicker samples. Using a conventional concept of indenting a film/substrate composite and considering the wide difference in composite moduli measured in Fig. 2(a), one would expect these three indents to appear significantly different. However, the degree of pile-up does not appear to be influenced by the film thickness or the presence of the substrate at all. It begs to question then if the degree of pile-up, being insensitive to film thickness, is also insensitive to substrate elastic modulus.
Micrographs and schematics showing the same pile-up across gold on silicon at the same indent depths for different film thicknesses. Schematics below each column show the cross-section of an indent at 600 nm indent depth.

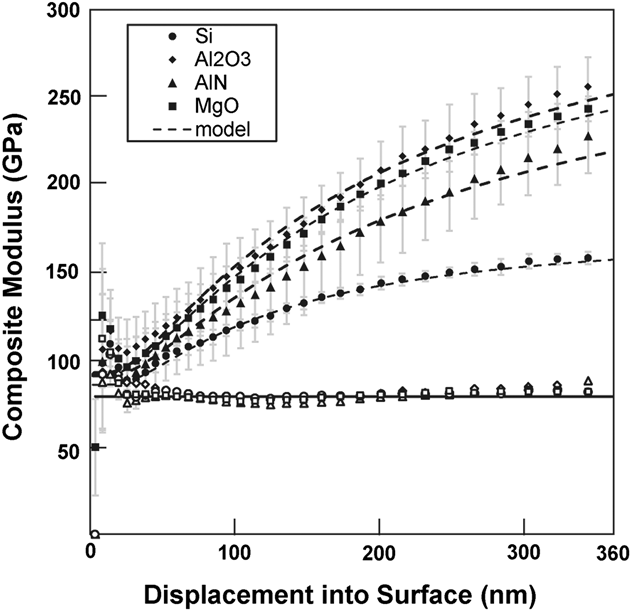
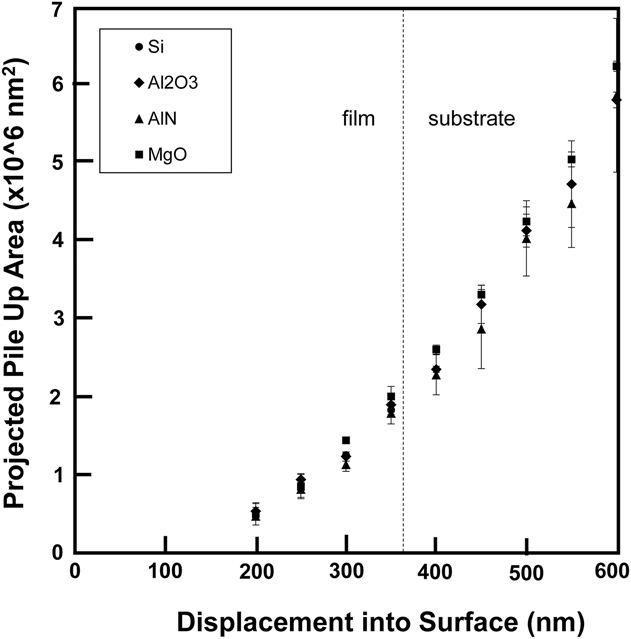
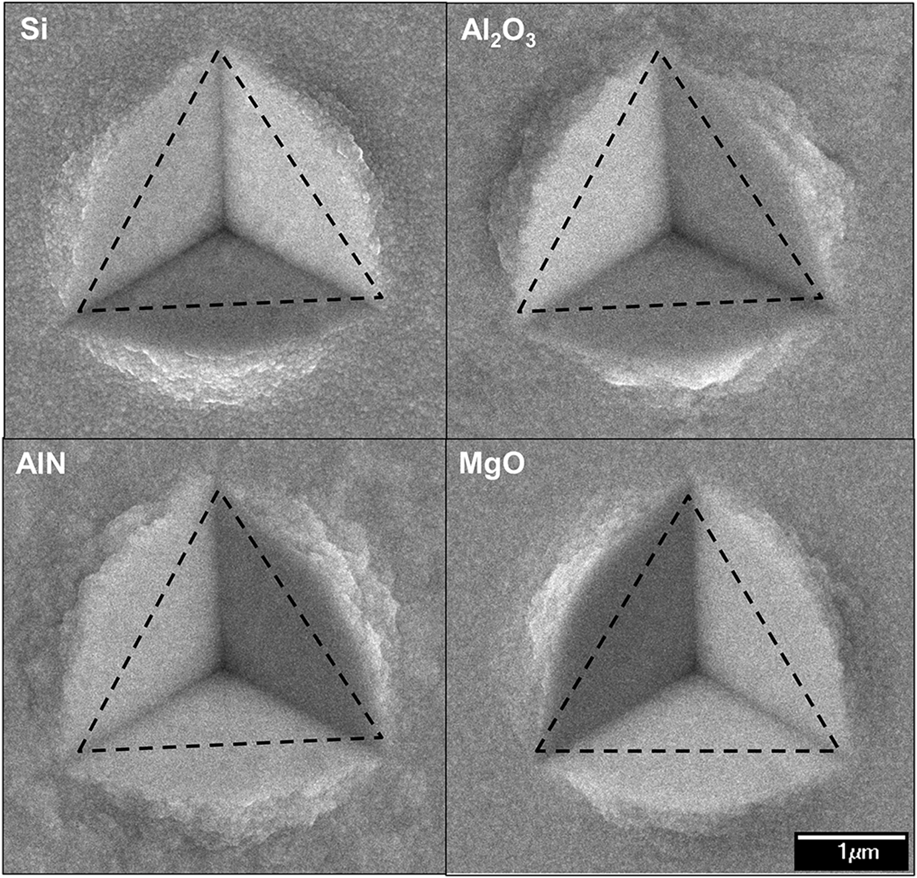
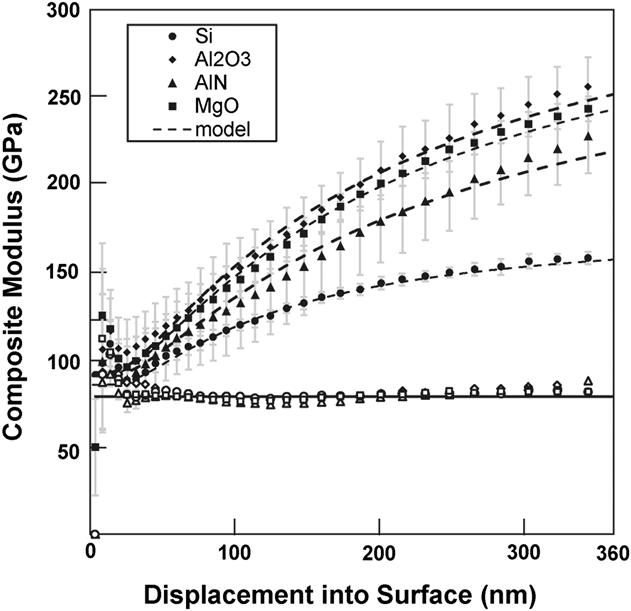
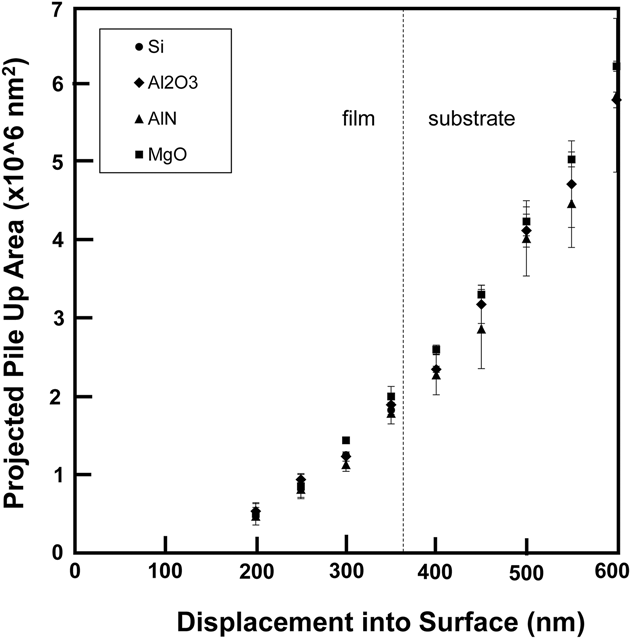
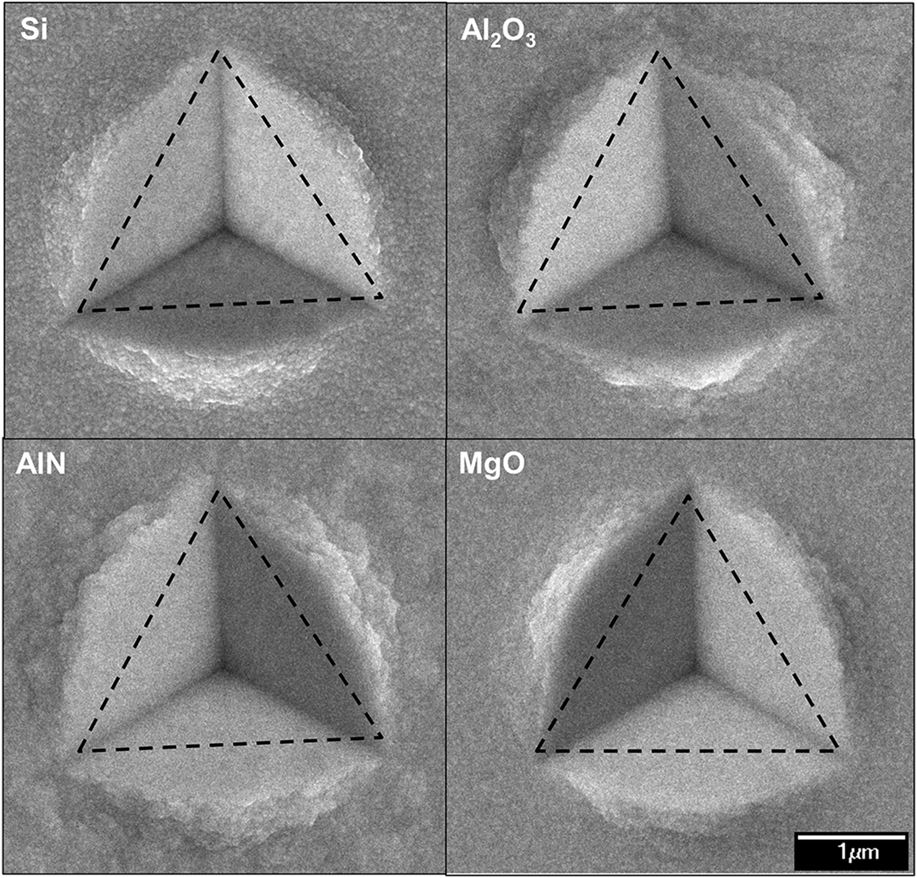
To assess whether the degree of plastic pile-up was insensitive to the substrate elastic modulus, gold films were also simultaneously deposited on Si, Al2O3, AlN, and MgO substrates and then subsequently indented. For the 360 nm thick gold film, composite modulus was plotted as a function of displacement into the surface in Fig. 8. Here, the film/substrate composites with the stiffer substrate yielded higher composite modulus values, as expected. In these cases, the Zhou–Prorok model continued to adeptly predict the average behavior for each film/substrate combination, using values in Table I. It also extracted the film modulus for each data point (open symbols). The physical material properties used in the Zhou–Prorok model are seen in Table III, and match the ranges listed in Table I. SEM micrographs were obtained for indents in each film/substrate combination with a final indent depth increasing from 200 to 600 nm. These were analyzed via the same SEM/ImageJ method with projected pile-up area plotted in Fig. 9. Much like the varying film thickness results from Fig. 6, the projected pile-up area followed the same trend and appeared insensitive to the substrate's modulus. Also noteworthy is that after penetrating the film (400 nm and deeper) the pile-up continues to develop in the same manner, further suggesting insensitivity to the presence of the substrate. Figure 10 shows the indent micrographs at 400 nm depth for visual confirmation, suggesting that the degree of pile-up was insensitive to the substrate's elastic properties.
Experimental data of composite modulus versus displacement into surface for 360 nm gold films deposited on substrates Si, Al2O3, AlN, and MgO (closed markers). All follow the Zhou–Prorok model (dashed lines) and predict a constant film modulus (open markers).
Film and substrate properties used in the Zhou–Prorok model.
Projected pile-up area versus displacement into surface for all 360 nm thick gold films on substrates, following the same trend, even past penetrating past the film thickness.
Micrographs at the same magnification for Si, Al2O3, AlN, and MgO. Dashed triangles are identical and represent the projected area from the Berkovich tip.
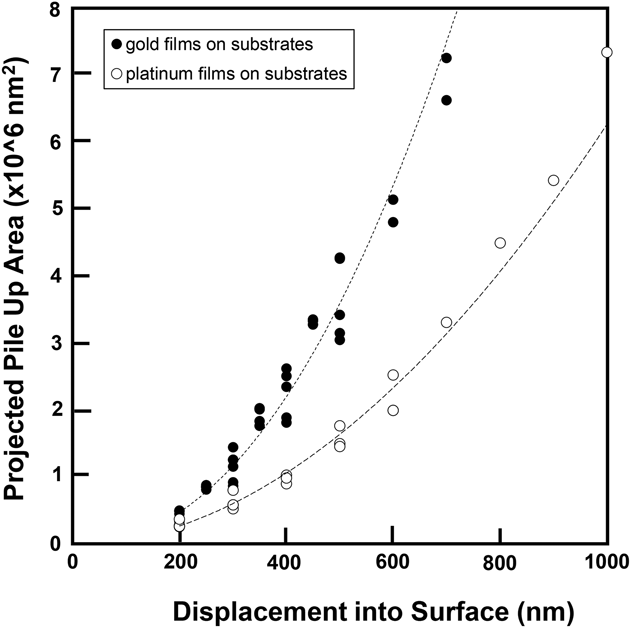
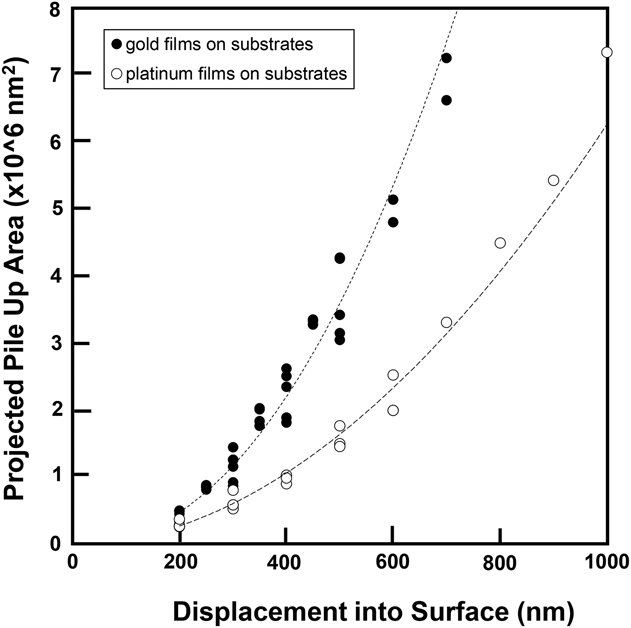
The analysis was repeated using platinum films to confirm the gold results. Figure 11 plots the measured projected pile-up area for platinum films of four different thicknesses (○) as well as all the gold film data presented thus far (●). As with gold, platinum film pile-up was not influenced by film thickness or presence of the substrate. The plot indicates that at any particular indent depth, the gold film experienced more pile-up than the platinum. Although both films are more compliant than the substrate, the gold film was significantly more compliant. However, these pile-up differences cannot be linked to the film elastic moduli. It was established that the Zhou–Prorok model accurately modeled and predicted the elastic behavior of the composite based upon the contribution of the individual components. This model was also found to not be influenced by the degree of pile-up. Thus, the difference then is more likely to be related to the onset of plastic deformation in these materials. This method and its results may segue to eventually enabling the extraction of plastic properties from minimally invasive indentation.
Projected pile-up area plotted against displacement into surface for gold data presented thus far (●) and platinum of different thicknesses on silicon (○).
IV. CONCLUSIONS
These results indicated that when indenting the specific system of a metallic compliant, plastically deforming film on a stiff, nonplastically deforming ceramic-like material, the additional indenter-film contact that occurs from pile-up did not influence the elastic unloading process. The pile-up was independent of film thickness and the elastic properties of the substrate. These findings appear to counter the generally accepted understanding that the additional contact due to pile-up influences the extraction of elastic properties from the indents. The results indicated that corrections to the contact area are not necessary when extracting film modulus from the composite experimental data. These findings will aid researchers in more reliably extracting elastic properties of thin films.