INTRODUCTION
Over the course of history, terms such as Islam, Arab, and Middle Eastern have become increasingly conflated with one another and depicted monolithically in an unfavorable light (Said Reference Said1979; Reference Said2003). Particularly after 9/11, discussions over the status of Muslims in the United States and abroad have garnered considerable media and political attention (Calfano, Lajevardi, and Michelson, forthcoming; Dana, Barreto, and Oskooii Reference Dana, Barreto and Oskooii2011), with Americans evaluating Muslim Americans more negatively than nearly all other ethnic, racial, and religious groups (Edgell, Gerteis, and Hartmann Reference Edgell, Gerteis and Hartmann2006; Putnam and Campbell Reference Putnam and Campbell2010). Muslims were also the subjects of much debate during the 2016 presidential race, with then-candidate Donald Trump proposing that Muslim Americans should register with the federal government. Once in the oval office, President Trump signed an executive order that temporarily banned individuals from seven predominantly Muslim-majority countries from entering the United States.Footnote 1
Given this context, surprisingly little research has examined the roots of anti-Muslim attitudes and support for policies that aim to further marginalize this diverse population at an alarming rate. What we do know is that objections over Muslims and their places of worship have centered on the supposed incompatibility between Islam and core American values (Huntington Reference Huntington2004; Lewis Reference Lewis2002; Panagopoulos Reference Panagopoulos2006; Pipes Reference Pipes2003), and are partly grounded in a generalized sense of ethnocentrism or intolerance for out-groups (Kalkan, Layman, and Uslaner Reference Kalkan, Layman and Uslaner2009; Kam and Kinder Reference Kam and Kinder2012; Schaffner Reference Schaffner2013). Research into the specific content of negative attitudes further suggests that some view Muslim Americans as foreign and disloyal (Selod Reference Selod2015), and associate them with stereotypes related to violence and untrustworthiness rather than laziness and intelligence (Sides and Gross Reference Sides and Gross2013).
The expression of such sentiments by members of the public and political elites have had profound consequences for American Muslims, translating into unprecedented spikes in hate crimes (Lichtblau Reference Lichtblau2016; Rippy and Newman Reference Rippy and Newman2006), opposition toward mosque projects (Wajahat et al. Reference Wajahat, Clifton, Duss, Fang, Keyes and Shakir2011), legislation intended to eliminate the “threat” of Sharia or “Islamic law” (CAIR, 2013; NCSL, 2017), feelings of isolation (Morello Reference Morello2011; Pew 2017), fear of being in public spaces (Abu-Ras and Suarez Reference Abu-Ras and Suarez2009), anxiety and paranoia (Rippy and Newman Reference Rippy and Newman2006), and increased experiences with a variety of forms of societal and institutional discrimination (Oskooii Reference Oskooii2016; Selod Reference Selod2015), particularly among easily identifiable Muslims such as hijabi women (Dana et al., forthcoming).
It is in light of these dismaying circumstances that we aim to push the study of anti-Muslim attitudes forward. Specifically, we assert that more research examining the underlying reasons for opposition toward Muslim Americans and support for restrictive policies—such as the increased scrutiny of mosques and their adherents, new immigration bans, and the enhanced patrolling and surveillance of their respective communities—is necessary. Examining the roots of present-day Islamophobia can also move the debate regarding the interplay between old-fashioned racism (OFR) and “symbolic” or “modern” racism past the Black-white dichotomy and shed light on how other racialized groups are perceived and treated in the current era.
To date, research has not examined whether modern objections toward Muslim Americans are largely rooted in deep-seated, old-fashioned racist beliefs that underlie resentment toward African Americans. We aim to remedy this shortcoming. Drawing from prior work (Huddy and Feldman Reference Huddy and Feldman2009; Tesler Reference Tesler2012), we first contend that OFR should not be prematurely dismissed as an outdated concept in American politics. Second, we assert that old-fashioned racist beliefs toward Muslim Americans is not only evident but also plays a crucial role in explaining support toward political actors and policy proposals that aim to further isolate Muslims domestic and foreign. Third, and more crucially, we claim that the relationship between OFR and various individual-level political preferences is likely mediated by the more subtle, common, and modern anti-Muslim expressions of resentment, such as the claim Muslims are “unwilling to integrate into American culture” or “do not have the best interest of America at heart.”
To test these propositions, we leverage an original survey collected by Survey Sampling International (SSI) in December 2016 that contains several unique measures not available in other datasets. Specifically, we rely on Kteily et al.'s (Reference Kteily, Bruneau, Waytz and Cotterill2015) “Ascent” measure to demonstrate that a nontrivial portion of survey respondents do, in fact, endorse old-fashioned racist beliefs in that they rate Muslim Americans as the least “evolved” group when compared with whites, African Americans, Latinos, and Asian Americans. This blatant dehumanization measure, we argue, serves as a reliable proxy for OFR because it captures the deep-seated belief in the inherent inferiority of some groups over others. To account for modern expressions of Islamophobia and to examine its roots, we take advantage of Lajevardi's (Reference Lajevardi2017) new Muslim American resentment scale (MAR) that takes into account the multitude of ways in which the perceived attitudes and behaviors of Muslim Americans have been critiqued in the United States. Together, these measures, along with a series of different analyses, provide strong evidence for the assertion that existing objections to Muslim Americans, which are often couched into concerns over “cultural differences” or fears of “radicalization,” are largely explained by beliefs in one's racial superiority and Muslims Americans’ inherent inferiority. Our research thus makes an important contribution to the study of racial and ethnic politics by suggesting that blatant racism (OFR) should not be dismissed as an outdated concept, but rather one that plays a key role in the assessment of other racialized groups, particularly Muslim Americans.
In the pages that follow we go into further detail by first reviewing the rich literature of racial attitudes with specific attention to the link between OFR and modern racism to situate our main argument. We then discuss prior research on anti-Muslim sentiments, make the case that the role of OFR has largely been overlooked by existing accounts, and stipulate a set of expectations. Next, we present our dataset, go over our unique measures of blatant dehumanization and MAR, and describe all of our dependent variables. Lastly, we present a number of analyses to test our proposed claims before concluding the paper with a discussion of the findings and their significance as they pertain to contemporary Islamophobia and racial attitudes more broadly.
THE NEXUS BETWEEN “OLD” AND “NEW” RACISM
From the colonial days until the mid-twentieth century, various racial and ethnic groups were stigmatized and alienated as a result of their supposed biological and moral deficiencies (Bruyneel Reference Bruyneel2007; Kim Reference Kim1999; Ngai Reference Ngai2014; Omi and Winant Reference Omi and Winant2014; Smith Reference Smith1993). Many whites espoused the belief that African Americans, in particular, were intellectually, biologically, and culturally inferior, unevolved, and “ape-like” in appearance (Baker Reference Baker1998; Plous and Williams Reference Plous and Williams1995).Footnote 2 Indeed, first-hand accounts of life in the Jim Crow South attest that the usage of various racial slurs by the public and political elites was a constant reminder of Blacks’ inherent inferiority, especially when they tried to challenge white authority (Wright Reference Wright and Rothensberg1937). Numerous public opinion surveys as late as the 1940s further illustrated that majorities of whites nationwide subscribed to this ideology of white supremacy (Kinder and Sanders Reference Kinder and Sanders1996; Mendelberg Reference Mendelberg2001), openly supporting de jure and de facto racial discrimination and segregation in various settings (Bobo and Kluegel Reference Bobo, Kluegel, Tuch and Martin1997; Bobo, Kluegel and Smith Reference Bobo, Kluegel and Smith1997; Hyman and Sheatsley Reference Hyman and Sheatsley1956; Pettigrew Reference Pettigrew1982).
Eventually, the outright expression of the inherent, permanent, and biological differences between the races—what is referred to as “old-fashioned racism”, “Jim-Crow racism” or “red-neck racism”—and support for policies intended to further marginalize and stigmatize non-whites on such accounts appeared to have declined. By the mid-1950s, the vast majority of whites expressed willingness to reject racial stereotypes and rejected pseudo-scientific, genetic-based arguments that Blacks were biologically inferior (Bobo, Kluegel, and Smith Reference Bobo, Kluegel and Smith1997; Mendelberg Reference Mendelberg2001). Indeed, publicly sharing such beliefs had become progressively “taboo,” and explicit appeals to white supremacy by political elites that were once rampant started to vanish (Bobo Reference Bobo2001; Kinder and Sanders Reference Kinder and Sanders1996; Mendelberg Reference Mendelberg2001).
Yet, despite the decline in outright expressions of OFR (Firebaugh and Davis Reference Firebaugh and Davis1988; Schuman, Steeh, and Bobo Reference Schuman, Steeh and Bobo1985; Taylor, Sheatsley and Greeley Reference Taylor, Sheatsley and Greeley1978) and increased opposition toward school and residential segregation (Sears, Henry, and Kosterman Reference Sears, Henry, Kosterman, Sears, Sidanius and Bobo2000), support for policies that intended to bring about greater integration and equality remained relatively low (Kluegel and Smith Reference Kluegel and Smith1986; Schuman, Steeh, and Bobo Reference Schuman, Steeh and Bobo1985; Steeh and Schuman Reference Steeh and Schuman1992). The paradox between the endorsement of racially egalitarian principles but opposition to racially egalitarian policies led some scholars to conclude that we have entered a new era of racism; one that has been referred to as symbolic racism (Kinder and Sears Reference Kinder and Sears1981; McConahay and Hough Reference McConahay and Hough1976; Sears Reference Sears, Katz and Taylor1988; Sears and Henry Reference Sears and Henry2003; Sears and Kinder Reference Sears and Kinder1971; Sears, Henry and Kosterman Reference Sears, Henry, Kosterman, Sears, Sidanius and Bobo2000), modern racism (McConahay Reference McConahay, Dovidio and Gaertner1986), laissez-faire racism (Bobo, Kluegel and Smith Reference Bobo, Kluegel and Smith1997), racial resentment (Kinder and Sanders Reference Kinder and Sanders1996), subtle prejudice (Pettigrew Reference Pettigrew1982), racial ambivalence (Katz Reference Katz2014) or aversive racism (Gaertner and Dovidio Reference Gaertner, Dovidio, Dovidio and Gaertner1986).
Though these terms differ slightly from one another in nuanced ways, each encapsulates the notion that most whites have become more egalitarian in principle—at least when directly asked about their racial attitudes—and also that a new form of subtle or covert racism has emerged to preserve and justify existing racial hierarchies and privileges. Instead of opposing explicitly race-conscious policies based on blatant racist attitudes, the modern racism thesis suggests that resentful whites started to employ a more sophisticated and coherent belief system that consisted of a blend of prejudice toward Blacks as a group, which is deep-seated and likely acquired through preadult socialization (Kinder and Sears Reference Kinder and Sears1981), and the belief that Blacks’ failure to progress results from their unwillingness to work hard enough (Henry and Sears Reference Henry and Sears2002; Kinder Reference Kinder1986; Sears and Henry Reference Sears and Henry2003). In other words, pervasive racial inequalities between whites and Blacks is said to now be explained as stemming from African Americans’ own cultural inadequacies, particularly individualistic shortcomings, rather than past/current discrimination or structural impediments to equality.
Despite the increased attention to and much scholarly work unpacking the new racism thesis, research has nevertheless demonstrated that the blatant OFR never really disappeared in the first place. Overt measures of prejudice continued to be significantly linked to a variety of preferences, such as lack of support for governmental assistance to Blacks (Bobo and Kluegel Reference Bobo, Kluegel, Tuch and Martin1997; Virtanen and Huddy Reference Virtanen and Huddy1998), affirmative action (Hughes Reference Hughes1997), college scholarships (Virtanen and Huddy Reference Virtanen and Huddy1998), New York housing integration laws (Feldman, Huddy, and Perkins Reference Feldman, Huddy and Perkins2009), and, more recently, partisan preferences in the Obama era (Tesler Reference Tesler2012). The literature on racial attitudes has further strengthened the link between OFR and modern racism by making the case that OFR (1) is at the root of racial resentment, (2) has been acquired through early socialization experiences, and (3) is hard to shake even in the face of changing norms (Kinder and Sears Reference Kinder and Sears1981; Sears and Henry Reference Sears and Henry2003; Tesler Reference Tesler2012).
Research on OFR versus modern racism is ongoing and has certainly provided many insights into racial attitudes in the American context. However, one critical shortcoming of extant research is that it has overwhelmingly focused on the Black-white dichotomy. The lack of detailed attention to other groups, particularly Muslim Americans, has left us with little insight into the origins of public support for political actors and policies that aim to isolate other racialized groups. One important question is whether the relationship between OFR, modern racism, and mass attitudes functions in a similar way for Muslim Americans as it does for African Americans. Certainly, contemporary arguments against Muslim Americans, while somewhat unique in their focus of Muslims as foreign outsiders, resemble modern sentiments espoused against African Americans in that they too appear to be grounded in OFR—a point which we will turn to next.
OFR AND THE ROOTS OF CONTEMPORARY ISLAMOPHOBIA
“In any war between the civilized man and the savage, support the civilized man. Support Israel. Defeat Jihad.” – 2012 Anti-Muslim advertising campaign in New York City subways.
Despite increased scholarly attention to modern Islamophobia, it is often forgotten that “American anti-Muslim attitudes are as old as the United States” (GhaneaBassiri Reference GhaneaBassiri and Ernst2013). Historically, negative images of Islam have pervaded much of the popular and political discourse, monolithically depicting a very diverse group of peoples with distinctive cultures, histories, and languages as violent, intolerant, barbaric, and out of touch with modern social norms (Esposito Reference Esposito1999; GhaneaBassiri Reference GhaneaBassiri and Ernst2013; Kazemipur Reference Kazemipur2014; Said Reference Said1979; Reference Said2003; Shaheen Reference Shaheen2003). Accordingly, Muslims, despite being a diverse religious group, have been racially coded, identified, named, and categorized (Dana et al., forthcoming; Selod Reference Selod2015), with their cultural and religious values and practices consistently criticized and constructed at odds with democratic norms and principles (Dana, Barreto, and Oskooii Reference Dana, Barreto and Oskooii2011; Dana, Wilcox-Archuleta, and Barreto Reference Dana, Wilcox-Archuleta and Barreto2017; Selod Reference Selod2015).
This lens through which American Muslims and those originating from Muslim-majority countries have long been viewed through has only become more distorted in the twenty-first century. The tragic events of 9/11 and the ensuing War on Terror, numerous other terrorist attacks in the United States and abroad, and the rise of radical Islamic groups such as Al-Qaeda and ISIS have rendered Muslims more visible in the American imagination (Cainkar Reference Cainkar2009; Reference Cainkar2002). Not surprisingly, numerous public opinion polls have shown that American Muslims are currently viewed very unfavorably—often worse than any other racial, ethnic, or religious group—and that blatant hostility towards them or those perceived to be Muslim has been on the rise over the past couple of decades (Edgell, Gerteis, and Hartmann Reference Edgell, Gerteis and Hartmann2006; Khan and Ecklund Reference Khan and Ecklund2012; Lajevardi Reference Lajevardi2017; Panagopoulos Reference Panagopoulos2006; Selod Reference Selod2015; Tesler Reference Tesler2017).
Research that has attempted to identify the specific factors that may be driving anti-Muslim sentiments in the United States suggests that antipathy toward Muslim Americans follows the same pattern as prejudice toward other stigmatized minorities. Even though the specific stereotypes associated with Muslim Americans may differ from those associated with other racialized groups (Sides and Gross Reference Sides and Gross2013), a generalized sense of ethnocentrism or dislike toward various outgroups strongly predicts unfavorability toward Muslim Americans (Kalkan, Layman, and Uslaner Reference Kalkan, Layman and Uslaner2009), opposition toward the construction of their places of worship (Schaffner Reference Schaffner2013), and opposition toward president Obama during the 2008 general election due to the widespread belief that he was or might have been Muslim (Kam and Kinder Reference Kam and Kinder2012; Tesler Reference Tesler2017).
While prior work has linked ethnocentrism to Islamophobia and demonstrated that there is some overlap in how some racialized outgroups are viewed, these studies have not shown whether the common expressions of condescension or justifications currently provided to marginalize Muslim Americans are linked to the same old-fashioned type of racism that was once (and continues to be) directed at African Americans and other marginalized populations such as Native Americans.Footnote 3 To be clear, ethnocentrism is a deep-seated psychological predisposition of partitioning the world into “us” versus “them” (Kinder and Kam Reference Kinder and Kam2009). It is a broad and general reaction to outsiders that is commonly operationalized with a set of stereotype measures to ascertain a sense of in-group favorability and out-group bias (Kam and Kinder Reference Kam and Kinder2012). Ethnocentric-only accounts, therefore, do not necessarily provide us with any specific insights into the roots of contemporary Islamophobia beyond the fact that some individuals tend to partition the world into allies and adversaries.
As such, we assert that extant research has not empirically examined whether present-day expressions of resentment toward Muslim Americans is largely grounded in deep-seated racist beliefs that some groups are inherently inferior to others. Certainly, recent evidence suggests that the construction of minority groups as sub-human is still disturbingly prevalent in contemporary United States, and that individuals who display such sentiments cast groups such as Latinos and Muslims in threatening terms, display support for political actors that employ xenophobic rhetoric, and strongly endorse aggressive, anti-immigrant policy measures such as building a wall along the Mexican border (Kteily and Bruneau Reference Kteily and Bruneau2017). Given this context, the distorted lens through which Islam has historically been depicted, and the ensuing racialization of Muslim Americans, we find a reason to believe that old-fashioned views about the inherent inferiority of Muslims sits at the core of existing resentment and arguments levied against both domestic and foreign adherents of Islam.
A cursory glance at the recent dehumanizing rhetoric against Muslims makes our claim particularly pertinent. For instance, in 2015, a California lawmaker tweeted “#StandUpToIslam” in response to “Islamic savages” who had killed an American humanitarian worker.Footnote 4 Despite the Council on American Islamic Relations pointing out that “Islamic savages” is language constituting “hate rhetoric” and asking her to retract it, the Councilwoman refused and instead responded by writing: “I've had enough of Islamic extremists and terrorists who oppress women and burn people alive in the modern world… This isn't about hash tags; it's about America standing up with our allies and putting an end to the barbaric behavior we are witnessing around the world.” Other political actors have not shied away from dehumanizing Muslims or those who are perceived as such. During the 2016 presidential campaign, Ben Carson compared Syrian refugees with “rabid dogs,” Mike Huckabee described Muslims as “uncorked animals,” and Donald Trump made numerous inflammatory remarks about Muslims at his campaign rallies.Footnote 5 In the aftermath of the election, blatant hostility toward Muslims has arguably worsened. In March of 2017, a Republican congressman, Steve King, suggested that immigration involving Muslim children is somehow stopping America's civilization from being “restored.”Footnote 6 And more recently, Congressman Clay Higgins posted derogatory comments on his facebook page, writing: “The free world… all of Christendom… is at war with Islamic horror. Not one penny of American treasure should be granted to any nation who harbors these heathen animals.”
Considering that hostility toward Muslims foreign and domestic predates 9/11, is openly espoused, and peppered with blatant dehumanizing language (as illustrated above), we expect to find evidence for the following trends: (1) Individuals will display clear patterns of race-based prejudice and rate some groups as more inferior than others; (2) Muslim Americans will be rated particularly negative when compared with other groups; (3) The clear endorsement of OFR will powerfully predict modern resentment toward Muslim Americans and preferences toward anti-Muslim policies and political actors; and more importantly (4) At the origins of present-day Muslim resentment sits old-fashioned racist ideologies, similar to how racial resentment toward African Americans is partially rooted in feelings of one's inherent racial superiority. Stated differently, we expect the relationship between OFR and various pertinent political preferences to be mediated by our measure of MAR.
DATA AND MEASURES
The present study builds off of the extant research on racial attitudes generally, but proposes more specific questions about the status of Muslims Americans that are particularly important to answer in the age of Trump: (1) To what extent do survey respondents display clear patterns of blatant racism (OFR) toward some groups but not others? Is OFR a racial ideology of the past as some scholars have suggested? Relatedly, how are Muslim Americans evaluated vis-à-vis other groups such as whites, African Americans, Latinos, and Asian Americans? Is it the case that Muslim Americans are viewed as the least favorable outgroup on the block? (2) If OFR still plays a prominent role in how individuals evaluate different groups, how is it related to the evaluation of political actors and policies that aim to marginalize Muslim Americans? (3) More importantly, are modern objections toward Muslim Americans, such as the assertion that “they are unwilling to integrate into the American culture” or that “Muslim Americans do not have the best interest of Americans at heart,” rooted in OFR? (4) If so, to what extent does the current expressions of resentment toward Muslim Americans mediate the relationship between OFR and various political preferences?
Answering the aforementioned questions requires a unique dataset that contains a number of specific measures directly pertaining to Muslim Americans. Unfortunately, known datasets such as the American National Election Study or the Cooperative Congressional Election Study lack such specificity. As such, we fielded an original survey of 1,044 respondents in the United States balanced on race in December 2016 through Survey Sampling International (SSI). Out of the total number of participants in this sample, 66% (685) identified as Caucasian/white, 13% (136) as Black/African American, 16% (171) as Hispanic/Latino, and 5% (52) as Asian American.
In the ensuing analyses, we include all four groups, because, as will be illustrated, white respondents are not alone in rating Muslim Americans as the least “evolved” group. We do, however, caution that any conclusions about the attitudes of Asian Americans, in specific, be reached with hesitation as they only comprise a small subset of the total sample. Furthermore, given that this is an “opt-in,” online-only survey, the results should not be generalized to the overall U.S. population.Footnote 7 Setting the aforementioned limitations aside, and given the alternatives, this dataset is very valuable in that it enables us to conduct the first test of the relationship between OFR, Muslim resentment, and various political preferences related to domestic and foreign Muslims.Footnote 8 An analysis of unique datasets such as this one can also help advance research on racial attitudes beyond the Black-white dichotomy, and hopefully, encourage social scientists to engage in further theorizing as well as employing more sophisticated measures and methods to further examine the roots of contemporary Islamophobia in the United States and abroad.
Blatant Dehumanization
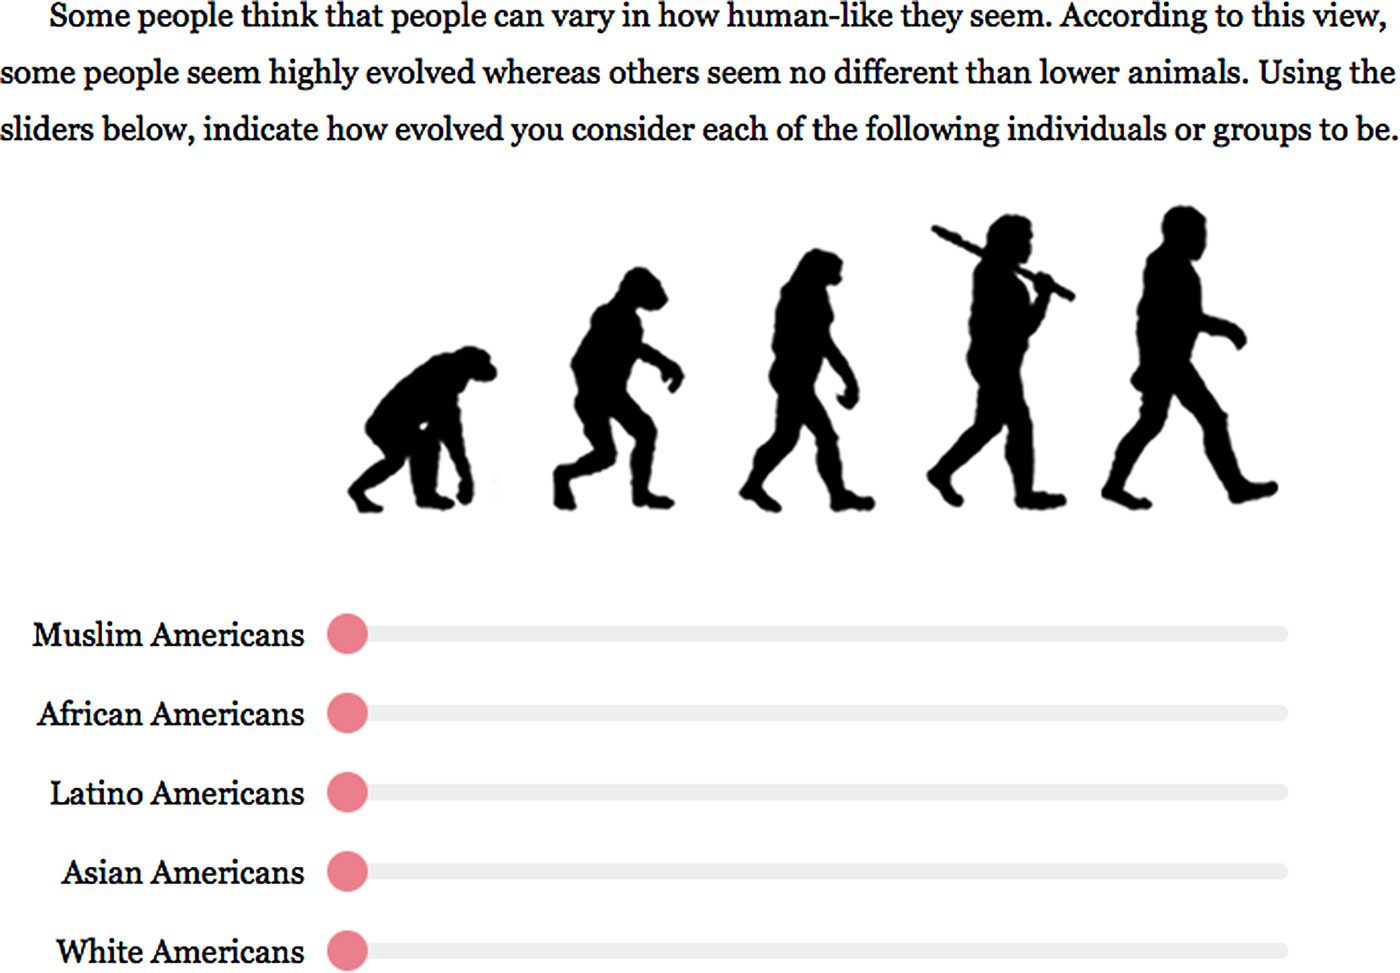
To measure OFR, we rely on Kteily et al.'s (Reference Kteily, Bruneau, Waytz and Cotterill2015) “Ascent of Man” measure of blatant dehumanization, which presents respondents with silhouettes that reflect popular perceptions of the evolution of humans.Footnote 9 As Figure 1 demonstrates, these images begin with a distant human ancestor resembling an ape followed by a more upright ancestor to an image of a Neanderthal holding a spear, and finally ends with a depiction of an advanced, modern-day human. As Kteily et al. (Reference Kteily, Bruneau, Waytz and Cotterill2015) have argued, “…the Ascent measure of blatant dehumanization is brief, face-valid and intuitive, and represents the overt and direct denial of humanness required of blatant dehumanization” (Kteily et al. Reference Kteily, Bruneau, Waytz and Cotterill2015, p. 904). The measure captures biological inferiority and invokes an explicit animalistic distinction by displaying images that range from the quadrupedal hominid to the bipedal modern human. Given that individuals are asked to share their perceptions of the “evolvedness” of a number of groups, including their own, this measure is considered hierarchical in that each silhouette represents an “advance” or “Ascent” over the previous one.
“Ascent of man” measure.

Kteily and colleagues have tested this measure in seven studies across three different countries to demonstrate that blatant dehumanization predicts a number of attitudinal and behavioral outcomes toward multiple outgroups, illustrating its construct validity. The Ascent scale has also been utilized in numerous other studies to elucidate, for instance, the role that blatant dehumanization plays in rationalizing intergroup aggression (Bruneau Reference Bruneau2016; Bruneau and Kteily Reference Bruneau and Kteily2017; Kteily and Bruneau Reference Kteily and Bruneau2017; Kteily, Hodson, and Bruneau Reference Kteily, Hodson and Bruneau2016; Kteily and Bruneau, Reference Kteily and BruneauN.d.), even white support for punitive criminal justice policies (Jardina and Piston, in progress).
For the purposes of the present study, we consider the Ascent measure as a classic example of OFR, given that it reveals openly held beliefs about the inherent inferiority of some groups relative to one's ingroup. This is akin to the historical depiction of some groups as animalistic (e.g., apes, cockroaches, vermin, etc.), subhuman, and genetically and morally inferior than others, particularly whites. Thus, this measure represents OFR racism insofar as respondents are allowed to clearly identify some groups as more “human-like” than others.
In the SSI sample, all of the participants were instructed to view the “Ascent” figure, and presented with the following prompt: “Some people think that people can vary in how human-like they seem. According to this view, some people seem highly evolved whereas others seem no different than lower animals. Using the sliders below, indicate how evolved you consider each of the following individuals or groups to be.” After the prompt, respondents then proceeded to compare all the five groups presented to them; group presentation order was randomized across participants. Responses on the continuous slider were then converted to a rating that ranges from 0 (least “evolved”) to 100 (most “evolved”). We refer to this specific measure as the “Raw Ascent Rating.” In line with prior research, we also created an “Adjusted Ascent Rating” where the respondents’ ratings for other groups are subtracted from the respondents’ own group rating (Kteily et al. Reference Kteily, Bruneau, Waytz and Cotterill2015). We provide more details about both measures in the findings section of the paper.
Muslim American Resentment
To account for a reliable and unidimensional measure of modern racism that is specifically geared toward Muslim Americans and takes into account the multitude of ways in which this population is portrayed in contemporary United States, we rely on a new MAR scale developed by Lajevardi (Reference Lajevardi2017). The MAR scale has been tested across a number of national and convenience sample surveys, and comprises nine statements that capture present-day objections toward Muslim Americans:Footnote 10 (1) Most Muslim Americans integrate successfully into American culture, (2) Muslim Americans sometimes do not have the best interests of Americans at heart, (3) Muslims living in the United States should be subject to more surveillance than others, (4) Muslim Americans, in general, tend to be more violent than other people, (5) Most Muslim Americans reject jihad and violence, (6) Most Muslim Americans lack basic English language skills, (7) Most Muslim Americans are not terrorists, (8) Wearing headscarves should be banned in all public places, and (9) Muslim Americans do a good job of speaking out against Islamic terrorism. Responses to these individual items were measured using a 0–100 scale, where higher values indicate more agreement with the resentful position. Items 1, 5, 7, and 9 were reverse coded so that increasing values indicate greater resentment.
In our dataset, the scale yields a Cronbach's alpha reliability coefficient of .85. In constructing the MAR scale, we first added each individual item and then divided it by nine to obtain an index that ranges from 0 (no resentment) to 100 (high resentment). This final measure has a mean value of 36.21 and a standard deviation of 20.31.
Other Measures
In addition to the key independent variables discussed above, our analyses also account for a number of standard sociodemographic controls, a measure of political interest, and dummy variables for party identification.Footnote 11 Our sample, which includes a fairly large number of African-American and Latino respondents, is composed of 44% self-identified Democrats, 29% Republicans, and 27% Independents or “others.” Unfortunately, a measure for political ideology was not available. As such, party identification is the only available measure that captures how respondents view the political world. While less than ideal, we are, however, confident that the main results will not substantively be impacted by this shortcoming given the state of party polarization in American politics and the increasing alignment between partisanship and ideology (Layman, Carsey, and Horowitz Reference Layman, Carsey and Horowitz2006; Levendusky Reference Levendusky2009).
Our main analysis assesses how attitudes towards Muslim Americans—both old-fashioned and modern—affect individual-level preferences toward public officials and policies that aim to further isolate this population. Given Donald Trump's anti-Muslim rhetoric through much of the 2016 presidential election, our measure of an anti-Muslim political actor is support toward Trump. Here, respondents were asked to report which candidate (Trump, Clinton, or None of the above) they most supported for President in the past election cycle. Responses to this question were coded so that 1 indicates support for Trump, and 0 indicates otherwise (μ = 0.35; SD = .48). Consistent with other opinion polls, we find that Trump support was exceptionally low among racial and ethnic minority participants relative to whites; while 45% of whites supported Trump, only 7% of African-Americans, 22% of Latinos, and 27% of Asian-Americans did so.
Next, respondents were posed with three policy-related statements that were widely discussed throughout the 2016 presidential race. These policy items were measured on a 0–100 scale, where higher values indicate greater support for the proposal under consideration. The three policy statements posed were: (1) We need to empower law enforcement to patrol and secure Muslim neighborhoods before they become radicalized (μ = 42.3; SD = 33.0); (2) We must limit immigration from Muslim countries of origin until the nation's representatives can figure out what is going on (μ = 48.9; SD = 36.2); and (3) We must limit Muslim Americans from re-entering the United States if they have left for any reason (i.e. vacation, work, longer visits) until the nation's representatives can figure out what is going on (μ = 40.3; SD = 34.2). We refer to these variables as “Patrol,” “Immigration,” and “Re-entry,” respectively.
Finally, we were also very interested in the degree to which individual would endorse a hypothetical policy that would particularly go against core American values. Thus, we asked participants to indicate their level of support toward an additional question: “Policies encouraging Muslim Americans to stay out of politics altogether.” This variable, called “Political Influence,” ranges from 1 to 5, where the highest value indicates strong agreement (μ = 2.54; SD = 1.32). This statement is particularly anti-democratic because it proposes that Muslims exit the political arena and mute their voices.
ANALYSIS AND RESULTS
OFR and Group Ratings
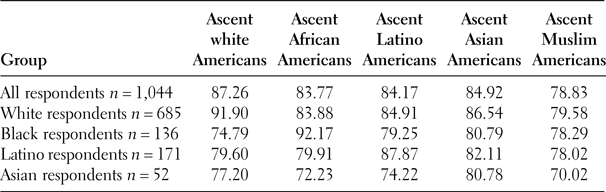
We begin by first examining whether respondents actually differentiated between groups based on the “Ascent of Man” scale. Drawing from prior research on blatant dehumanization, we suspect that humanness is not attributed universally, but applied and denied selectively across groups. If we do not find this to be the case, we would be hard-pressed to argue that some respondents still harbor openly held beliefs about the inherent inferiority of others. Taking a look at the aggregate ratings reported in Table 1, we find strong support for the presence of OFR. Respondents discriminate between different groups, rating whites as the most evolved group (87.26), and Muslim Americans as the least evolved (78.83). When the average Ascent scores are disaggregated by the respondents’ own racial group, the results reveal two additional patterns. First, respondents, on average, rate their own group more positively than others. Second, all groups, with the exception of African Americans, rate their own group as more human-like than Muslim Americans. For instance, white respondents, on average, assigned their ingroup a score of 91.9 but gave Muslim Americans a rating of 79.58. While African Americans rated whites as the least evolved group (74.79), presumably due to a backlash effect, they too, on average, viewed Muslim Americans as one of the most primitive groups relative to their own group.
Mean raw ascent ratings per group

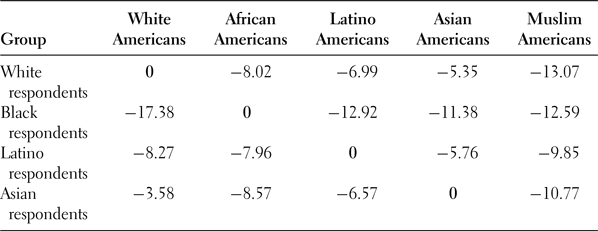
The adjusted Ascent ratings in Table 2 illustrates the aforementioned patterns more clearly. Dehumanization scores were calculated by subtracting the respondent's own in-group score from the Ascent ratings respondents gave to other groups. Table 2, thus, displays the mean dehumanization scores by respondents’ own in-group identification. One important finding becomes clear: of all groups rated, Muslim Americans are the most dehumanized. In fact, each group rates Muslim Americans anywhere between almost 10 and 13 points lower than their own group (μ = −12.23; SD = 26.79). White respondents, followed by Asians, draw the clearest distinctions between different groups. While African Americans rate Latinos, Asians, and Muslim Americans fairly similarly (about 12 points less human than their own group), whites rate Asians more favorably (−5.35), followed by Latinos (−6.99) and African Americans (−8.02), and finally Muslim Americans (−13.07). Similarly, Asian respondents rate whites (−3.58) more positively than Latinos (−6.57), African Americans (−8.57), and Muslim Americans (−10.77). Perhaps most strikingly, when we tabulated the overall adjusted ascent rating, we found that 38.5% of all the respondents in the sample assigned Muslim Americans a score worse than their own group—a clear sign of blatant dehumanization. Stated differently, only 61.5% of the sample did not dehumanize Muslim Americans in the year 2016.
Mean adjusted ascent ratings per group

Note: Adjusted ratings were calculated by subtracting the Ascent scores for other groups from the respondent's in-group Ascent score.
Before concluding this section, it is important to mention that the aggregate scores for Muslim Americans in the SSI sample (78.83) are similar to what Kteily et al. (Reference Kteily, Bruneau, Waytz and Cotterill2015) have reported in their study (77.6) where they include “Muslim” as a comparison group. This similarity raises the possibility that Americans generally do not draw much differentiation between Muslims Americans (domestic) and Muslims (foreign), and that the politicization of events tied to foreign Muslims may, in fact, have an impact on perceptions of Muslims at home.
OFR, MAR, Support for Trump and Anti-Muslim Policies
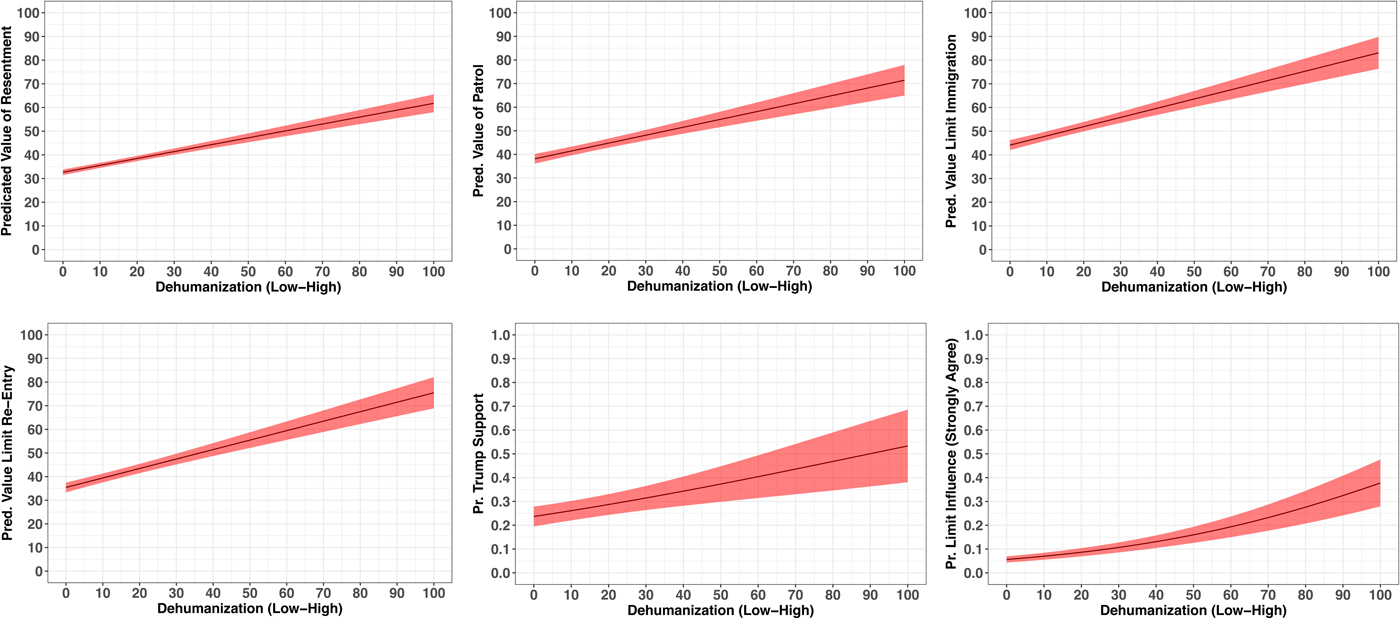
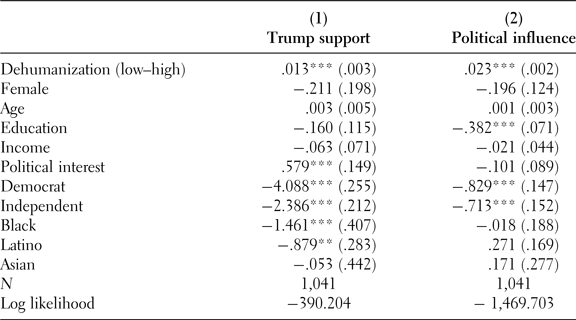
Having established that survey respondents do in fact hold negative, old-fashioned, and dehumanizing attitudes toward Muslim Americans, we next explore the link between OFR, resentment toward Muslim Americans (MAR), support for Donald Trump, and preferences toward various Muslim-specific policies. Table 3 presents summary results of five models in which all the response variables of interest were regressed on the dehumanization measure and a host of controls. For ease of interpretation, we reverse coded our key explanatory OFR variable so that a positive coefficient represents increasing dehumanizing attitudes. We use OLS regression in models 1, 3, 4, and 5, logisitic regression in model 2 (a binary measure of Trump support), and ordered logistic regression in model 6. To gauge the substantive, independent impact of OFR on each outcome variable we calculated and plotted predicted values/probabilities by setting all of the model covariates at their respective means (i.e., held constant).Footnote 12

Results from the six regression models demonstrate a strong, positive association between OFR and each of the outcome measures. Turning to the top left panel of Figure 2, the predicted value of MAR for individuals who rated Muslim Americans extremely subhuman, relative to their own group, is 63. In comparison, the predicted value of MAR for the respondents who did not dehumanize Muslims at all is 33—a difference of 30 points on a MAR scale that ranges from 0 to 100. By and large, we find similar effect sizes for the relationship between OFR and support for patrolling Muslim American neighborhoods, limiting the entry of immigrants from Muslim countries of origin, and banning the re-entry of Muslim-Americans who have left the United States for the purposes of work or vacation. What is particularly interesting is that dehumanizing attitudes towards Muslim Americans is strongly related to placing limits on the entry of both foreign (immigrants) and domestic Muslims. Some survey respondents, thus, do not appear to distinguish very much between the two groups. Moving from the highest dehumanization score to the lowest, the change in the predicted value of both dependent variables is close to 40 points—this is quite a large impact.

Next, we examine the relationship between OFR and support for Donald Trump in the bottom panel of Figure 2. This result is noteworthy; the impact of dehumanization is powerful in predicting support for a presidential candidate who targeted Muslims throughout much of the campaign. The predicted probability of Trump support for individuals who rated Muslim American exceptionally subhuman is roughly 54%. In comparison, the predicted likelihood of Trump support for individuals who did not dehumanize Muslim Americans is 24%—a difference of 30 percentage points. The results for policies excluding Muslim Americans from the political process and muting their voices follows a similar pattern. Individuals who rated Muslims as exceptionally primitive were about 32 percentage points more likely than their counterparts to strongly support a policy that would curb their influence and inclusion in politics.
In sum, the first set of results demonstrate that a respondent's dehumanization score towards Muslim Americans—or the distance between the Ascent rating they attribute to Muslim Americans and that which they give their own group—significantly predicts MAR, support for Donald Trump, and support for policies that aim to further isolate them, even if such policies go against cherished American values of equality and the protection of civil liberties.
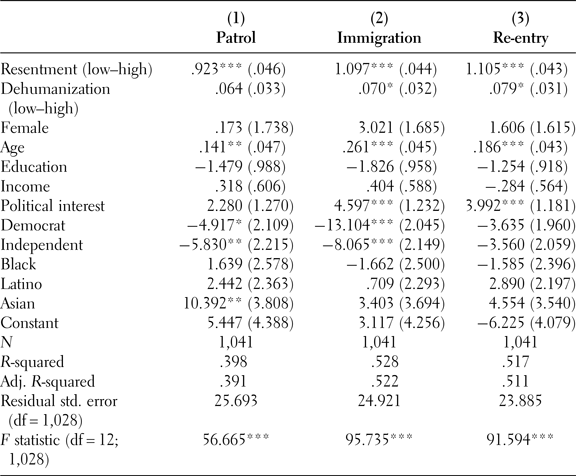
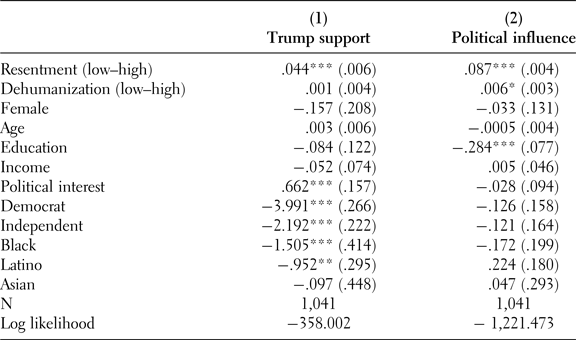
Having established a strong and direct relationship between OFR and each outcome variable, we now move on to examine whether OFR is at the root of contemporary Islamophobia. We first do this by introducing the MAR scale into all of the regression models. If OFR is at the foundation of contemporary anti-Muslim American sentiments, we would expect the inclusion of MAR to almost entirely absorb the impact of OFR.
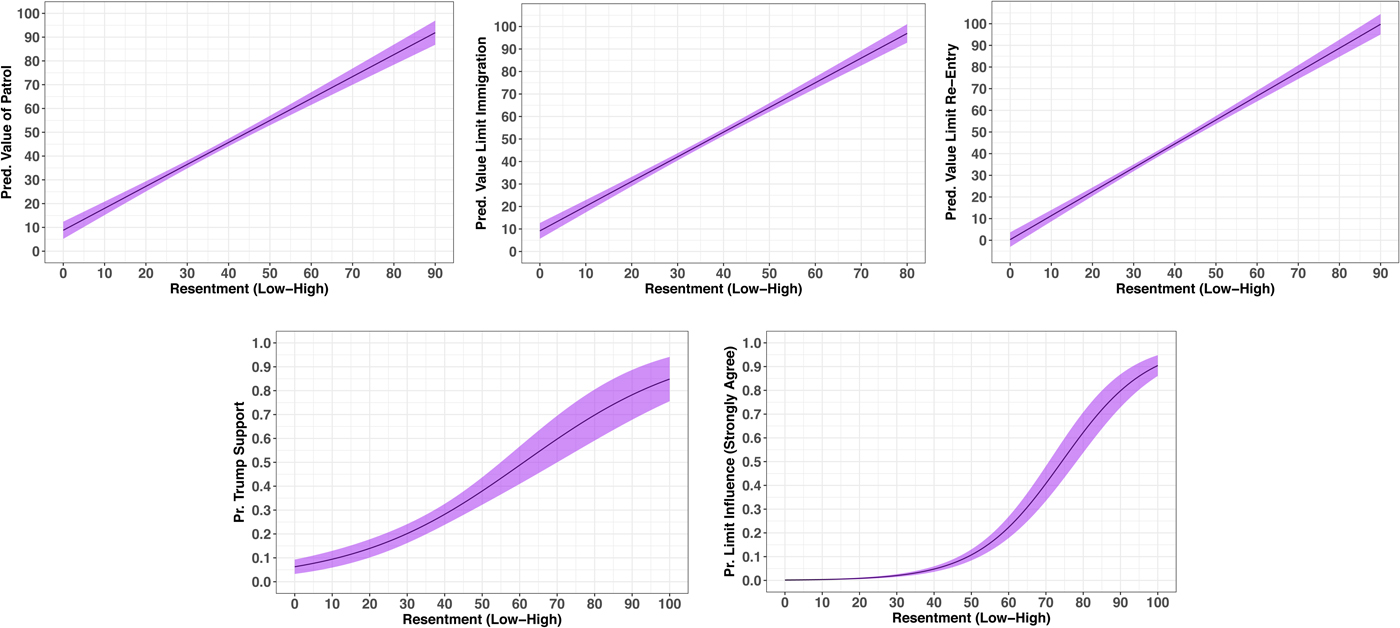
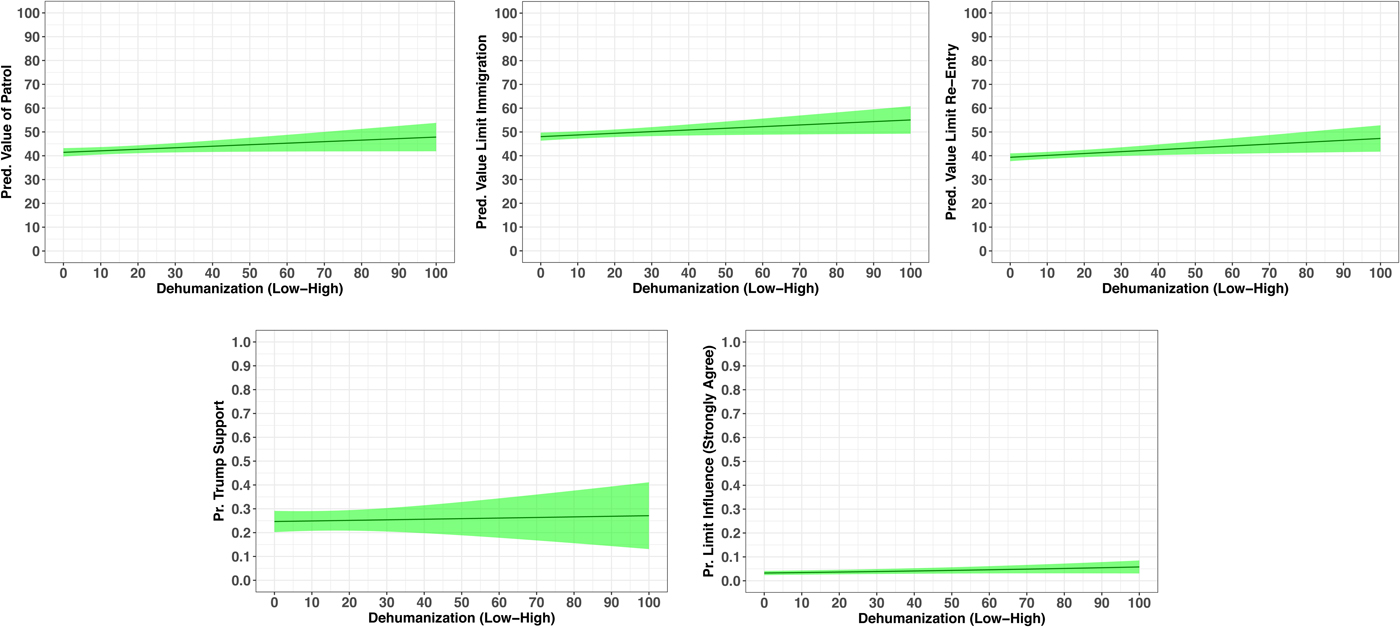
Summary of Table 4 illustrates this to be the case. Accounting for MAR either erases or significantly weakens the strong and statistically significant relationship between dehumanization and each outcome variable of interest. For ease of interpretation, we once again calculated and plotted predicted values/probabilities in Figures 3 and 4.

The impact of OFR with MAR Control. Note: Predicted values/probabilities with 95% confidence bands were calculated by keeping all the model covariates in Tables A3 and A4 at their respective means.

Effect of OFR and Muslim American resentment on support for Trump and policies affecting Muslims

Standard errors in parentheses; two-tailed test.
Significant at ***p < .001; **p < .01; *p < .05.
–Full models are presented in Tables A3 and A4.
Figure 3 reveals that MAR is a powerful indicator of support for Trump and policies aimed at targeting and excluding Muslim. Across the board, a strong relationship between MAR and candidate and policy preferences is present. In fact, the relationship between MAR, increased patrolling of Muslim American neighborhoods, and placing immigration and re-entry limits is so strong that a respondent with a MAR score of 80 or above is nearly as likely as someone with a max score of 100 to fully endorse each policy proposal.
The bottom panel of Figure 3 reveals a similar pattern. Moving from high resentment to no resentment, the change in the predicted probability of supporting Donald Trump reaches 78 percentage points. Likewise, very resentful respondents are 80 percentage points more likely than their counterparts to strongly welcome policies aimed at limiting the political influence and voices of Muslim Americans. In contrast to the previous results where we only control for OFR, Figure 4 demonstrates that the impact of OFR almost disappears or is negligible once MAR is held constant. Overall, these findings provide initial evidence that OFR may be at the root of modern Islamophobia. To further investigate this claim we turn to a series of mediation analyses.
Mediation Analysis
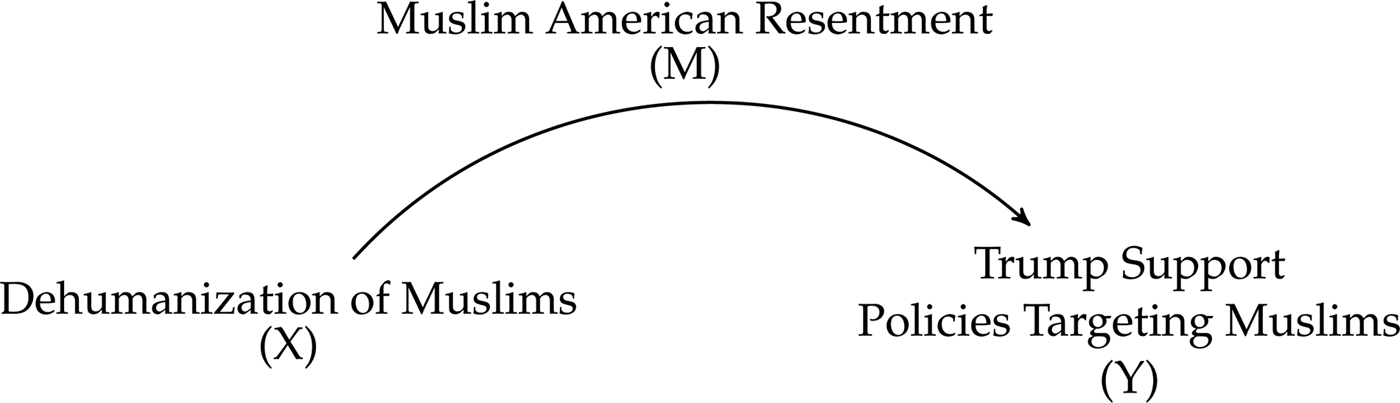
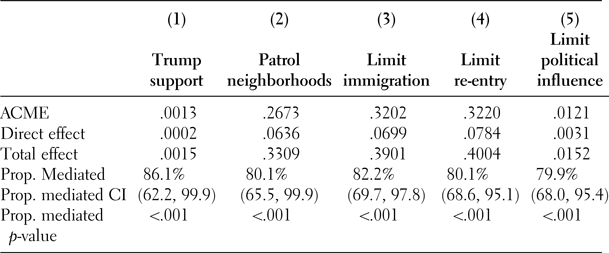
To examine whether the proposed mediational pathway illustrated in Figure 5 is correct, and to find out the degree to which MAR mediates the relationship between OFR and each dependent variable, we estimated a set of mediation models using the “mediation” package in R.Footnote 13
Mediation pathway diagram

Table 5 provides results of all the mediation analyses. The ACME coefficient refers to the “Average Causal Mediated Effect,” which is divided by the estimated “Total Effect” coefficient to obtain the proportion of the total effect that is mediated. “Direct Effect” refers to the direct impact of OFR (X) on each outcome variable (Y). Reported results from the first column demonstrate that the relationship between OFR and support for Trump is almost entirely mediated by MAR; 86.1% of the total effect of OFR's impact on a respondent's support for Trump is mediated by MAR. Columns 2–5 demonstrate a similar pattern. MAR mediates OFR's total effect on patrolling Muslim neighborhoods by 80.1%, limiting immigration from Muslim countries of origin by 82.2%, limiting Muslim American reentry into the country by 80.1%, and limiting the political influence of Muslims by 79.9%.
Summary of mediation analysis results

In sum, the mediation analyses corroborate the regression results reported in Table 4. Across the board, the results provide strong support for the claim that OFR is a key variable in understanding the origins of modern Islamophobia.
ROBUSTNESS CHECK
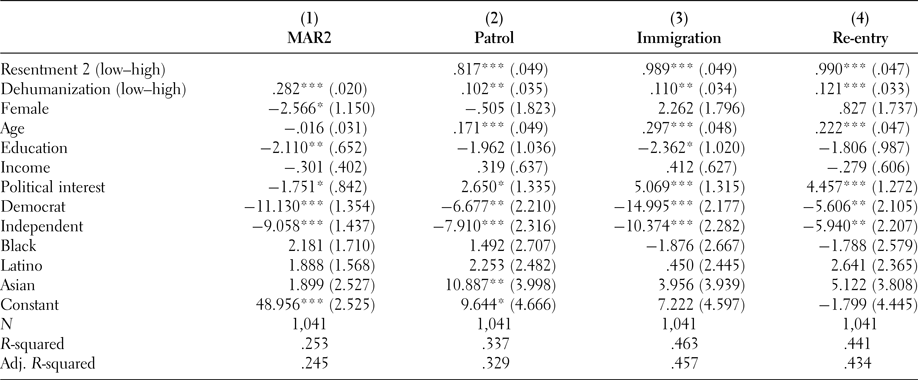
One pressing concern about the present findings is that the MAR scale contains two specific items that resemble our policy-related dependent variables. Specifically, item 3, which asks respondents “whether Muslim living in the US should be subjected to more surveillance than others,” is fairly similar to the policy question about empowering law enforcement to patrol and secure Muslim neighborhoods. Likewise, item 8 of the original MAR scale also concerns policy preferences, as participants were asked whether “headscarves should be banned in all public places.” A legitimate case can, therefore, be made that these two items are essentially measuring anti-Muslim policy preferences rather than gauging the degree to which Muslim Americans’ specific values and behaviors are viewed at odds with American norms and values.Footnote 14
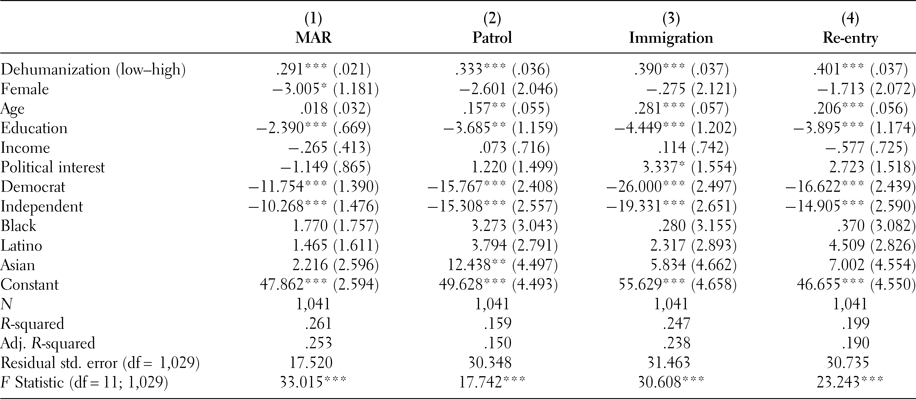
To further examine whether the MAR measure would continue to mediate the impact of OFR on the dependent variables of interest without these two policy-related items, we constructed a second MAR measure (“MAR2”) that excludes items 3 and 8. This new MAR2 scale has a mean value of 36.92, standard deviation of 19.67, and yields a Cronbach's alpha reliability coefficient of .79.Footnote 15 Next, we re-estimated all the original regression models with MAR2. Table 6 provides a summary of the updated regression results.
Summary of Robustness check models

Standard errors in parentheses; two-tailed test.
Significant at ***p < .001; **p < .01; *p < .05.
–Full models are presented in Tables A5 and A6.
Three observations are worth highlighting here, all of which generally support our main conclusions. First, MAR2 is still a very strong predictor of support for Donald Trump and anti-Muslim policies. Across each of the six models in Table 6, an increase in the MAR2 resentment scale yields a significant and positive impact on support for Trump, patrolling Muslim neighborhoods, limiting Muslim immigration, limiting the reentry of Muslim Americans into the United states, and limiting the political influence of Muslim Americans. Moreover, the MAR2 coefficients closely mirror the MAR coefficients in Table 4. Second, the blatant dehumanization measure is also strongly associated with MAR2, with a coefficient that is almost identical to that of the original model reported in Table 3. Finally, the inclusion of MAR2 in the models significantly reduces the impact of blatant dehumanization on each outcome variable. However, we note that MAR2 does not wipe out as much of the independent effect of dehumanization as the original MAR scale did.
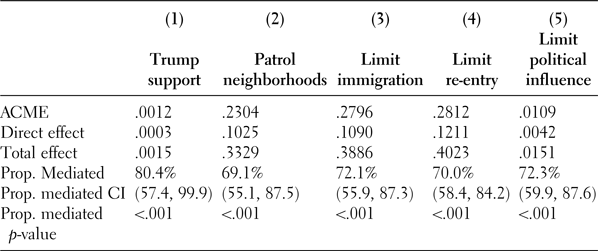
As a final step, we also re-estimated all of the original mediation models with MAR2. The mediation results reported in Table 7 provide strong support for our main claim regarding the interplay between OFR and modern Islamophobia. While OFR has some direct effect on support for Trump and anti-Muslim policy positions, its impact is largely mediated by MAR2. In other words, the updated findings still demonstrate that modern objections toward Muslim Americans are largely driven by old-fashioned, racist beliefs regarding the inherent inferiority of Muslims, and the superiority of one's own race.
Summary of mediation analysis results 2

CONCLUSION AND DISCUSSION
Extant research has documented that American Muslims are viewed very unfavorably by members of the public, and that anti-Muslim sentiments can be explained by a generalized sense of ethnocentrism or dislike of all outgroups. While insightful, such accounts have not specifically examined how old-fashioned beliefs in one's racial superiority and Muslim Americans’ inherent inferiority is linked to modern-day MAR, and individual-level political preferences. Our study addresses this gap in the literature by demonstrating that Muslim Americans are construed as inherently inferior by a large portion of survey respondents, and that such old-fashioned, racist beliefs powerfully predicted respondents’ support for a presidential candidate who advocated for the creation of a Muslim registry and eventually implemented the country's first “Muslim Ban.” Dehumanizing Muslim Americans, operationalized by a unique “Ascent of Man” measure, also had other profound political consequences; OFR powerfully predicted support for exclusionary policies that proposed to further isolate and exclude Muslims from the political sphere. Finally, and most crucially, our research is the first of its kind to demonstrate that the relationship between OFR and political preferences is significantly mediated by present-day resentment toward Muslim Americans. That is, concerns over the incompatibility between Islam and American values and norms is largely a “cover story” to mask beliefs in one's inherent racial superiority and Muslims’ inherent inferiority.
Bringing to bear an original dataset, our results also highlighted two additional facts about the status of Muslims in contemporary American society and politics. First, survey participants did, in fact, differentiated between different groups based on a measure that invoked explicit animalistic and biological distinctions between groups. Second, not only did white, Asian American, Latino, and African American respondents, on average, evaluate their own group as the “most evolved,” they also consistently denied the same level of humanness to Muslim Americans. In fact, Muslim Americans were the only group that was viewed as subhuman and received an aggregate rating of less than 80 points, which is the cut off for a fully evolved human on the blatant dehumanization scale (Kteily et al. Reference Kteily, Bruneau, Waytz and Cotterill2015).
Taken together, these findings have important implication for the study of race and ethnic politics, making an important contribution to the subfield. We extend theories of racial attitudes—which have predominantly focused on white attitudes toward African Americans—to Muslim Americans; a group that has been racialized throughout American history, but which has only recently (since 9/11) captured the American imagination in a significant way. In doing so, we demonstrated that OFR is not an outdated concept and that it can be applied to understand the underlying reasons behind popular critiques of various racialized groups beyond African Americans. For example, Latinos received much attention throughout the election season with then-presidential contender Donald Trump referring to some Mexican immigrants as “criminals,” “murderers,” and “rapists,” and proposing the construction of a wall along the United States-Mexico border to keep out the so-called “illegals.” Characterizing Mexicans in this way provides some indication that old-fashioned racist rhetoric, specifically catered to Latinos, may be experiencing a resurgence as well, and may significantly explain opposition toward Latino-specific policies such as the DREAM Act.
Before we conclude it is important to highlight empirical research about the actual rather than presumed attitudes and behaviors of Muslim in the United States and abroad. These systematic studies stand at odds with the increasingly disconcerting and monolithic depiction of Muslims advanced by some members of the public and political elites. In specific, numerous studies in places such as the United States, UK, Switzerland, and Netherlands have demonstrated the Muslims are mainstream, rapidly integrating, strongly support host society laws and customs, reject politically motivated violence of any kind, and that mosque attendance and increased religiosity promotes, rather than inhibits, participation in various mainstream civic and political activities (Acevedo and Chaudhary Reference Acevedo and Chaudhary2015; Dana, Barreto, and Oskooii Reference Dana, Barreto and Oskooii2011; Dana, Wilcox-Archuleta, and Barreto Reference Dana, Wilcox-Archuleta and Barreto2017; Giugni, Michel, and Gianni Reference Giugni, Michel and Gianni2014; Jamal Reference Jamal2005; Oskooii and Dana Reference Oskooii and Dana2017; Phalet, Baysu, and Verkuyten Reference Phalet, Baysu and Verkuyten2010). The evidence overwhelmingly suggests that Muslims in the West exhibit much closer ties and loyalty to their compatriots than some alarmist accounts would lead one to believe. The juxtaposition of how well Muslims are actually integrating with how some individuals perceive them raises questions about what it would take to effectively counteract anti-Muslim sentiments, especially if at the roots of contemporary Islamophobia sits hard-to-shake, deep-seated beliefs in their inherent inferiority.
ACKNOWLEDGEMENTS
Authors are listed in alphabetical order; authorship is equal. We are grateful for all the insightful feedback provided by the anonymous reviewers. A special thanks is also extended to Marisa Abrajano, Loren Collingwood, Nour Kteily, Katerina Schenke, Michael Tesler, and all of the participants at MSU CREW Workshop, USC Southern California Political Behavior Conference, and the featured APSA panel on Muslims in the American Imagination. Funding for this project was generously provided by the UCSD Policy Design and Evaluation Lab. We are grateful for all the insightful feedback provided by the anonymous reviewers.
Appendix
The impact of OFR on MAR and policy preferences

OFR, Trump support, and limiting political influence

The impact of MAR on policy preferences

MAR, Trump support, and limiting political influence

Robustness check models

Robustness check models
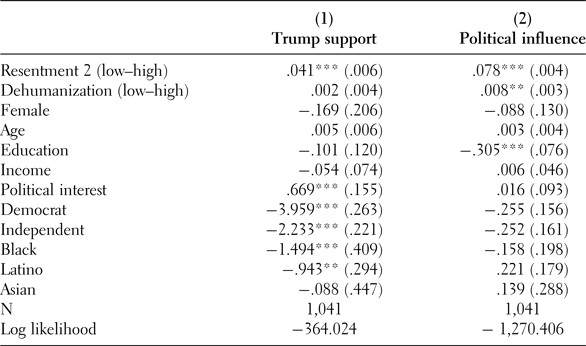
Figures A1 and A2
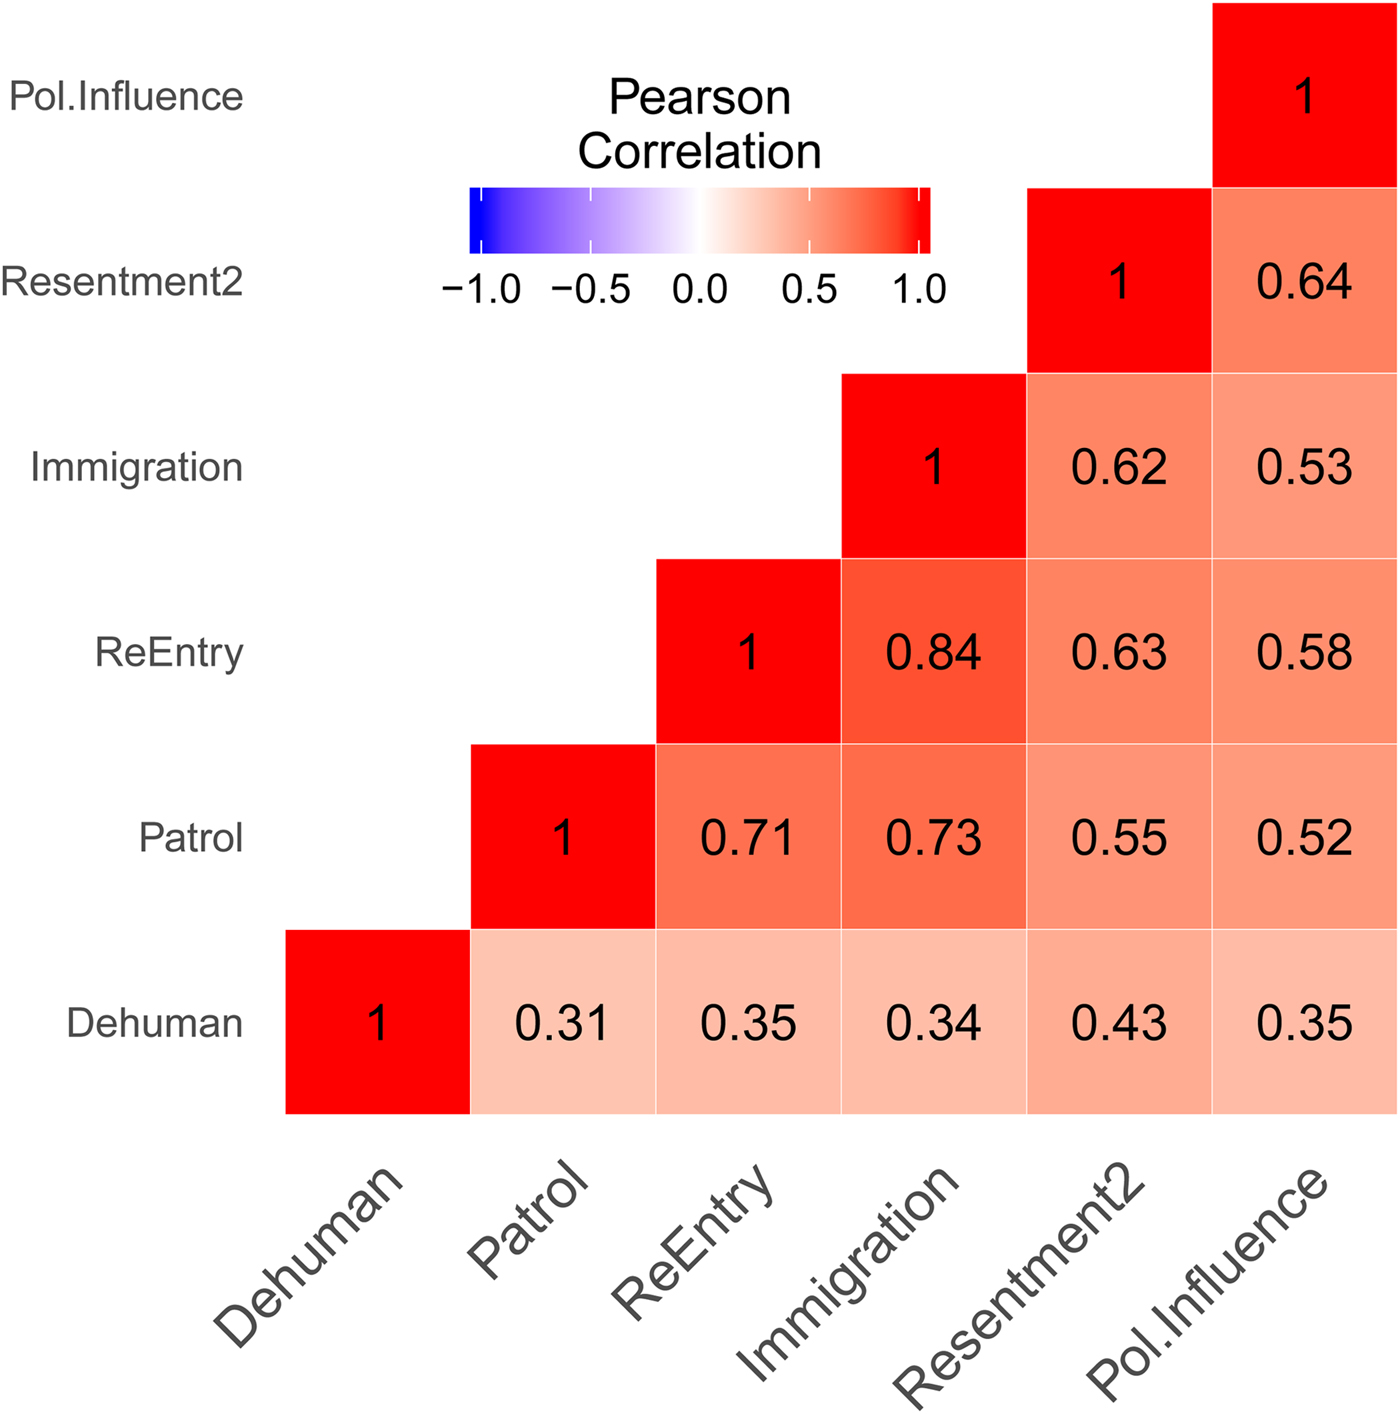
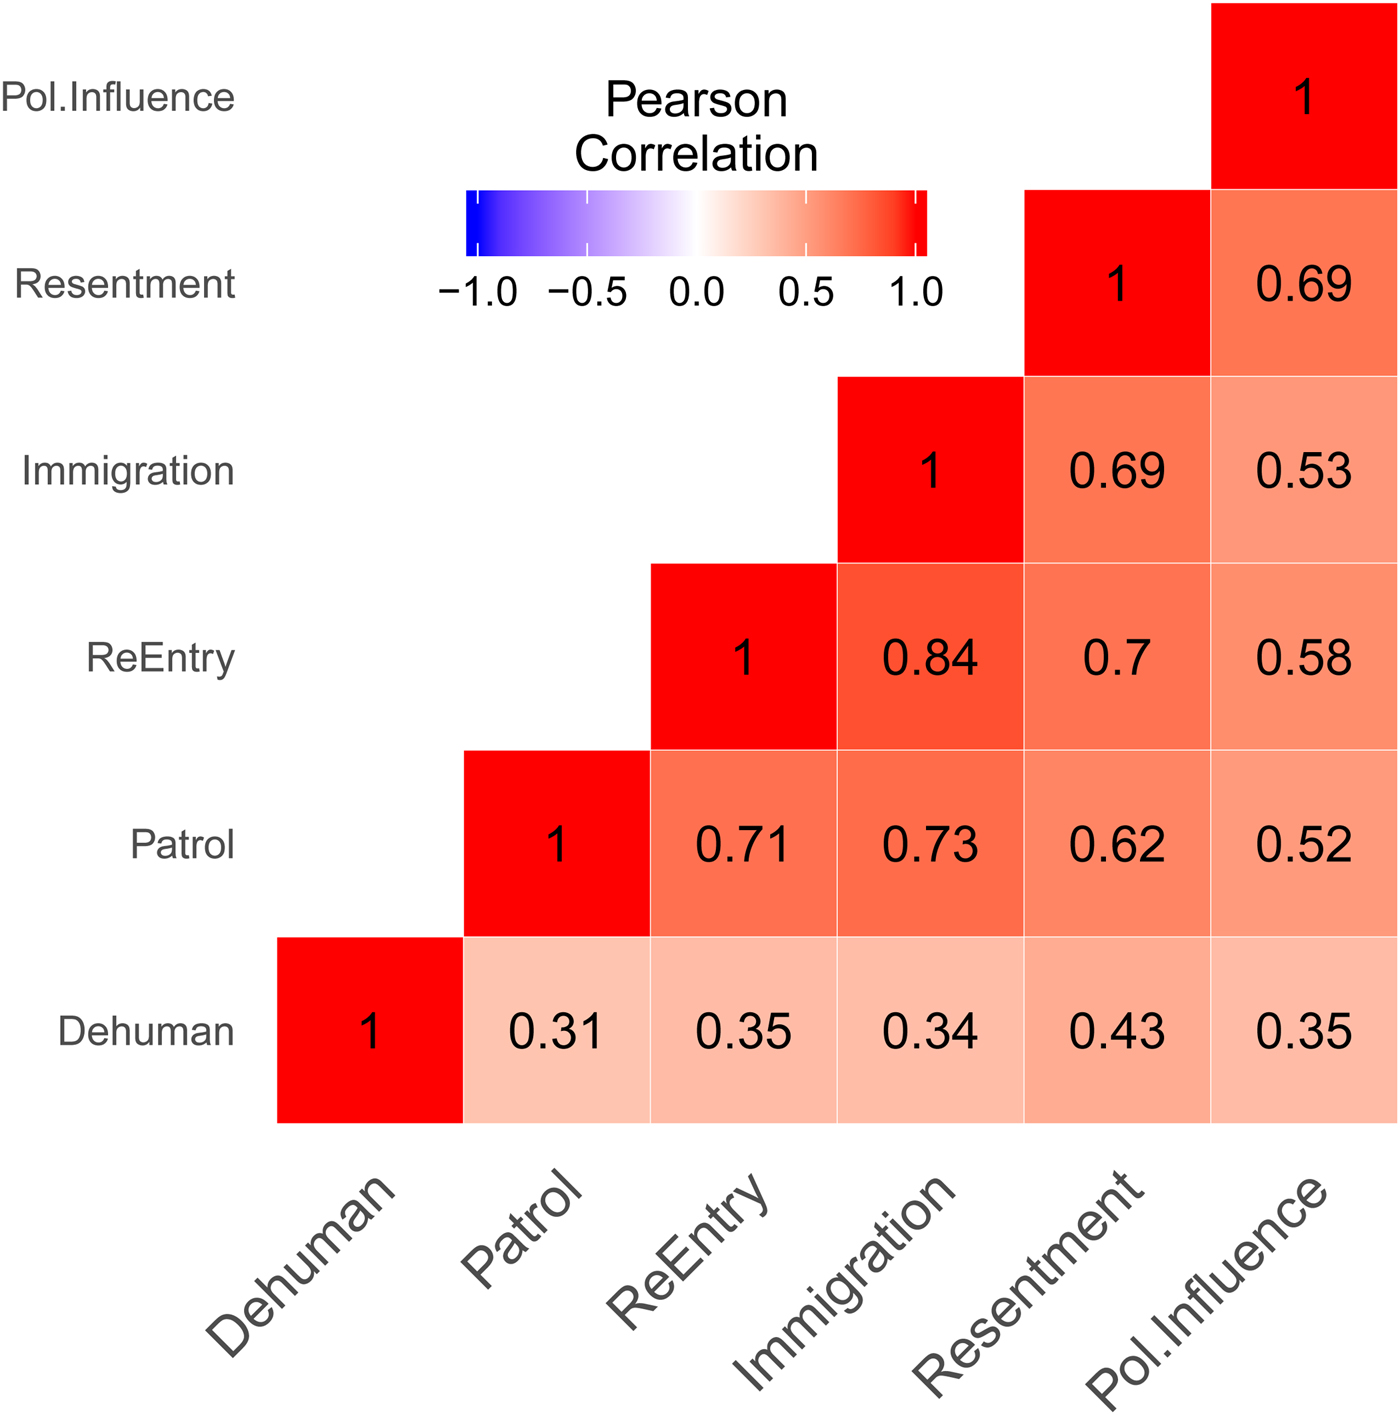
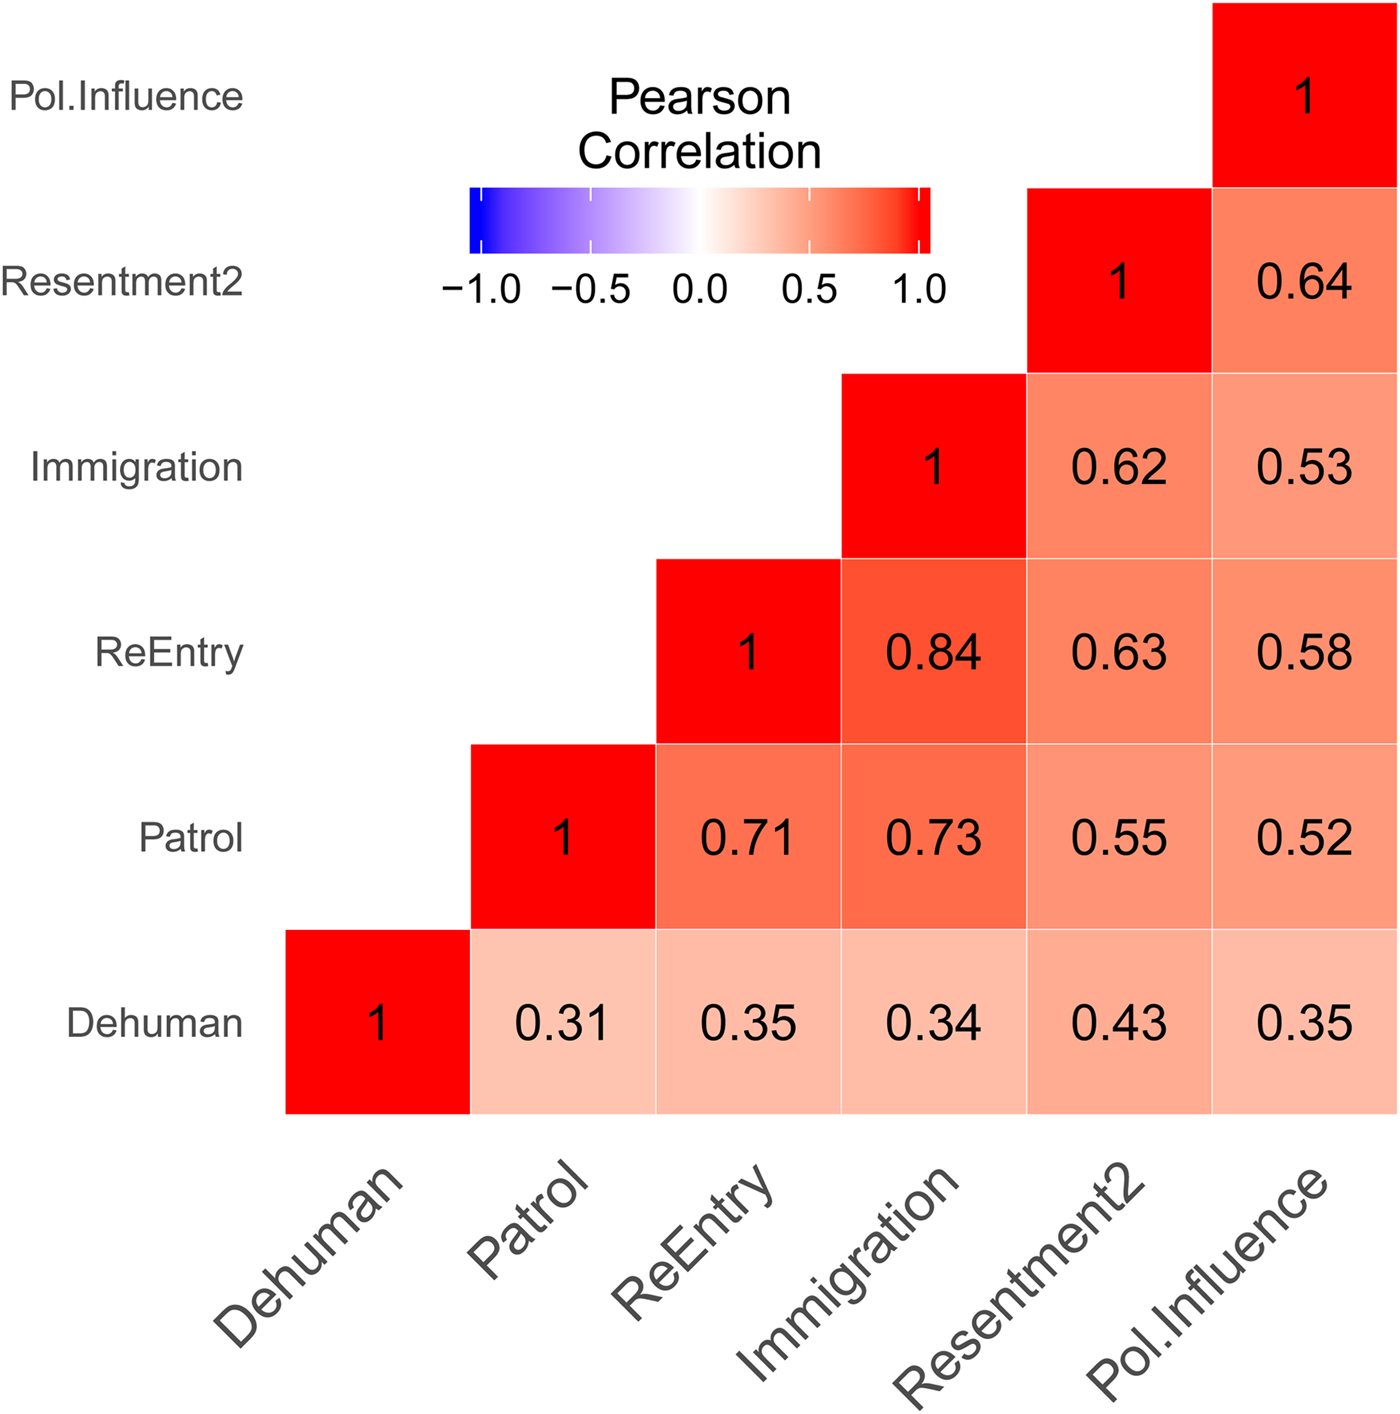
Pearson correlation matrix 1.

Pearson correlation matrix 2.