1 Introduction
Characterization of unsteady leading-edge vortex (LEV) dynamics associated with separation from bodies at high angles of attack has been a problem of scientific interest for decades. The importance of LEV formation (the hallmark of dynamic stall) in relation to force augmentation is well documented in the archival literature, often in the context of biological flight (Ellington et al. Reference Ellington, vandenBerg, Willmott and Thomas1996), the dynamics of highly manoeuvrable aircraft (Ol et al. Reference Ol, Altman, Eldredge, Garmann and Lian2010) and, more recently, energy conversion applications (Peng & Zhu Reference Peng and Zhu2009; Onoue et al. Reference Onoue, Song, Strom and Breuer2015; Ramesh, Murua & Gopalarathnam Reference Ramesh, Murua and Gopalarathnam2015).
A number of studies that imposed predefined wing kinematics to characterize the LEV formation have demonstrated that the behaviour of the separated flow structures is quite sensitive to variations in wing kinematics (Kim & Gharib Reference Kim and Gharib2010; Baik et al.
Reference Baik, Bernal, Granlund and Ol2012; Ozen & Rockwell Reference Ozen and Rockwell2012), pivot axis location (Granlund, Ol & Bernal Reference Granlund, Ol and Bernal2013; Yu & Bernal Reference Yu and Bernal2013), wing geometry (Yilmaz & Rockwell Reference Yilmaz and Rockwell2012; Hartloper & Rival Reference Hartloper and Rival2013) and Reynolds numbers (Jantzen et al.
Reference Jantzen, Taira, Granlund and Ol2014). For this reason, it poses an enormous challenge to find unifying scaling principles for the LEV formation time, strength and stability that can be generalized to arbitrary problems. One promising approach uses the so-called ‘universal vortex formation number’ (originally introduced by Gharib, Rambod & Shariff (Reference Gharib, Rambod and Shariff1998)), which can be extended to a wide variety of vortical flows; Dabiri (Reference Dabiri2009) defined the formation number based on the feeding shear-layer velocity and the characteristic length of the vortex generator. The premise of this universal vortex formation number is that the dimensionless dynamic formation time corresponding to the generation of a maximum-strength vortex remains constant at a value of approximately 4, at which time the vortex rejects additional entrainment of vorticity from the shear layer and pinches off. Measurements by Rival, Prangemeier & Tropea (Reference Rival, Prangemeier and Tropea2009) have demonstrated that the formulation of Dabiri (Reference Dabiri2009) provides a good scaling for the maximum LEV circulation generated by an aerofoil executing sinusoidal plunging motions. The use of feeding shear-layer velocity to scale LEV circulation seems to be a logical choice given that the vortex growth is dictated by the transport of circulation flux into the vortex core through the feeding shear layer, as suggested by Sattari et al. (Reference Sattari, Rival, Martinuzzi and Tropea2012). More recently, Kriegseis, Kinzel & Rival (Reference Kriegseis, Kinzel and Rival2013) measured the LEV circulation and unsteady forces acting on a flat plate undergoing accelerating plunging and towing motions at a fixed angle of attack. The authors have demonstrated that the LEV circulation and hydrodynamic forces can be effectively normalized by the characteristic shear-layer velocity,
 $U_{eff}=U_{\infty }+{\dot{h}}$
, where
 ${\dot{h}}$
designates the towing or plunging velocity. Buchholz, Green & Smits (Reference Buchholz, Green and Smits2011) have proposed an alternative scaling for the total spanwise circulation shed by a periodically pitching rectangular plate about its leading edge. This scaling parameter is formulated based on a dynamic pressure associated with the maximum transverse velocity of the trailing edge and the plate geometry. The authors have demonstrated that their scaling parameter can be used to satisfactorily collapse the vortex circulation data for different aspect ratios and pitching amplitudes. However, it still remains to be verified whether the aforementioned scaling relations are robust enough to collapse the LEV circulation histories, in both magnitude and time, throughout the entire vortex growth phase.
While these studies have used prescribed kinematics to generate LEVs, in real systems, the vortex structures are often a result of fluid–structure interactions, in which the structural dynamics of an elastically supported aerodynamic surface (e.g. a flat plate) are driven by the growth, evolution and shedding of strong LEVs. As discussed in Onoue et al. (Reference Onoue, Song, Strom and Breuer2015), such aeroelastic interactions often result in non-destructive limit-cycle oscillations (LCOs) with a nearly constant amplitude and frequency, which can potentially serve as the basis for the passive power generation. While previous studies on dynamic-stall flutter have provided a wealth of information with regard to the instability boundaries, local bifurcation behaviours and amplitude of LCOs with variations in flow speed and structural characteristics (Amandolese, Michelin & Choquel Reference Amandolese, Michelin and Choquel2013; Poirel & Mendes Reference Poirel and Mendes2014; Onoue et al. Reference Onoue, Song, Strom and Breuer2015), a direct connection between the large-amplitude oscillations and the vortical structures generated by the violent motion of the structure has not yet been made. Onoue et al. (Reference Onoue, Song, Strom and Breuer2015) measured the aerodynamic torque as a function of the plate motion, from which a plausible description of vortex formation, growth and separation can be inferred, but without measurements of the velocity field, it is impossible to develop robust aerodynamic models that allow us to characterize, and thus predict, the detailed behaviour of large-scale fluid–structure interactions (and positive energy harvesting).
The measurements and analyses presented in the current paper provide this valuable connection between the vortex dynamics and aerodynamic loads, and in this study we take advantage of the cyber-physical experimental set-up in conjunction with synchronized particle image velocimetry (PIV) to carry out a detailed study of the flow physics associated with a rapidly pitching plate in a uniform airflow. As described in Onoue et al. (Reference Onoue, Song, Strom and Breuer2015), the cyber-physical system is one in which the structural dynamics (torsional spring stiffness, damping and mass moment of inertia) are emulated using a digital controller rather than by physical hardware. By being able to directly control the structural properties of the system, the user can systematically tune the fluid–structure interaction parameters while completely isolating the effects of Reynolds number, and hence the pure fluid effects. The use of cyber-physical system was first demonstrated by Hover, Miller & Triantafyllou (Reference Hover, Miller and Triantafyllou1997), who successfully implemented a force-feedback algorithm to impose arbitrary structural forces in the study of vortex-induced vibration (VIV) of marine cables. In recent years, several cyber-physical systems have been successfully employed in VIV energy harvesting investigations (Lee & Bernitsas Reference Lee and Bernitsas2011; Mackowski & Williamson Reference Mackowski and Williamson2013). While all of these cyber-physical systems have been designed to be operated in water at relatively low frequencies, our cyber-physical system operates in air (where the plate inertia is more important), at higher frequencies and with much more violent structural motions (Onoue et al. Reference Onoue, Song, Strom and Breuer2015). In the present study, although the cyber-physical hardware is used to simulate a compliant structure, we do not explore the fluid–structure interaction directly, but rather use it as a tool to generate sinusoidal motion, tailoring the virtual stiffness and damping to achieve a desired pitching frequency and amplitude.
The primary objectives of the current study are two-fold: (1) to determine the scaling relation for the LEV formation time and circulation on a rapidly pitching flat plate, and (2) to elucidate the linkage between the LEV dynamics and the aerodynamic forces and moment that the flow imparts on the elastic structure.
2 Experimental techniques
Experiments were conducted in a closed-return wind tunnel with a test section of 0.6 m in width, 0.6 m in depth and 1.2 m in length. The turbulence level in the wind tunnel was previously measured to be less than 0.1 % of the free-stream velocity (Song et al.
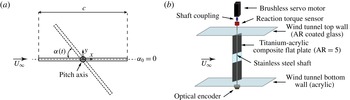
Reference Song, Tian, Israeli, Galvao, Bishop, Swartz and Breuer2008). Figure 1(a) illustrates a flat plate, with chord
 $c=0.1$
m, span
 $h=0.5$
m and thickness
 ${\it\delta}=1.5$
mm, free to rotate about its mid-chord in a uniform airflow of magnitude
 $U_{\infty }$
and density
 ${\it\rho}_{f}$
. In the present study, the Reynolds numbers based on the chord length,
 $Re=U_{\infty }c/{\it\nu}$
, were on the order of
 $O(10^{4})$
to
 $O(10^{5})$
, where
 ${\it\nu}$
is the kinematic viscosity of the fluid. Since the chord represented no more than 17 % of the test section width, blockage and sidewall boundary layer effects were deemed insignificant. To verify this, we examined the aerodynamic characteristics of the flat plates with two distinct chord lengths (
 $c=0.1$
and 0.15 m). First, the steady moment coefficient curves (normalized appropriately by the inertial forcing of the fluid, i.e.
 $0.5{\it\rho}U_{\infty }^{2}c^{2}h$
) revealed a remarkably good agreement over a wide range of incidence angles, as demonstrated in Onoue et al. (Reference Onoue, Song, Strom and Breuer2015). Secondly, we verified that the unsteady aerodynamic torque versus angular position phase trajectories agree very well upon matching the Reynolds number and the structural dynamics of the two systems. Based on these results, we conclude that any blockage effects have minor influence on the data reported in the current paper.
(a) Schematic of an oscillating flat plate with a pitch axis located at the mid-chord. The dashed horizontal line designates the equilibrium angle of attack,
 ${\it\alpha}_{0}=0$
. (b) A computer-controlled servo-motor rotates the shaft–plate assembly by applying a specific torque calculated via numerical simulation to achieve the desired structural dynamics. See Onoue et al. (Reference Onoue, Song, Strom and Breuer2015) for detailed descriptions of the cyber-physical system control algorithm.

Figure 1(b) shows a schematic of the experimental configuration used in the current study, illustrating the flat plate mounted to a virtual mass–spring–damper system in the wind tunnel test section. Instead of using a physical torsional spring and damper, the structural stiffness and damping characteristics of the pitching plate were controlled using a cyber-physical system that consists of a computer-controlled servo-motor (SM233AE, Parker Compumotor, Rohnert Park, CA), torque sensor (TFF400, Futek, Irvine, CA) and rotary encoder (HB6M Optical Encoder, US Digital, Vancouver, WA) coupled to a real-time digital controller operating in a feedback loop. The cyber-physical system also allows for the virtual modification of the structural mass moment of inertia. The digital control system (Simulink, Mathworks, Natick, MA) samples the angular position signal,
 ${\it\alpha}(t)$
, from the optical encoder at 4 kHz, and numerically calculates the velocity
 $\dot{{\it\alpha}}(t)$
and acceleration
 $\ddot{{\it\alpha}}(t)$
in real time via custom-designed finite impulse response differentiators with a linear-phase response in the passband. These signals are then multiplied by the user-specified stiffness
 $k_{v}$
, damping
 $b_{v}$
and mass moment of inertia
 $I_{v}$
coefficients, respectively, where the subscript
 $v$
denotes a virtual quantity. These signals are combined to determine the target motor torque,
 ${\it\tau}_{m}(t)=I_{v}\ddot{{\it\alpha}}(t)+b_{v}\dot{{\it\alpha}}(t)+k_{v}{\it\alpha}(t)$
, which is applied to the servo-motor. This torque is measured using the reaction torque sensor with a maximum measurement capacity of 7 N m. In postprocessing, the aerodynamic torque was determined from the equation of motion,
 ${\it\tau}_{f}(t)=I_{p}\ddot{{\it\alpha}}(t)+b_{p}\dot{{\it\alpha}}(t)+{\it\tau}_{m}(t)$
, where the subscript
 $p$
designates a physical quantity. Note that the physical component of the system does not possess a physical torsional spring (
 $k_{p}=0$
) and thus the effective stiffness is only due to the virtual spring provided by the cyber-physical system. A series of free-oscillation tests were conducted in air to deduce the value of the physical mass moment of inertia,
 $I_{p}$
, using the method of logarithmic decrement. These free-oscillation tests exhibit exponentially decaying amplitude such that the effect of Coulomb damping (or dry friction) can be neglected. Therefore, the physical damping can be simply modelled as a linear function of velocity,
 $b_{p}\dot{{\it\alpha}}(t)$
. The physical damping associated with the motor and bearing was determined by measuring the torque resulting from rotating the motor and shaft over a range of constant angular velocities, and fitting the linear regression line to the data. Finally, to evaluate the above equation for
 ${\it\tau}_{f}(t)$
, the position and torque signals were filtered by employing a zero-phase, sixth-order Butterworth low-pass filter with a cut-off frequency set to 10 times the pitching frequency. Second-order accurate finite differences were used to evaluate the angular velocity and acceleration during postprocessing. Hereinafter for simplicity, the effective torsional stiffness, damping and mass moment of inertia are denoted without any subscript, as
 $k$
,
 $b$
and
 $I$
, respectively.
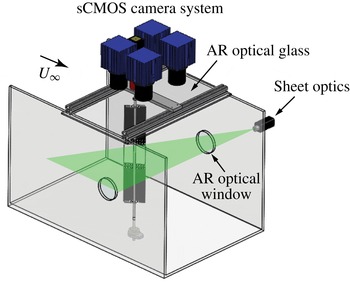
Experimental set-up for the PIV measurements in the streamwise plane at the mid-span location.

The set-up for the streamwise two-dimensional (2D) PIV experiment is illustrated in figure 2. All PIV measurements were acquired in a streamwise plane located at the mid-span of the plate. The laser sheet was generated using a double-pulsed 200 mJ Nd : YAG laser (
 ${\it\lambda}=532$
nm) (EverGreen, Quantel USA, MT) with LaVision sheet optics. The thickness of the laser sheet was approximately 3 mm. The flow was seeded with oil droplets nominally 1
 ${\rm\mu}$
m in diameter. The mid-span section of the plate is made out of clear anti-reflective acrylic, which enabled PIV measurements from both sides of the structure. The particle images were acquired with four synchronized sCMOS cameras (LaVision) equipped with 50 mm lenses (Nikon). Each camera has a resolution of 2560 pixels
 $\times$
2160 pixels and the frame rate for image acquisition was 15 Hz. Velocity fields were calculated using DaVis 8.1.6 software (LaVision) by applying a sequential spatial cross-correlation with multi-pass iterations with decreasing window size (
 $128\times 128$
, two iterations, 50 % overlap, to
 $32\times 32$
, two iterations, 50 % overlap). Velocity fields acquired by four different cameras were stitched together by averaging the overlapped regions, yielding a composite field of view of approximately 0.25 m
 $\times$
0.3 m containing over 63 000 vectors. For each PIV experiment, approximately 2500 composite image pairs were acquired, and subsequently allocated into 72 equally spaced phase bins over the oscillation cycle (
 ${\rm\Delta}{\it\phi}=5^{\circ }$
). The instantaneous phase was calculated by taking the Hilbert transform of the angular position time history (Khalak & Williamson Reference Khalak and Williamson1999).
In order to identify the vortical structures in the flow field, the vortex identification technique based on the vortex swirling strength was employed (Adrian, Christensen & Liu Reference Adrian, Christensen and Liu2000). The threshold was set to 10 % of the maximum swirling vortex strength to isolate the vortices of interest from the low-level background noise. This threshold was appropriate to exclude the vorticity confined in the feeding shear layer in the calculation of the primary vortex strength. The spanwise circulation of the primary vortex was calculated by integrating the simply connected vorticity patch about the vortex centroid using Stokes’ theorem. The results were insensitive to the threshold values in the range of
 $0.1\pm 0.05$
. Another local vortex identification method (Q-criterion) was also tested, and was found to yield similar results. In addition, the
 ${\it\Gamma}_{1}$
criterion (Graftieaux, Michard & Grosjean Reference Graftieaux, Michard and Grosjean2001) was employed to identify the location of the LEV centroid. In the present study, a threshold of
 ${\it\Gamma}_{1}\geqslant 0.9$
was selected, and the vortex centre is found where the maximum spatial value of
 ${\it\Gamma}_{1}$
is achieved. This vortex identification method has been successfully implemented by numerous investigators (e.g. Baik et al.
Reference Baik, Bernal, Granlund and Ol2012; Jantzen et al.
Reference Jantzen, Taira, Granlund and Ol2014).
3 Results and discussion
3.1 Phase-averaged swirl fields and
 ${\it\tau}_{f}$
versus
${\it\alpha}$
phase portrait


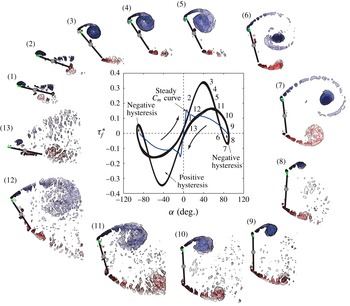
Snapshots of the phase-averaged swirl fields over a half-cycle and the corresponding aerodynamic torque
 ${\it\tau}_{f}^{\ast }$
versus angular position
 ${\it\alpha}$
phase portrait. Curved arrows indicate the orientation of the hysteresis trajectory. Regions of positive and negative hysteresis are shown. A positive hysteresis implies net positive energy exchange between the fluid and the plate, and a negative hysteresis describes the amount of energy transferred from the system to the wake. The steady moment coefficient,
 $C_{m}$
, is plotted with a blue curve. Here
 $Re=9.9\times 10^{4}$
; maximum pitching amplitude,
 ${\rm\Delta}{\it\alpha}=93$
°; and pitching frequency,
 $f=5.6$
Hz.

As mentioned earlier, the plate exhibits very large amplitude LCOs over a wide range of structural parameters, presumably driven by the development, growth and separation of LEVs. A representative sequence of phase-averaged swirl fields at several stages during the half-cycle are presented in figure 3, along with the associated torque versus angular position phase portrait. As the plate begins to rise from its equilibrium position,
 ${\it\alpha}_{0}=0$
(figure 3 (1)), the aerodynamic torque increases, but interestingly the dynamic torque is lower than that predicted by the steady moment coefficient curve (also shown in figure 3), as discussed by Onoue et al. (Reference Onoue, Song, Strom and Breuer2015). This is presumably due to the apparent generation of the vortices at the half-chord location as the boundary layer on the suction side of the plate separates from the rotating shaft (figure 3 (1)). This in turn generates a low-pressure region over the rear half of the plate, causing the centre of pressure to move further aft of the leading edge. Measurements over a wide range of conditions indicate that this effect is weaker at lower pitching frequencies, for which cases the aerodynamic torque angle trajectory falls closer to the statically measured
 $C_{m}({\it\alpha})$
curve. The torque offset at
 ${\it\alpha}=0$
can be attributed to the separated flow on the lower side of the plate at the end of the previous cycle, which creates a pressure gradient in favour of generating an aerodynamic torque in the direction of the wing rotation.
As the angle of attack increases, the aerodynamic torque continues to grow well beyond the static stall angle, finally reaching a maximum value nearly 2.5 times greater than its static counterpart (figure 3 (1)–(3)). This is a classic example of ‘dynamic stall’ wherein the force and torque on the plate are significantly augmented by the formation and growth of a strong LEV on the suction side of the plate (McCroskey Reference McCroskey1982). The LEV core continues to grow in size and strength as it entrains circulation of the small eddies generated at the leading edge. At the same time, a train of opposite-signed vortices is continuously shed from the trailing edge – a phenomenon that can be explained by the fact that the LEV circulation growth must be nearly equalized by the flux of opposite circulation shed from the trailing edge so that the total circulation is conserved (i.e. Kelvin’s circulation theorem). The formation of these discrete eddies has been commonly attributed to a Kelvin–Helmholtz-like instability inherent in the separated shear layer by numerous investigators (e.g. Baik et al. Reference Baik, Bernal, Granlund and Ol2012; DeVoria & Ringuette Reference DeVoria and Ringuette2012). The velocity shear arising from the high velocity of the impinging flow and the relatively low velocity of the separated free shear layer at the sharp edges promotes instability in the shear layer, and therefore leads to the generation of the small-scale eddies. Moreover, the shedding frequency associated with the small eddies is much higher than that of the primary vortices, which is comparable with the pitching frequency.
The aerodynamic torque attains a maximum at
 ${\it\alpha}\approx 40^{\circ }$
after which it immediately begins a precipitous decrease (figure 3 (4)). This torque decrement is not due to vortex leaving the plate, given that the attached LEV is evident at
 ${\it\alpha}\approx 63^{\circ }$
(figure 3 (5)). Rather, we hypothesize that the movement of the vortex core closer to the mid-chord point is responsible for the decrease in the aerodynamic torque. This hypothesis will be revisited in §§ 3.2 and 3.4. Despite this sharp drop in the aerodynamic torque, the plate continues to rotate (due to its inertia) until it comes to rest at a maximum pitch angle, in this particular case, approximately 90° to the free-stream direction. The shear layer from the trailing edge begins to roll up and forms a trailing-edge vortex (TEV) (figure 3 (6)–(7)). This roll-up of the shear layer is presumably due to a global instability of the wake which includes the influence of the LEV passing just overhead. It is worthwhile mentioning that this shear-layer roll-up is different from the classical bluff-body vortex shedding, in which the shear layers emanating from the sharp edges of the static plate roll up into vortices at a distance much further downstream of the plate (Fage & Johansen Reference Fage and Johansen1927); this is supported by a series of steady velocity measurements taken at various large incidence angles (see supplementary material available at http://dx.doi.org/10.1017/jfm.2016.134). Another robust feature associated with the dynamics of a strong LEV is the generation of small discrete eddies surrounding the isolated LEV core in the wake, as clearly portrayed in figure 3 (7). These small eddies emerge as the vortex filament decays as a result of the Kelvin–Helmholtz instability (Gustafson & Albert Reference Gustafson and Albert1991). Upon reaching a maximum angle of rotation, we observe a second increase in the aerodynamic torque due to the development of a secondary vortex in the close proximity of the leading edge (figure 3 (8)–(10)). This secondary vortex is analogous to that observed by Ringuette, Milano & Gharib (Reference Ringuette, Milano and Gharib2007), who examined the LEV formation on a flat plate undergoing a translating motion perpendicular to the incoming flow.
During the pitch reversal, a small region of negative hysteresis is observed due to the fact that the plate’s return motion is hampered by the counter-torque induced by the secondary vortex. For applications interested in energy harvesting, the negative hysteresis implies that the energy is being transferred from the system into the wake and represents a drop in harvesting efficiency. We also note that the secondary TEV develops as the shear layer emanating from the trailing edge curls up in the wake.
Finally, the elastic restoring torque of the torsional spring pulls the plate back to its equilibrium angle of attack,
 ${\it\alpha}_{0}=0$
(figure 3 (11)–(13)). Even at very small angle, the flow on the suction side of the plate does not completely reattach, and, as mentioned earlier, this results in a vertical pressure gradient across the plate that gives rise to a finite torque at zero angle of attack. By symmetry, the pattern repeats during the second half of the cycle.
3.2 Leading-edge vortex dynamics
In order to examine the effects of pitching frequency and amplitude on the ensuing LEV formation, let us consider four different cases of the reduced frequency. In this paper, the reduced frequency is defined as
 $f^{\ast }={\rm\pi}fc{\rm\Delta}{\it\alpha}/2U_{\infty }$
, where
 $f$
is the pitching frequency and
 ${\rm\Delta}{\it\alpha}$
is the maximum pitching amplitude in radians. Note that
 $c{\rm\Delta}{\it\alpha}/2$
represents the leading-edge excursion as the plate rotates from
 ${\it\alpha}_{0}$
to
 ${\it\alpha}_{max}$
, during which the LEV formation takes place. This amplitude-based reduced frequency describes the dynamic similarity between the leading-edge velocity,
 $fc{\rm\Delta}{\it\alpha}/2$
, and the characteristic flow velocity,
 $U_{\infty }$
, which resembles the inverse of the advance ratio parameter defined by Ellington (Reference Ellington1984). It is obvious that in order to precisely characterize the wing-tip velocity, one must consider both pitching frequency and stroke amplitude – something not reflected in the traditional formulation of the reduced frequency, i.e.
 ${\rm\pi}fc/U_{\infty }$
. As will be discussed later, the wing-tip velocity has an important implication on the evolution of the LEV, as it is intrinsically related to the feeding shear-layer velocity, which regulates the advection of circulation into the vortex core. The pitching frequency and amplitude were modulated by tailoring the torsional stiffness and damping characteristics of the structure. In each case, the time history of the angular position revealed a very strong sinusoidal character with a nearly constant amplitude and a well-defined frequency such that the sinusoidal regression curve with a 95 % confidence interval yielded an
 $R$
-squared value greater than 0.99. The Reynolds number was held constant at
 $9.9\times 10^{4}$
in all experiments.
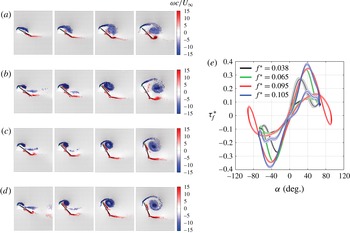
(a–d) Snapshots of the spanwise vorticity fields associated with various reduced frequencies
 $f^{\ast }$
at
 $Re=9.9\times 10^{4}$
: (a)
 $f^{\ast }=0.038$
,
 $f=2.98$
Hz,
 ${\rm\Delta}{\it\alpha}=69^{\circ }$
; (b)
 $f^{\ast }=0.065$
,
 $f=5.24$
Hz,
 ${\rm\Delta}{\it\alpha}=68^{\circ }$
; (c)
 $f^{\ast }=0.095$
,
 $f=5.57$
Hz,
 ${\rm\Delta}{\it\alpha}=93^{\circ }$
;(d)
 $f^{\ast }=0.105$
,
 $f=8.30$
Hz,
 ${\rm\Delta}{\it\alpha}=68^{\circ }$
. The vorticity is scaled by
 $c/U_{\infty }$
: negative, clockwise (blue); and positive, anticlockwise (red). (e) Corresponding aerodynamic torque
 ${\it\tau}_{f}^{\ast }$
versus angular position
 ${\it\alpha}$
phase portraits. Shaded regions represent the standard deviation over several oscillation cycles. All experiments are performed at
 $Re=9.9\times 10^{4}$
.

A strong dependence of the LEV circulation and the resulting forces on the reduced frequency (defined as
 ${\rm\pi}fc/U_{\infty }$
) has been well documented (Ol et al.
Reference Ol, Altman, Eldredge, Garmann and Lian2010; Baik et al.
Reference Baik, Bernal, Granlund and Ol2012; Granlund et al.
Reference Granlund, Ol and Bernal2013; Jantzen et al.
Reference Jantzen, Taira, Granlund and Ol2014). For example, Baik et al. (Reference Baik, Bernal, Granlund and Ol2012) and Jantzen et al. (Reference Jantzen, Taira, Granlund and Ol2014) concluded that the reduced frequency is the primary parameter governing the flow evolution and the unsteady force generation on a flat plate with sufficient forcing and large effective angle of attack. In contradiction to their findings, however, we found that the fluid behaviour becomes progressively more similar as
 $f^{\ast }$
increases, as can be inferred from figure 4(a–d). Moreover, the apparent self-similarity of the
 ${\it\tau}_{f}{-}{\it\alpha}$
phase trajectories for
 $f^{\ast }>0.07$
also reinforces this assertion (figure 4
e), which further implies that the reduced frequency is not a sufficient scaling parameter for the characterization of the LEV and the accompanying aerodynamic torque. However, a similarity in the torque trajectories does not necessarily entail a similarity in the force curves, partly because the latter is independent of the location of the centre of pressure. Owing to the fact that the pressure gradients acting on the plate account for a very large proportion of the resultant force, as noted by Albrecht et al. (Reference Albrecht, del Campo, Weier and Gerbeth2012), the force should scale with the suction pressure induced by the LEV and reach a maximum approximately when the LEV of maximal strength is shed from the plate, at which time the strongest suction is presumably generated; this hypothesis will be verified in § 3.4. Because the LEV circulation increases roughly with the pitching frequency, as will be seen in § 3.3, the force curves corresponding to
 $f^{\ast }>0.09$
may reveal distinct characters despite the qualitative similarity of the vorticity fields shown in figure 4(a–d). Interestingly, the measurements of Granlund et al. (Reference Granlund, Ol and Bernal2013) have shown that, for a flat plate executing a linear pitch-up manoeuvre from
 ${\it\alpha}=0^{\circ }$
to 90° with the rotational axis placed at
 $3c/4$
, the force coefficient curves become similar for reduced pitch rates, defined as
 $K=\dot{{\it\alpha}}c/2U_{\infty }$
, higher than 0.1. As discussed by the authors, this observation resonates with the unsteady aerofoil theory (Leishman Reference Leishman2000), which predicts that the effect of pitch rate on the lifting force becomes negligible if the pivot point is located at
 $3c/4$
.
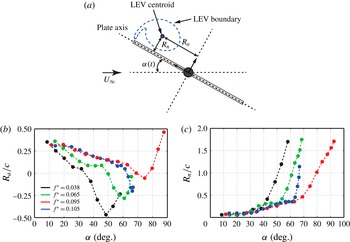
(a) Definition sketch of the vortex centroid with respect to the plate:
 $R_{a}$
is the axial distance between the LEV centroid and the pitch axis;
 $R_{n}$
is the shortest distance between the LEV centroid and the axis of the plate. (b) Evolution of
 $R_{a}$
as a function of angle of attack,
 ${\it\alpha}$
. Different colours represent different reduced frequencies: black,
 $f^{\ast }=0.038$
; green,
 $f^{\ast }=0.065$
; red,
 $f^{\ast }=0.095$
; and blue,
 $f^{\ast }=0.105$
. (c) Evolution of
 $R_{n}/c$
as a function of angle of attack. All experiments are performed at
 $Re=9.9\times 10^{4}$
.

To examine the details of the LEV dynamics, the spatial location of the LEV centroid was tracked using the vortex identification technique described in § 2. Figure 5(b) shows the evolution of the normalized axial distance,
 $R_{a}/c$
, as a function of the angle of attack (refer to figure 5
a for notation). For the lowest frequency case, the LEV centroid convects more than
 $c/2$
aft of the aerodynamic centre,
 $c/4$
, during the course of the vortex growth phase. Snapshots of the corresponding spanwise vorticity fields exhibit salient features of the separated flow worth noting – streamwise elongation of the vortex core and early separation of the LEV (figure 4
a). With increasing
 $f^{\ast }$
, one observes that the vortex core becomes tighter and the vortex separation is delayed to a higher angle of attack. This effect is clearly illustrated in the two highest frequency cases (figures 4
c,d and 5
b), in which very tight and strong LEV cores drift no more than
 $c/5$
aft of the aerodynamic centre until the vortices separate at approximately
 ${\it\alpha}\approx 60^{\circ }$
. This observation supports the notion that sufficient rotational acceleration (due to high pitching frequency) may contribute to the stability of LEVs on wings undergoing pitching manoeuvres; this hypothesis will be revisited in § 3.3. It is important to note here that the qualitative similarity in the vortex dynamics between these two cases (despite the large differences in
 $f$
and
 ${\rm\Delta}{\it\alpha}$
) suggests that the proposed scaling of the pitching frequency is appropriate for the present problem (figure 4
c,d). In addition, the velocity measurements over a range of operational conditions indicate that the LEV characteristics become quite similar when the variation in
 $f^{\ast }$
is small.
Figure 5(c) illustrates the evolution of the normalized distance between the LEV centroid and the plate axis,
 $R_{n}/c$
, as a function of the angle of attack. An approximate separation angle can be inferred from the figure where
 $R_{n}/c$
starts to increase rapidly as a result of the advection of the LEV into the wake. An important observation, introduced earlier, is that the aerodynamic torque starts to decrease well before the vortex separates from the plate (figure 4
a). In order to precisely explain this phenomenon, the relationship between the LEV formation and the accompanying aerodynamic torque will be examined in § 3.4 using a potential flow model.
3.3 Scaling of the leading-edge vortex growth
In order to determine the scaling for the LEV formation time and strength, we calculate the spanwise circulation of the LEVs for various pitching profiles. The experiments are performed over a wide range of reduced frequencies (
 $f^{\ast }=0.038{-}0.11$
), amplitudes (
 ${\rm\Delta}{\it\alpha}=42^{\circ }{-}100$
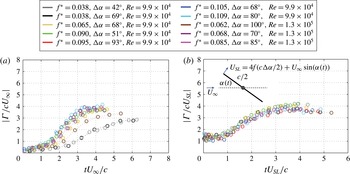
°) and at two different Reynolds numbers. Various LEV circulation histories are compared in figure 6(a), where the circulation and time are normalized using the free-stream velocity and chord. Here,
 $t=0$
corresponds to an instant when the plate starts to rise from the equilibrium angle,
 ${\it\alpha}=0$
. The circulation of the LEVs increases monotonically with the angle of attack and reaches a maximum approximately when the vortex lifts off from the plate surface. Subsequently the LEV circulation remains nearly constant as the vortex propagates downstream in the near wake. This is a manifestation of the fact that the circulation around a closed material contour moving with the fluid must remain constant with time (i.e. Kelvin’s circulation theorem). Large variations in magnitude and temporal evolution of the LEV circulation are clearly evident, in particular between the low- and high-frequency cases, suggesting that the free-stream velocity and chord are not sufficient scaling parameters to characterize the LEV growth under a variety of conditions.
Provided that the vortex growth is dictated by the transport of circulation flux into the vortex core through the feeding shear layer, as noted by Sattari et al. (Reference Sattari, Rival, Martinuzzi and Tropea2012), we explore the possibility of scaling the LEV growth rate and circulation using the characteristic feeding shear-layer velocity at the leading edge. As defined in figure 6(b), we approximate the feeding shear-layer velocity as the vector sum of the local velocity of the leading edge and the component of the free stream in the direction of the plate motion:
 $U_{SL}=4fc{\rm\Delta}{\it\alpha}/2+U_{\infty }\sin ({\it\alpha}(t))$
. By construction, this definition ensures that the feeding shear-layer velocity is approximately aligned with the orientation of the shear layer at the leading edge. Figure 6(b) reveals a good collapse of circulation histories. The efficacy of using the feeding shear-layer velocity as a scaling parameter for the LEV growth and strength has been recently demonstrated by Kriegseis et al. (Reference Kriegseis, Kinzel and Rival2013) for a rapidly accelerating flat plate undergoing plunging motions at a constant angle of attack. It is worthwhile to mention that the current non-dimensionalization of vortex circulation is analogous to how Dabiri (Reference Dabiri2009) defined the dimensionless optimal vortex formation number,
 $\hat{T}$
. The premise of a universal formation number is that, for a given vortex generator, the maximum vortex strength is achieved at
 $\hat{T}\approx 4$
when the vortex stops entraining additional circulation emanating from the shear layer. We further note that the values of
 $\max ({\it\Gamma}/cU_{SL})$
and corresponding dimensionless time,
 $tU_{SL}/c$
, are all within a narrow range of 3.5–4, conforming very well with the concept of universal vortex formation time (Gharib et al.
Reference Gharib, Rambod and Shariff1998; Dabiri & Gharib Reference Dabiri and Gharib2005; Milano & Gharib Reference Milano and Gharib2005; Ringuette et al.
Reference Ringuette, Milano and Gharib2007). Because this scaling yields an approximately constant circulation value with variations in pitching amplitude, frequency and Reynolds number, it provides a useful bound for predicting the angle of attack, for a given pitching frequency and flow velocity, at which an LEV of maximum circulation is generated. This offers useful insights as to how we can tailor the plate kinematics in order to prolong the LEV residence time, and to leverage the dynamic stall phenomenon to its fullest advantage.
Temporal evolution of the LEV circulation for various motion profiles at two different Reynolds numbers. The circulation and time are scaled with (a) the free-stream velocity
 $U_{\infty }$
and (b) the feeding shear-layer velocity
 $U_{SL}$
.

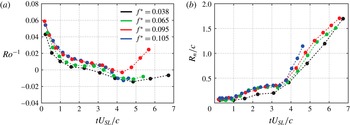
(a) The vortex axial position
 $R_{a}$
, presented in figure 5(b), replotted as the inverse of the Rossby number
 $Ro^{-1}$
as a function of the dimensionless time,
 $tU_{SL}/c$
. (b) The evolution of the normal distance
 $R_{n}/c$
of the vortex core,
 $R_{n}$
, shown in figure 5(c), as a function of the dimensionless time.

We can use the Rossby number,
 $Ro$
, which compares the centrifugal fluid acceleration to Coriolis acceleration, to characterize the correlation between rotational accelerations and the stability of the LEV dynamics, in particular with regard to the axial movement of the LEV core discussed in § 3.2. While the Rossby number is used extensively to characterize the LEV stability on a rotating wing (see e.g. Lentink & Dickinson Reference Lentink and Dickinson2009), its application to a purely pitching wing has not been reported in the literature. Here we propose a formulation of the Rossby number, specifically tailored for the present problem, based on the feeding shear-layer velocity and the axial location of the LEV core relative to the rotational axis:
 $Ro=U_{SL}/R_{a}\,f{\rm\Delta}{\it\alpha}$
. Note that, for
 $Ro\gg 1$
, the centrifugal force dominates over the Coriolis force. To assess the validity of this scaling, the vortex axial position,
 $R_{a}$
, presented in figure 5(b) is replotted in figure 7(a), this time as the inverse of the Rossby number versus the dimensionless time,
 $tU_{SL}/c$
. We see that all cases collapse throughout the vortex formation phase prior to the separation,
 $tU_{SL}/c<3.5$
, suggesting that the stability of the LEV is dictated, at least in part, by the centrifugal force acting on the vortex as it rotates with the plate. If we similarly plot the normal distance of the vortex,
 $R_{n}$
(figure 5
c), as a function of the dimensionless time (figure 7
b), we see that the time of the vortex separation (designated by the cusps in the curves) always occurs at a value of approximately
 $tU_{SL}/c\approx 3.5$
. This result resonates particularly well with the fact that the occurrence of vortex separation approximately coincides with the attainment of maximum vortex circulation, as discussed earlier.
3.4 Potential flow model
To clarify the connection between the free vortex evolution and the resulting aerodynamic torque on the plate, a potential flow model with the addition of external vortices (LEV and TEV) is employed in this section. There have been several attempts at formulating analytical vortex models to characterize the unsteady aerodynamics of a flat plate, some of which have proven to be quite successful in capturing the overall qualitative behaviour of the separated flow structures and the associated aerodynamic force profiles in relation to the unsteady motion of the wing (Wang & Eldredge Reference Wang and Eldredge2013; Xia & Mohseni Reference Xia and Mohseni2013). However, quantitative agreement often remains elusive, in particular at large angles of attack when the LEV dominates the flow field. The inadequacy of these purely analytic models can be attributed in part to the somewhat ad hoc enforcement of the Kutta condition at the leading edge in order to estimate the magnitude of the developing vortex. In fact, viscous effects are expected to play a role in dictating the LEV growth as the vortex core experiences significant interaction with the opposite-signed vorticity layer on the plate surface (figure 4 a), thereby rendering the Kutta condition an unreliable criterion for predicting the LEV strength (Hemati, Eldredge & Speyer Reference Hemati, Eldredge and Speyer2014). However, a promising approach to overcome this issue is to consider a semi-empirical inviscid formulation that makes use of relevant experimental data, as demonstrated by Minotti (Reference Minotti2002) and Pitt-Ford & Babinsky (Reference Pitt-Ford and Babinsky2013).
Here, we present a slightly different approach, and with a different goal. We assume that the total aerodynamic moment on the plate can be modelled as a linear combination of the moment due to the steady flow and the moment due to the presence of the LEV and TEV that are generated by the unsteady motion. All of the effects of the unsteady pitching are thus contained within the strength and location of the LEV and TEV, and since we have shown these to obey a uniform scaling over a wide range of pitching amplitudes and frequencies (figures 6 and 7), we use them as inputs to a potential flow model to estimate the contributions of the free vortices to the net aerodynamic torque on the plate.
To estimate the contribution of the LEV and TEV, we start with the complex potential function, which can be conveniently derived using the Joukowski transformation, i.e.
 $z={\it\zeta}+a^{2}/{\it\zeta}$
, so that the flat plate of chord
 $c$
in the physical
 $z$
plane is mapped from a circle of radius
 $a=c/4$
in the virtual
 ${\it\zeta}$
plane (Batchelor Reference Batchelor2000). The Cartesian frame is defined with the
 $x$
axis oriented along the plate’s chord and the origin located at the mid-chord point. By applying the circle theorem (Milne-Thomson Reference Milne-Thomson1968), an expression for the complex potential that models a flat plate in the presence of an LEV of strength
 ${\it\Gamma}_{LEV}$
, located at
 ${\it\zeta}_{LEV}$
, and a TEV of strength
 ${\it\Gamma}_{TEV}$
, located at
 ${\it\zeta}_{TEV}$
, is given by
 $$\begin{eqnarray}\displaystyle w({\it\zeta})=\frac{{\it\Gamma}_{LEV}}{2{\rm\pi}\text{i}}\ln \left(\frac{{\it\zeta}-{\it\zeta}_{LEV}}{{\it\zeta}-a^{2}/{\it\zeta}_{LEV}^{\ast }}\right)+\frac{{\it\Gamma}_{TEV}}{2{\rm\pi}\text{i}}\ln \left(\frac{{\it\zeta}-{\it\zeta}_{TEV}}{{\it\zeta}-a^{2}/{\it\zeta}_{TEV}^{\ast }}\right)+\frac{{\it\Gamma}_{0}}{2{\rm\pi}\text{i}}\ln ({\it\zeta}), & & \displaystyle\end{eqnarray}$$
where values for
 ${\it\Gamma}_{LEV}$
,
 ${\it\zeta}_{LEV}$
,
 ${\it\Gamma}_{TEV}$
and
 ${\it\zeta}_{TEV}$
are determined experimentally. In order to satisfy the no-penetration condition on the plate surface, image vortices with circulations
 $-{\it\Gamma}_{LEV}$
and
 $-{\it\Gamma}_{TEV}$
are placed at the inverse square points
 $a^{2}/{\it\zeta}_{LEV}^{\ast }$
and
 $a^{2}/{\it\zeta}_{TEV}^{\ast }$
, respectively, where
 $\ast$
denotes complex conjugate. The circulation
 ${\it\Gamma}_{0}$
is placed at the centre of a circle in order to maintain a stagnation point at the trailing edge, whose value is determined by imposing the condition
 $\text{d}w/\text{d}{\it\zeta}|_{{\it\zeta}=a}=0$
.
The terms representing the contributions due to the pitching velocity,
 $\dot{{\it\alpha}}$
, and acceleration,
 $\ddot{{\it\alpha}}$
, are missing from this formulation. The acceleration term, which accounts for the ‘virtual mass’ of fluid accelerated by the plate, can be easily shown to be negligible in the current experiments, which use air as the working fluid. The term proportional to
 $\dot{{\it\alpha}}$
is deliberately excluded in this formulation because the effects of the pitch rate are already accounted for by the circulation in the growing LEV and TEV. Lastly, it should be noted that the term to regularize the flow at the rear edge,
 ${\it\Gamma}_{0}$
, is not related to the bound circulation of the flat plate in a uniform stream that is associated with potential flow models of aerodynamic flows (e.g. Pitt-Ford & Babinsky Reference Pitt-Ford and Babinsky2013; Wang & Eldredge Reference Wang and Eldredge2013). In this case, the potential flow model is constructed without a mean flow and serves only to evaluate the forces experienced by the plate due to the free vortices with their prescribed strength and position.
With this formulation for the velocity potential, the aerodynamic force (per unit span) can be evaluated using the Blasius formula:
 $F_{x}-\text{i}F_{y}=(\text{i}{\it\rho}_{f}/2)\oint _{C}(\text{d}w/\text{d}z)^{2}\,\text{d}z$
(Batchelor Reference Batchelor2000). The contour integration can be performed using the Cauchy residue theorem, which yields an explicit expression for the quasi-steady force imparted on the plate by the external vortices:
 $$\begin{eqnarray}\displaystyle F_{x}-\text{i}F_{y} & = & \displaystyle \text{i}{\it\rho}_{f}{\it\Gamma}_{LEV}\left\{\frac{{\it\zeta}_{LEV}^{2}}{{\it\zeta}_{LEV}^{2}-a^{2}}\left(\frac{{\it\Gamma}_{LEV}}{2{\rm\pi}\text{i}({\it\zeta}_{LEV}-a^{2}/{\it\zeta}_{LEV}^{\ast })}-\frac{{\it\Gamma}_{TEV}}{2{\rm\pi}\text{i}({\it\zeta}_{LEV}-{\it\zeta}_{TEV})}\right.\right.\nonumber\\ \displaystyle & & \displaystyle +\!\left.\left.\frac{{\it\Gamma}_{TEV}}{2{\rm\pi}\text{i}({\it\zeta}_{LEV}-a^{2}/{\it\zeta}_{TEV}^{\ast })}-\frac{{\it\Gamma}_{0}}{2{\rm\pi}\text{i}{\it\zeta}_{LEV}}\right)+\frac{{\it\Gamma}_{LEV}}{2{\rm\pi}\text{i}}\frac{{\it\zeta}_{LEV}a^{2}}{({\it\zeta}_{LEV}^{2}-a^{2})^{2}}\right\}\nonumber\\ \displaystyle & & \displaystyle +~\text{i}{\it\rho}_{f}{\it\Gamma}_{TEV}\left\{\frac{{\it\zeta}_{TEV}^{2}}{{\it\zeta}_{TEV}^{2}-a^{2}}\left(\frac{{\it\Gamma}_{TEV}}{2{\rm\pi}\text{i}({\it\zeta}_{TEV}-a^{2}/{\it\zeta}_{TEV}^{\ast })}-\frac{{\it\Gamma}_{LEV}}{2{\rm\pi}\text{i}({\it\zeta}_{TEV}-{\it\zeta}_{LEV})}\right.\right.\nonumber\\ \displaystyle & & \displaystyle +\!\left.\left.\frac{{\it\Gamma}_{LEV}}{2{\rm\pi}\text{i}({\it\zeta}_{TEV}-a^{2}/{\it\zeta}_{LEV}^{\ast })}-\frac{{\it\Gamma}_{0}}{2{\rm\pi}\text{i}{\it\zeta}_{TEV}}\right)+\frac{{\it\Gamma}_{TEV}}{2{\rm\pi}\text{i}}\frac{{\it\zeta}_{TEV}a^{2}}{({\it\zeta}_{TEV}^{2}-a^{2})^{2}}\right\},\end{eqnarray}$$
where
 $F_{y}$
represents the resultant (normal) force and the corresponding lift and drag are
 $F_{y}\cos ({\it\alpha})$
and
 $F_{y}\sin ({\it\alpha})$
, respectively. It is worthwhile to mention that the last term in each of the curly brackets captures what is known as Routh’s correction (Clements Reference Clements1973), which rectifies the velocity discrepancy between the mapping and physical planes at the location of the point vortex.
Bernoulli’s equation is used to calculate the pressure distribution around the circle in the
 ${\it\zeta}$
plane, which is subsequently integrated to determine the centre of pressure. The corresponding location on the flat plate in the physical
 $z$
plane is obtained via conformal mapping and the aerodynamic torque imparted by the vortex pair is determined by taking the product of the resultant force and the distance between the centre of pressure and the pitch axis.
The previous analysis provides only the contribution to the aerodynamic torque due to the free vortices shed from the leading and trailing edges during the plate’s unsteady motion. In addition to this, we must consider the steady torque associated with the free-stream flow, which includes the large-scale steady separation, pressure accumulation on the front surface and viscous stress induced by the free-stream velocity. This additional torque is obtained directly from measurements of the static torque experienced by the plate in a uniform flow at fixed angles of attack,
 ${\it\alpha}$
. These values were taken from previous measurements (Onoue et al.
Reference Onoue, Song, Strom and Breuer2015) and it is important to note that the measured steady moment of the flat plate at a fixed angle is indeed ‘steady’, and that the accompanying formation and shedding of von Kármán vortices does not result in a time-dependent pitching moment, presumably because the formation of these vortices takes place in the far-wake region (approximately 1.5–2 chord lengths downstream of the pitch axis) owing to the short convective time scale associated with the present configuration, i.e.
 $c/U_{\infty }\sim O(10^{-3})$
s. The net aerodynamic torque is evaluated as the sum of the vortex torque deduced from the potential flow model and the steady moment of the flat plate (see supplementary material).
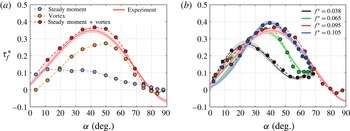
(a) A comparison of the aerodynamic torque
 ${\it\tau}_{f}^{\ast }$
predicted by the potential flow model with the experimental measurement for the case
 $f^{\ast }=0.095$
shown in figures 4–6. Contributions from the vortex torque and the steady moment are plotted separately. (b) Validation of the proposed model over a range of reduced frequencies (
 $f^{\ast }=0.038{-}0.11$
): predictions (solid circles) and experiments (solid curves).

To evaluate the accuracy of this estimation of the aerodynamic torque, we first consider a representative case (corresponding to
 $f^{\ast }=0.095$
in figures 4–6) and examine how the vortex intensity and stability contribute to the generation of the aerodynamic torque on the plate. The combination of the steady flow moment with the contribution from the LEV and TEV provided by the quasi-steady potential flow model compares remarkably well with the experimental measurement, as illustrated in figure 8(a). At large angles of attack, a significant portion of the aerodynamic torque is generated due to the presence of a strong LEV in close proximity to the plate. The precipitous decrease in the aerodynamic torque prior to the vortex separation is attributed to the movement of the LEV core on the plate, which in turn brings the centre of pressure closer to the rotational axis. The current analysis suggests that the contribution of the TEV on the aerodynamic loads is relatively small (less than 15 % of the maximum aerodynamic load imparted on the plate) due to the fact that its circulation is no more than 50 % of the maximum LEV circulation and that the TEV formation takes place exclusively in the wake. However, it should be noted that the inclusion of the TEV in the potential flow model does yield a better estimation of the centre of pressure, and hence improves the accuracy of the model at large angles of attack. When the LEV is very weak or has not yet developed at small angles (typically less than 15°), the steady moment constitutes the dominant portion of the net aerodynamic torque acting on the plate.
In order to verify the validity of the model over a wide variety of flow conditions, figure 8(b) compares the aerodynamic torque predicted by the model with the experimental measurements corresponding to four sets of data described in § 3.2. It can be seen that the net aerodynamic torque estimated using our formulation agrees extremely well with the empirical data across a range of reduced frequencies, suggesting that the superposition of the potential flow model (which estimates the torque induced exclusively by the external vortices) and the steady moment of the flat plate captures the essential features of the flow physics associated with the large-scale oscillations. The significance of the present result lies in the fact that it validates the use of a quasi-steady formulation to characterize the unsteady aerodynamics of the flat plate undergoing large-scale oscillations. The 2D representation of the vortex exploited in the model is justified presumably because the flow topology of the separated flow structure is largely 2D, which is partly ensured in this study by the use of a high-aspect-ratio rectangular plate. We believe that the current model offers an appealing framework to help us not only elucidate a direct connection between the large-amplitude oscillations and the properties of the accompanying large-scale vortical structures, but also aid in the development of a low-order point vortex model for the characterization of the unsteady aerodynamics of a wing.
4 Concluding remarks
By taking advantage of the cyber-physical experimental set-up and synchronized PIV, we systematically investigated the formation time and strength of LEVs generated on a rapidly pitching plate. In this paper, we formulated an alternative definition of the reduced frequency parameter based on the leading-edge excursion during the pitch-up manoeuvre. The velocity measurements over a wide variety of flow conditions suggest that the global behaviour of the separated flow structures is strongly controlled by the reduced frequency parameter. However, it was shown that the reduced frequency alone is not a sufficient scaling parameter to characterize the LEV evolution across a myriad of flow conditions.
We demonstrated that the LEV formation time and circulation scale with the characteristic velocity of the feeding shear layer over a range of reduced frequencies (0.038–0.11) and pitching amplitudes (42°–100°) at distinct Reynolds numbers. A connection between this scaling and the concept of universal vortex formation time was discussed, and we demonstrated that the scaled LEV circulation and vortex formation time peak within a narrow band of 3.5–4, revealing an excellent agreement with the previous results reported by Gharib et al. (Reference Gharib, Rambod and Shariff1998) and others. In addition, a new formulation of the Rossby number was introduced in the present study to elucidate the linkage between the LEV stability and rotational accelerations on a purely pitching wing. We demonstrated that the axial movement of the LEV core during the vortex formation process can be mitigated, at least in part, by the strong centrifugal force arising from large rotational acceleration. Large rotational acceleration can thus contribute to the augmentation of the aerodynamic torque by keeping the LEV (and hence centre of pressure) away from the axis of rotation.
To establish the linkage between the dynamics of the separated flow structures and the resulting aerodynamic torque acting on the flat plate, we formulated a simple potential flow model with which we can estimate the forces and torques associated with the LEV and TEV. We emphasize that this is not a complete aerodynamic model, but must be combined with a measurement (or computation) of the torque experienced by a steady plate at an angle of incidence in order to obtain the full aerodynamic torque experienced during the pitching cycle. Nevertheless, this model reproduced the measured aerodynamic torque remarkably well over a wide range of frequencies. Most importantly, we demonstrated that the precipitous decrease in the aerodynamic torque occurs before the point of LEV separation or the attainment of maximum vortex circulation due to the movement of the vortex core (or centre of pressure) towards the rotational axis.
In order to gain a deeper understanding of the LEV dynamics, an assessment of three-dimensional effects will be conducted in the future. On a different level, we will attempt to optimize the plate kinematics with the aim of prolonging the LEV residence time and augmenting the vortex strength by implementing appropriate structural nonlinearities and exploring the effects of pivot location.
Acknowledgement
This research is funded by the Air Force Office for Scientific Research (AFOSR) grant no. FA9550-12-1-0099, monitored by Dr D. Smith.
Supplementary material
Supplementary material is available at http://dx.doi.org/10.1017/jfm.2016.134.