INTRODUCTION
Large portions of the population of developing countries suffer from micronutrient malnutrition; some 30% of all children less than five years of age present with symptoms of such malnutrition, as do a significant percentage of pregnant and nursing women (WHO, 2008). This type of malnutrition results from the insufficient intake of vitamins and minerals (iron, iodine, zinc, etc.). Vitamin A deficiency (VAD), in particular, is a health problem in many developing countries. More than 130 million pre-school children suffer from this deficiency (Meenakshi et al., Reference Meenakshi, Johnson, Manyong, de Groote, Javelosa, Yanggen, Naher, Gonzalez, Garcia and Meng2010), which increases the prevalence and severity of infectious diseases (morbidity and mortality) and may cause severe eye problems, including permanent blindness. In addition, VAD results in high costs for the health system and the economy as a whole (Qaim et al., Reference Qaim, Stein and Meenakshi2007). Various strategies have been used to try to alleviate these nutritional deficiencies; efforts have included nutritional education, supplementation, public programmes and industrial fortification (Baltussen et al., Reference Baltussen, Knai and Sharan2004). As an additional and complementary measure, biofortification (a newly developed breeding technique to increase the micronutrient content of staple crops) can be used in conjunction with these strategies (www.haverplus.org). In introducing biofortified crops in to vulnerable populations, rural areas are especially targeted due to the high levels of home production and consumption of staple food crops in such communities. The programme is working with three micronutrients and seven staple crops around the developing world. The selected crops and communities for this programme were chosen based on previous research findings of diet and consumption patterns. Furthermore, ex ante evaluations of the cost-effectiveness of biofortification were undertaken in a range of countries throughout Latin America, Asia and Africa. These evaluations indicated that, in the majority of cases, the positive outcomes of using biofortification justify investment in its development and diffusion (Gonzalez et al., Reference Gonzalez, Kruze, Sequiera, Fukuda, Olivera and Johnson2005; Meenakshi et al., Reference Meenakshi, Johnson, Manyong, de Groote, Javelosa, Yanggen, Naher, Gonzalez, Garcia and Meng2010). The majority of nutritionally enhanced crops are still in the research pipeline; only a few have been released. Amongst these crops are four varieties of cassava (Manihot esculenta), with enriched levels of beta-carotene (or provitamin A), which were released in the northeast of Brazil.
Cassava is a staple with worldwide distribution and serves as a fundamental energy source for the poor; more than 700 million people obtain at least 500 kilocalories per day from cassava consumption (FAO, 2004). Amongst the advantages of cassava is that it grows well in marginal soils and is capable of resisting diseases, drought and pests (Carneiro, Reference Carneiro, Souza, Farias, Mattos and Goncalves2006). Additionally, cassava roots are very rich in carbohydrates in the form of starch; hence their caloric contribution is considerable. Depending on the particular variety's levels of cyanogens, cassava may be used for direct consumption or alternatively may be processed for industrial purposes. Cassava also contains high levels of vitamins C, B2 and B6, but the levels of provitamin A are extremely low. Researchers are attempting to increase this level from zero to 15–16 μg per g of fresh weight. Popular local cassava varieties are generally white.
At the end of 2006 a team from Embrapa, the Brazilian Agricultural Research Corporation, supported by the HarvestPlus Program and the International Center for Tropical Agriculture (CIAT), released the first set of varieties with increased micronutrient content. These included four yellow cassava varieties with improved levels of provitamin A: BRS Dourada, BRS Gema de Ovo, Amarelo I and Amarelo II (Fukuda et al., Reference Fukuda, Souza, Fukuda, Santos, Borromeu, Silva, Coreolano, Pinho and Santos2008). The provitamin A levels in the new yellow cassava varieties varied between levels of 4 and 12 μg. Other criteria were also taken into account in selection of varieties: productivity, levels of starch and tolerance to pest and diseases. Although the target level of biofortification has still not been reached, the diffusion process of these varieties has nonetheless begun. This is seen as an important trial to inform future diffusion strategies for planned variety releases, with a view to increasing their adoption levels.
At the completion of some cultivation cycles of the provitamin A enhanced cassava (between 2006 and 2009), researchers undertook an evaluation of the producers’ experiences with the cultivars. Two broad strategy types were used in the diffusion process: (1) a participatory research approach with farmers and (2) public awareness raising activities, such as an official launch event and Embrapa's webpage. Few conclusions have been drawn about the success or failure of these strategies. In order to address this gap and hence support future nutritional cassava dissemination processes, this paper attempts to evaluate the results of the two diffusion strategies. The aim is to identify the initial difficulties experienced by famers and to establish factors that could be determinants in the success of future farmer adoption processes.
DATA AND METHODOLOGY
The analysis of the diffusion strategies was undertaken in relation to the producers’ targets for each strategy as outlined above. Two comprehensive surveys were carried out in northeast Brazil, the first with producers involved in the participatory research process (Group 1 – a population of 760 farmers) and the second with producers who requested stakes (seeds) following the launch event (Group 2).
A structured interview to collect data from Group 1 was conducted from August to December 2009 in northeast Brazil. Based on a random sampling of Group 1, 359 farmers were surveyed: 108 in the state of Bahia, 69 in Ceará, 52 in Maranhão and 130 in Pernambuco. Group 2 was similarly surveyed between January and March 2009. Firstly, an inventory was created comprising the 158 farmers who had requested seeds of the new varieties (via telephone, fax or visits to the research station) from Embrapa's Cassava and Tropical Fruits programme. Subsequently a group of 40 producers was randomly selected from the inventory list.
For Group 1, in addition to descriptive analysis, a logit model was implemented in data analysis, using a dichotomous dependent variable of the potential adoption rate (whether or not producers would continue planting the new cassava varieties based on their experiences). This variable provided an indication of the success of the transfer process. The survey structure and number of observation varied from Group 1 to Group 2, and for this reason an alternate methodology – multiple correspondence analysis (MCA) – was used in the analysis. This approach is very useful for exploring and categorizing data sets without imposing any pre-determined relationships between the variables. The method reduces the number of variables and detects the relationships among levels of the variables (Lebart et al., Reference Lebart, Morineau and Warwick1984).
RESULTS
Characteristics of the sample
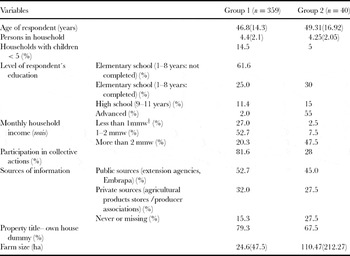
In Group 1 most producers were older than 30 years old (84%), 62% had not finished elementary school and only 2% had achieved an advanced level of education. The percentages of households with children below the age of five, pregnant women or nursing women were relatively small (14.5%, 2% and 6% respectively). These three groups were considered the most susceptible to problems related to vitamin A and other micronutrient deficiencies. Hence, it was hypothesized that communities with small percentages of such vulnerable groups might be less likely to adopt the biofortified varieties. Most producers in the survey (53%) were defined as small farmers (<10 ha). A total of 80% of the farms were producer-owned properties, 4% were leased and 2.5% were rented. No correlation was found between the size of the properties and the monthly income level of the families; 53% stated they had a monthly family income between once and twice the minimum wage, while 27% had a total family income below the minimum wage. (In 2008, the minimum wage in Brazil was R.465 (US$230)). The majority (some 82%) belonged to some kind of farmer association or labour union. The main sources of information on crop management for 53% of farmers were extension agencies and Embrapa. Agricultural stores and producers associations were important channels of communication for 32% of the population in the study (see Table 1).
Household socioeconomic characteristics Groups 1 and 2.

†mmw: minimum monthly wage.
In general, Group 2 participants exhibited some important differences from those in Group 1; for instance, they typically had higher levels of both education and income. Only 28% reported participating in collective action and they used the Internet as a source of information. However, the two groups also had similarities: for example, both comprised small producers (approximately 60% of the sample had less than 10 ha); however, in group 2 there were seven producers with more than 300 ha, hence the average farm size (Table 1) was considered large.
The new yellow varieties of cassava with better nutritional quality
For both groups, cassava was found to be the main crop farmed, followed by beans, fruits, maize, rice and squash. Cassava consumption was also recorded as high: some 54% of cassava produced was for self-consumption while only 14–15% was intended for the market. Two or three cassava varieties were available per producer; white varieties, in general, were preferred by farmers. Nonetheless, in Group 2 an important percentage of farmers preferred a variety of yellow cassava (28%). In the case of Group 1, approximately 70% of the sample was familiar with the cassava varieties being evaluated and some 15% declared having planted them during 2007 – only a year after their release. This percentage is considered a reasonable early adoption rate, considering that there was no large-scale seed distribution process besides that undertaken on the varietal release field day. In this case, ‘early adoption rate’ was defined as: producers planting the new varieties after the first harvest.
Farmers were asked if, based on their experiences with the new yellow cassava varieties and their involvement in the diffusion strategy, they intended to plant the new cassava varieties the subsequent year, or at least to increase the plantation area. The findings of previous research indicate that responses to such a question usually prove consistent with the subsequent adoption patterns (Wünscher et al., Reference Wünscher, Schultze-Kraft, Peters and Rivas2004). That is, in this case, the responses to the question were expected to provide an accurate indication of the producers’ disposition toward continuing the cultivation of the new varieties at the same scale (or at a larger scale than the previous cropping cycle) and, hence, the basis for determining potential adoption rates of these varieties.
A total of 223 farmers responded in the affirmative to the question of whether they intended to plant the new varieties, indicating a potential adoption rate (calculated based on participants’ stated intent) of 62% of the sample group. The main reasons for adopting the new varieties were: nutritional content (90%), family preference for their flavour (7%) and acceptance in the market (3%). The reasons given for not adopting the new varieties were: not knowing how to obtain the seed (43%), dislike of the taste (27%), lack of tradition in the region for planting yellow cassava varieties (21%) and low productivity compared to traditional varieties in combination with low resistance to diseases (10%).
For Group 2, results were a little different: many producers remembered having received seed of the two varieties (75%) from Embrapa, and 62.5% planted the seeds in 2007. The reasons given for not planting generally related to a lack of seed availability and adaptability of the new varieties to the region. Additionally, some producers (37%) professed to have given away their new variety stakes to neighbours and friends. A small number of producers (17.5%) used the new cassava varieties for purposes other than direct consumption, such as cassava flour (farinha) and starch production. There was not, however, a consistent response as to whether improved yellow varieties were appropriate for producing these sub-products in comparison to the varieties that they normally used. The main reasons for replanting yellow varieties were: a high level of acceptance by family members (40%) and their improved nutritional value (26%).
Improved yellow varieties versus conventional varieties
The Group 1 survey provided information on producers’ perceptions of new varieties’ characteristics in comparison to those of conventional varieties (as traditionally cultivated in the area). The lack of response to this question was high, indicating that most farmers did not have a strong perception of the new varieties vis-à-vis the traditional types.
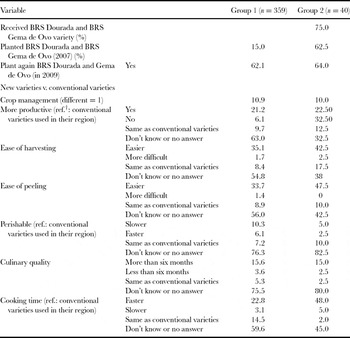
The survey included farmers’ perceptions of the differences and similarities of improved yellow varieties in contrast with conventional varieties (Table 2). A high percentage of producers did not answer these questions or responded that they did not know what the secondary qualities of the new varieties were. A possible explanation for this situation was that the new varieties had not been grown for sufficient time in the region for farmers to gain a clear understanding of their possible advantages and disadvantages. Nonetheless, two results did stand out: close to 35% and 34% of producers noted that improved yellow varieties were, respectively: easier to harvest and easier to peel. Most producers considered that, aside from these qualities, crop management of the new varieties was very similar to that of conventional varieties. Only in a small number of cases did producers note some differences including that the new varieties were less drought resistant and required additional inputs, such as fertilizer. A small percentage of farmers (6%) stated that the productivity of improved yellow varieties was lower than that of conventional varieties. Among the comments supportive of uptake were two characteristics were highlighted – that the new varieties had a ‘beautiful’ colour, and that they were of good culinary quality. On a final note, in the adoption process of a new variety, market issues are frequently determinants of farmers’ uptake (CIMMYT, 1993; Elizondo et al., Reference Elizondo, Hernández and Araya2004). For this reason information about commercial use of the new type was elicited by the survey. Responses showed that the percentage of farmer interviewed who had marketed the new varieties was insignificant.
Production of BRS Dourada and BRS Gema de Ovo in Groups 1 and 2.

†ref.: reference.
The survey results of Group 2 were very similar to Group 1; however, the former group displayed a slight preference for the crop management characteristics of the new varieties. The exception to this trend was the perceptions about productivity: in Group 2; some 32% considered that improved yellow varieties were less productive than conventional varieties.
Characteristics of adopters and non-adopters of new yellow cassava varieties
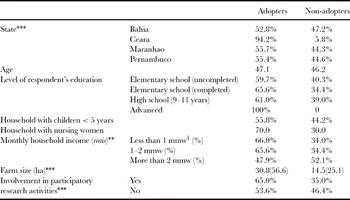
The socioeconomic characteristics were used in order to identify the difference between potential adopters and non-adopters in Group 1. As shown in Table 3, the difference in location is statistically significant; Ceara and Bahia are the states with the highest proportion of potential adopters while Maranhao and Pernambuco are those with the lowest proportion. This could be explained because the latter states had greater problems with the seed distribution, and additionally due to climatic difficulties in Maranhao. Likewise, low income producers are significantly represented in the adopter group. It is hypothesized that this may be due to the challenges they face in satisfying their families’ nutritional requirements. The target population for Group 1 comprised producers involved in the participatory research process; however, 15% of the sample deserted mid-process.
Socio-economic characteristics of potential producers, adopters and non-adopters of nutritionally enhanced cassava varieties (Group 1; n = 359).

**, *** statistically significant at 0.05 and 0.01 level, respectively.
†mmw: minimum monthly wage.
Another significant difference between adopter and non-adopter groups was the average size of participants’ farms. Large-scale producers are typically non-adopters, possibly because they are less concerned about nutritional issues; their priorities relate to higher yields. Groups do not differ significantly in relation to characteristics such as: age, levels of education and numbers of children and pregnant women.
Analysis of Group 1: farmers involved in the participatory research
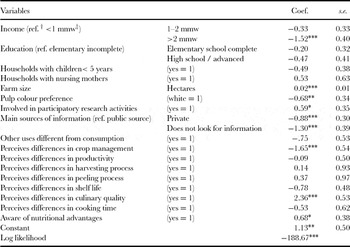
An objective of this part was to estimate the probability of a farmer adopting the new cassava varieties, based on their experiences in the participatory research. The model included a total of 20 independent variables; some variables were collated to reduce the overall number and hence facilitate the analysis process. All variables were categorical, except for the farm size variable, which was quantitative. Table 4 shows results of the regression of the binary logistic model and demonstrates that statistically significant factors included: income, farm size, preferences for white cassava varieties, sources of information, perception differences in crop management, culinary quality, required cooking time and awareness of nutritional advantages. Producers with low income levels were found to have more probability of adopting the new varieties, while producers who preferred the white flesh cassava tended not to adopt these. The latter result is not surprising given the yellow colour of the new varieties.
Results of the binary regression model

†ref.: reference. ‡mmw: minimum monthly wage.
n = 354; *,**,*** Statistically significant at the 0.10, 0.05 and 0,01 level, respectively.
Variables related to the diffusion process that increased the probability of adoption included: involvement in participatory research, knowledge about the nutritional advantages of new cassava varieties and access to information from a public source (i.e. Embrapa). This indicates that the strategies used, at least in Group 1, were effective. It appears that lack of seeds was the main constraint to greater adoption. This was also the main explanation identified for why many variables related to the cassava management characteristic were not statistically significant. The only variables of significance were perceptions of differences in crop management between new and conventional varieties and the perceptions of culinary quality.
The probability of a farmer adopting these new varieties was estimated using the regression coefficients. For example, a farmer had a 66% probability of adopting the new varieties if he/she had the following characteristics: a sum family income lower than one minimum monthly wage; a household including children below the age of five; a preference for white pulp cassava; involvement in participatory research; access to information from a public source (i.e. an extension agency or Embrapa); no established perception of the productive qualities of the new varieties (i.e. their management, productivity, shelf life, taste, cooking time, ease of peeling and nutritional advantages) and lacking information on the nutritional advantages of the new varieties. A farmer with the same set of characteristics and aware of the nutritional advantages of improved yellow varieties had a 79% probability of adopting the new varieties. This suggested that there were three factors key to increasing adoption probability rate: receiving information mainly from public entities (extension agencies or Embrapa), involvement in participatory research endeavours and awareness of the nutritional advantages of the new varieties. The probability of any farmer adopting without positive answers to these three variables is less than 18%.
Analysis of Group 2
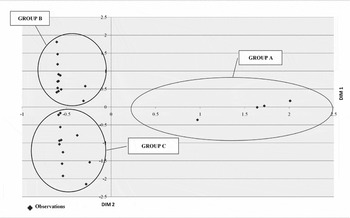
The main results of the analysis of Group 2 are summarized in Figure 1. The 40 points in this graph represent the farmers interviewed; the ten descriptive variables with the highest discriminatory power are then used to classify these farmers. The discriminatory power is related to the heterogeneity of the answers, this means that variables excluded are because the answers are very similar (homogeneous). The variables were (in order of the most to least significant): (a) whether the participant had a perception of the productivity of new cassava varieties vis-à-vis that of the conventional varieties, (b) whether the participant was a seed donor, (c) whether the participant had a perception of the ‘quality characteristics 1’ (i.e. ease of harvesting and ease of peeling), (d) whether the participant had a perception of the ‘quality characteristics 2’ (cooking time, perishability and culinary quality), (e) participant disposition toward replanting the new cassava varieties, (f) whether the participant had perceptions of differences in crop management, (g) whether the participant planted the new improved yellow varieties in 2007 and (h) whether the participant had received the seed of improved yellow varieties. Although the MCA simplifies the discriminatory power of all the variables into two dimensions, some of the variables have more discriminatory power in one dimension than in the other. Such a distinction serves to describe the dimensions. For instance the variable ‘whether the participant was a seed donor’ explains the dispersion along dimension 1.
Groups of cassava producers.

Based on these results, three groups were identified. Group A (n = 8), is located in the right section of Figure 1. This group was composed mostly of producers who did not answer the questions, did not receive the seeds from Embrapa or did not plant the improved fortified yellow cassava varieties. Group B, is located in the upper-left of Figure 1. This group was made up of producers (n = 17) who received, planted, intend to plant again and, furthermore, redistributed the seed of the improved yellow cassava varieties. Most of those within this group perceived the characteristics of these two new varieties to be better than those of conventional ones. For Group B, improved yellow varieties were seen to be more productive than conventional varieties. Group C (n = 15), is located in the bottom left of Figure 1. This group comprises producers who were unlikely to plant the improved yellow varieties again, who considered that the qualities of the new and conventional varieties of cassava to be the same or who were unable to distinguish which of the new and conventional was the more productive cassava variety.
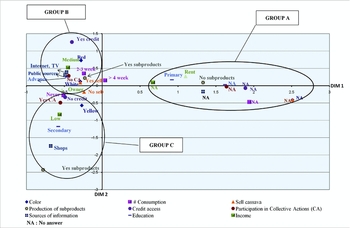
Additionally, the groups resulting from this analysis were associated with individual characteristics such as: education, income, number of persons in household, source of information, access to credit and cassava consumption per week. The MCA reveals the relative differences and similarities between the groups (Figure 2): points located furthest from the centre indicate a characteristic unique to that type of group. This does not imply that the groups were only defined by these characteristics, but rather that those specific attributes were not present in the other groups. In contrast, location of a point close to one of the 0–0 axes indicates that the characteristic pertained to more than one group. The main attributes of Group A were that they: did not answer all questions (i.e. ticked NA), had only an elementary level of schooling and live in rented properties. Group B comprised producers who had: ownership of their land; medium income, access to credit, and advanced level of education; and access to information overwhelmingly via public organizations (Embrapa) and the Internet. Finally, Group C consisted of producers with a high school-level of education, a lower frequency of cassava consumption, involvement in collective actions and who largely accessed information from agricultural products stores. This group was linked to a preference for yellow cassava. This result was unexpected given that this group has fewer producers who adopted the improved yellow varieties, in comparison to Group B. This finding indicates that the lower adoption rates of the new varieties within Group C cannot be explained by preference for colour.
(Colour online at journals.cambridge.org/EAG) Characterization of the groups.

DISCUSSION
A significant finding was the large gap between actual early adoption rates of Group 1 (62.5%) and Group 2 (15.0%) in comparison with the potential adoption rates of the groups (62.1% and 64% respectively). This difference in early adoption rate for Group 2, compared to Group 1 could be explained, in great part, by the lack of availability of seeds of the new varieties. Amongst producers involved in the participatory research process, factors with the greatest positive influence on adoption probability were: being aware of the advantages of the new varieties, having public entities (extension agencies and Embrapa) as their main information sources and involvement in participatory research.
Findings from other studies have highlighted the positive effect both access to information and the provision of strong extension programmes have on increasing the rate of adoption (Wünscher et al., Reference Wünscher, Schultze-Kraft, Peters and Rivas2004). Unfortunately, at the time of the study, perceptions of the new varieties’ productive characteristics were not yet formed. Nonetheless, responses overall favoured the nutritionally improved yellow cassava varieties. Producers especially highlighted that these varieties were easier to harvest and to peel. Information could not be collected on the economic benefits to farmers of adopting the improved cassava varieties, nor of the commercialization potential of their produce. The percentage of producers who marketed the new varieties was very low, with most production going toward family consumption. The lack of seed was one of the main factors limiting the adoption of improved yellow cassava varieties.
Results showed that several strategies used for diffusion might be successful, each with its own advantages and disadvantages. For instance, participatory research was seen to reach the target population (i.e. vulnerable households with high level of poverty and malnutrition). Studies have demonstrated the success of this approach for transferring scientific findings into application by farmers. To achieve this transference, it is necessary to firstly facilitate community (i.e. the producers) consensus on the project's legitimacy, hence generating a sense of ownership and commitment to application (Bruges and Smith, Reference Bruges and Smith2008). A limiting factor for using the participatory research approach is its high cost relative to other strategies, in addition to its typically slow process. In contrast, diffusion of information via launch events, TV and Internet are cheaper approaches, but they typically result in information principally reaching farmers with higher levels of income and education (and hence access to these information sources)Footnote 1.
Recommendations for improving adoption levels of the new cassava varieties include: developing a strategy for seed production and distribution, improving the amount and quality of the information supplied to farmers, continuing the use of conventional information channels (extension agencies and Embrapa), recognizing producer associations and agricultural products stores as key sources of information for most farmers, and increasing the dissemination of information on the nutritional qualities of the new yellow cassava varieties. This final recommendation is regarded as key to increasing the level of new variety adoption – especially in view of the current strong preference for white pulp cassava varieties. Although this study has not demonstrated this preference to be a current decisive factor, the findings of other research indicate it might prove limiting in the future, given that farmer adoption of biofortified crops is largely driven by consumer acceptance (Heyd, Reference Heyd2007).
CONCLUSIONS
The study evaluates the diffusion strategies amongst target population of new yellow cassava with improved nutritional qualities. The objective of the paper was to assess what methodology most successfully saw adoption of the nutritionally enhanced crops in these target communities and what perspectives they have on them. Hence, we have only used the sample of households that participated in the intervention. Nonetheless, for future evaluations, it would be useful to additionally include non-participants within the group assessed for the purpose of identifying any ‘spillovers’ (cases where other households gained access to seeds and also cultivated these).
While this research is focused on early stages of adoption of the new cassava varieties (and hence more time is required to obtain more conclusive results), some lessons can nonetheless be drawn. These include that awareness of the nutritional advantages of new varieties is a strong determinant in the success of the adoption process (especially where groups comprise high levels of the target populations) and that promoting participatory research activities increases the adoption and socialization of projects among producers. The lack of seed availability has been the main factor limiting the adoption of the new cassava varieties. The recommendation stemming from this latter point is that seed production and distribution systems should be improved. Simultaneously, however, it is important to continue exploring other low-cost diffusion strategies such as agricultural products stores, Web pages and launch events. Such channels have potential for very effectively communicating key messages, although they need to be complemented with field work given that many poor producers typically do not have access to these information sources.
The overarching recommendation is that future studies about cost-effectiveness should be undertaken, in combination with the development of an impact evaluation of different diffusion strategies for providing information, so as to facilitate future decisions about the diffusion programmes.