Conspiracy beliefs generally denote unnecessary assumptions that explicate events in terms of secret plots by groups who use covert manipulation to achieve malevolent goals (Aaronovitch, Reference Aaronovitch2009; Denovan et al., Reference Denovan, Dagnall, Drinkwater, Parker and Neave2020). Recent reviews (Nera et al., Reference Nera, Bertin and Klein2022) and empirical studies (Nera et al., Reference Nera, Wagner-Egger, Bertin, Douglas and Klein2021; Wood & Gray, Reference Wood and Gray2019) suggest that, instead of reflecting objective power imbalances, conspiracy beliefs constitute opportunistic attributions of power that allow individuals to advance their interests—so they can be anti-establishment (upward) or pro-establishment (downward). Conspiracy beliefs typically arise when an official explanation is perceived as inadequate or competing accounts exist (Dagnall et al., Reference Dagnall, Denovan, Drinkwater, Parker and Clough2017; Drinkwater et al., Reference Drinkwater, Dagnall, Denovan and Walsh2021). This is especially true, when highly salient antagonistic outgroups proffer compelling alternatives that contradict, and/or seek to discredit prevailing authority generated narratives (Imhoff & Bruder, Reference Imhoff and Bruder2014; van Prooijen, Reference van Prooijen2020). Throughout time, there have been numerous distressful social events (e.g., terrorist attacks or pandemics) that have heightened conspiracy ideation among the population—notable examples being the assassination of John F. Kennedy (McHoskey, Reference McHoskey1995) and the 9/11 terrorist attacks (Drinkwater et al., Reference Drinkwater, Dagnall and Parker2012; Swami et al., Reference Swami, Chamorro-Premuzic and Furnham2010).
Conspiracy beliefs tend to foster disconnection between the general population and governments. This can concomitantly facilitate the appearance of radical political movements (Escolà-Gascón, Reference Escolà-Gascón2020; van Prooijen et al., Reference van Prooijen, Krouwel and Pollet2015; Wood & Gray, Reference Wood and Gray2019). Conspiracism can also express as science denial and manifest as anti-scientific forms of populism, which focus on issues such as climate change, vaccination, AIDS, and genetically modified organisms (e.g., Jolley & Douglas, Reference Jolley and Douglas2014; Nattrass, Reference Nattrass2013; Uscinski et al., Reference Uscinski, Douglas, Lewandowsky and von Storch2017). Besides this socio-political dimension, conspiracy beliefs constitute a well-researched psychological construct, with a robust nomological network (for a systematic review see Goreis & Voracek, Reference Goreis and Voracek2019).
In this article, we validate the Spanish version of the Generic Conspiracist Beliefs Scale (GCBS; Brotherton et al., Reference Brotherton, French and Pickering2013). Accordingly, we describe the translation process (English to Spanish) and assess the psychometric properties of adapted measure. Specifically, we used Confirmatory Factor Analysis (CFA) to test the internal structure of the Spanish adaptation. Then we assessed its invariance in relation to two English samples. Finally, convergent validity was evaluated using educational level, need for uniqueness, and four social axioms (social cynicism, reward for application, religiosity, and fate control).
The Generic Conspiracist Beliefs Scale
Brotherton and his collaborators developed the GCBS, which, in contrast to most conspiracy belief assessing instruments (e.g., Abalakina-Paap et al., Reference Abalakina-Paap, Stephan, Craig and Gregory1999; Swami et al., Reference Swami, Chamorro-Premuzic and Furnham2010; van Prooijen et al., Reference van Prooijen, Krouwel and Pollet2015), focuses on overarching thematic categories without reference to specific conspiracy beliefs. The advantage of this approach is that it avoids event-related bias arising from factors such as familiarity, perspectives, and attributions of causation. Previous analyses have revealed strong positive correlations between the GCBS and other conspiracy measures. Additionally, studies consistently support the existence of 5-factors comprising government malfeasance, extraterrestrial cover-up, malevolent global conspiracies, personal well-being, and control of information (Brotherton et al., Reference Brotherton, French and Pickering2013; Drinkwater et al., Reference Drinkwater, Dagnall, Denovan and Neave2020). Total scores provide a valid global measure of conspiracy beliefs (e.g., Fasce, Avendaño, et al., Reference Fasce, Adrián-Ventura, Lewandowsky and van der Linden2021; Fasce, Adrián-Ventura, et al., Reference Fasce, Adrián-Ventura, Lewandowsky and van der Linden2021; van der Tempel & Alcock, Reference van der Tempel and Alcock2015).
The GCBS has become the most widely used measure of the construct (Goreis & Voracek, Reference Goreis and Voracek2019). The instrument has been subjected to iterative psychometric assessment among the general population and adapted to several language areas (e.g., Atari et al., Reference Atari, Afhami and Swami2019; Majima & Nakamura, Reference Majima and Nakamura2019). On January 31, 2022, we conducted multiple searches using the main databases of academic publications in behavioral sciences (i.e., Web of Science, Scopus, PsycINFO, and Google Scholar) using English and Spanish search strings. No articles were found on the psychometric properties of a scale to measure conspiracy beliefs using samples of Spanish speakers. Consequently, this article constitutes the first validation of a scale to measure the construct among the Spanish-speaking population.
As the world’s second-most spoken native language, being nationally or regionally official in 24 countries from 3 continents, the geographical and cultural distribution of the Spanish language is recognized as one of the most diverse on the planet. This language area includes liberal democracies and authoritarian governments (both far-left and far-right), indigenous populations and other minority ethnic groups, as well as megacities with high levels of inequality and isolated rural areas with technological limitations, thus being an area of great interest for the study of conspiracy beliefs. A Spanish version of the GCBS will also facilitate a more comprehensive study of conspiracy beliefs in the U.S. context, where 41 million people (13% of the total population) are native Spanish speakers. In addition to studying the specific characteristics of conspiracy beliefs in the Spanish-speaking context (e.g., their local contents, communities, and correlates), it would be of interest to replicate studies conducted in other cultural contexts—for example, on the relationship between conspiracy beliefs and collective narcissism (Golec de Zavala et al., Reference Golec de Zavala, Bierwiaczonek and Ciesielski2022), unhealthy behaviors (Soveri et al., Reference Soveri, Karlsson, Antfolk, Lindfelt and Lewandowsky2021), and science denial (Lewandowsky et al., Reference Lewandowsky, Cook and Lloyd2018).
Method
Translation of the Items
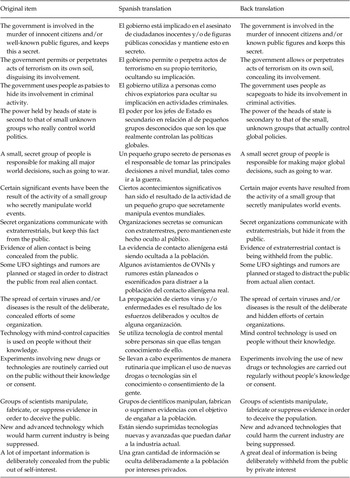
The GCBS was translated from English to Spanish by two native speakers of Spanish with a high level of English proficiency, and then compared by a third researcher assisting as a referee. Since the original items did not include context-dependent expressions or events, their contents were extrapolated to the Spanish-speaking context without introducing any substantial change in the wording. The three translators (two from Spain and one from Peru) agreed that the translations are fully understandable by any Spanish speaker, regardless of their dialect. Subsequently, for purposes of cross-validation, two native English speakers with a high level of Spanish proficiency back-translated the items to English (Table 1). Despite slight grammatical differences, all back translations were consistent with the original version of the scale.
Back Translation of the Generic Conspiracist Beliefs Scale.

Sample and Measures
Participants were invited to fill the set of scales through forums and groups on Facebook and Twitter. No rewards were offered in exchange for their collaboration. As previous research has highlighted the existing relationship between political ideology and conspiracy beliefs, we strived to obtain an adequate level of political heterogeneity. For this, throughout the data gathering process we selected the new groups in which to share the questionnaire based on the descriptive statistics of the Political Orientation variable (assessed through a 10-point Likert scale; 1 = far-left, 10 = far-right; M = 2.28, SD = 0.90), to focus on areas of the political spectrum that were underrepresented—as a result, participants’ Political Orientation exhibited variability and normal distribution (skewness = 1.05, kurtosis = 1.04).
A final sample of 732 Spanish-speaking participants from Spain and Latin America was obtained. The sample size is adequate in relation to the planned analyses, which are sensitive to effects of r = .10 and R2 = .011, with 80% power (α = .05). Regarding confirmatory factor analysis, the ratio of the number of participants to the number of measured variables is above the usual rules of thumb (48.88; Wang & Wang, Reference Wang and Wang2012). 591 (81%) participants stem from Spain and 141 (19%) from Latin American countries, with an average age of 40.38 (SD: 12.25); 390 (53%) were women and 342 (47%) were men; 158 (22%) had pre-university education and 574 (78%) had university education.
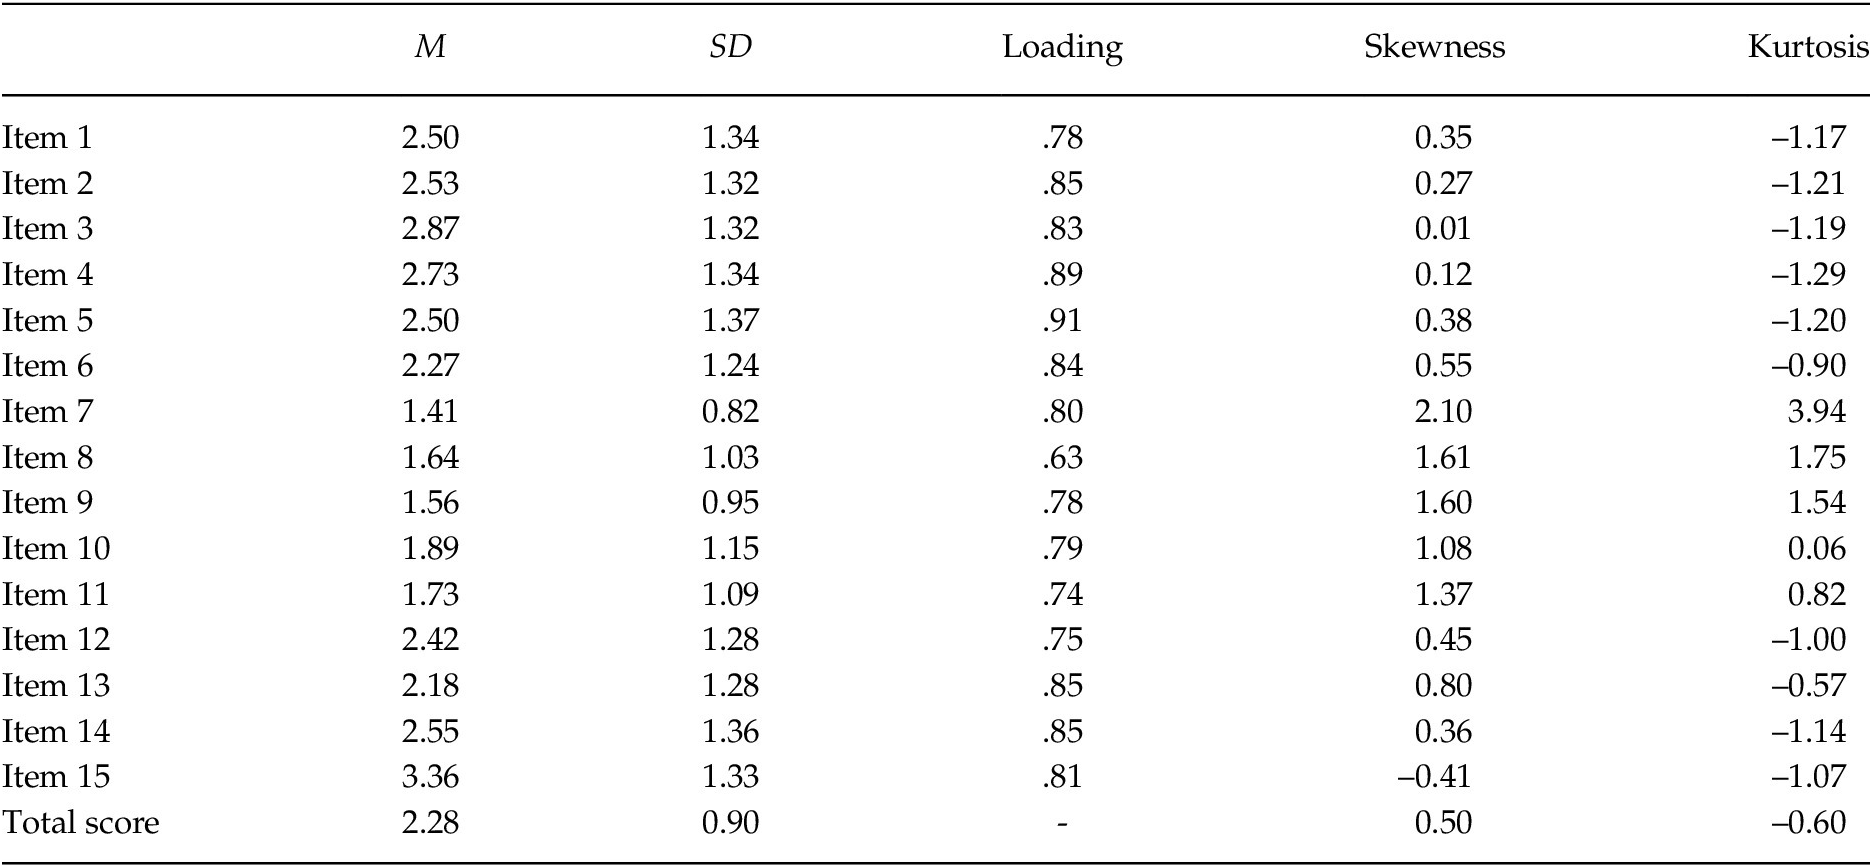
Conspiracy beliefs. In order to assess its psychometric properties, we administered the GCBS (α = .94; Likert 1–5; Brotherton et al., Reference Brotherton, French and Pickering2013), a 15-item measure with a 5-factor structured composed of: Government Malfeasance (3-item; α = .88; item M = 2.63, SD = 1.19; e.g., “the government is involved in the murder of innocent citizens and/or well-known public figures, and keeps this a secret”); Malevolent Global Conspiracy (3-item; α = .86; item M = 2.50, SD = 1.16; e.g., “the power held by heads of state is second to that of small unknown groups who really control world politics”); Extraterrestrial Cover Up (3-item; α = .91; item M = 1.53, SD = 0.86; e.g., “evidence of alien contact is being concealed from the public”); Personal Well Being (3-item; α = .78; item M = 2.01, SD = 0.98; e.g., “experiments involving new drugs or technologies are routinely carried out on the public without their knowledge or consent”); and Control of Information (3-item; α = .81; item M = 2.70, SD = 1.12; e.g., “groups of scientists manipulate, fabricate, or suppress evidence in order to deceive the public”). The descriptive statistics obtained for the Spanish version of the GCBS, including item-level information, are displayed in Table 2.
Descriptive Statistics of the GCBS

Note. Loadings correspond to the 5-factor model.
Need for uniqueness. We used the self-attributed need for uniqueness scale (α = .80; item M = 2.61, SD = 0.78; Likert 1–5; Lynn & Harris, Reference Lynn and Harris1997), a 4-item scale that measures the extent to which people feel they need to be unique and distinct from the others (e.g., “I intentionally do things to make myself different from those around me”).
Social axioms. We used four subscales of the Social Axioms Survey II–short form (Likert 1–5; Leung et al., Reference Leung, Lam, Bond, Conway, Gornick, Amponsah, Boehnke, Dragolov, Burgess, Golestaneh, Busch, Hofer, Espinosa, del, Fardis, Ismail, Kurman, Lebedeva, Tatarko, Sam and Zhou2012). Social axioms are defined as general beliefs about the functioning of the social and physical environment: Social Cynicism (8-item; α = .70; item M = 2.89, SD = 0.58), a negative view about human nature, characterized by mistrust of social institutions and the belief that people disregard ethical means in achieving their own ends (e.g., “kind-hearted people are easily bullied”); Reward for Application (8-item; α = .90; item M = 3.06, SD = 0.79), the belief that people’s use of knowledge, careful planning, and effort will lead to positive social outcomes (e.g., “hard-working people are well rewarded”); Religiosity (8-item; α = .88; item M = 1.86, SD = 0.81), a belief in a beneficial social function of religious institutions and practices (e.g., “religion helps people make good choices for their lives”); Fate Control (8-item; α = .82; item M = 1.75, SD = 0.67), the belief that events are determined by external forces and that there are ways to influence the impact of these forces (e.g., “fate determines one’s successes and failures”).
Statistical Analyses
The data were processed with the SPSS statistical package and the AMOS extension was used to fit the structural equation models. Specifically, CFA was applied to test potential factor structures, including the original 5-factor. The parameter estimation method was the maximum likelihood method, which allows the calculation of the commonly used criteria for acceptable goodness-of-fit indices: Comparative Fit Index (CFI) and Tucker-Lewis Index (TLI) close to 0.90 or above, Root Mean Square Error of Approximation (RMSEA) close to 0.08 or below, and Standardized Root Mean Square Residual (SRMR) close to 0.05 or below, as well as lower Akaike Information Criterion (AIC) and Bayesian Information Criterion (BIC) as measures of comparative fit and parsimony (Schumacker & Lomax, Reference Schumacker and Lomax2016). Subsequently, a factorial invariance analysis was also applied using two samples reported in Drinkwater et al. (Reference Drinkwater, Dagnall, Denovan and Neave2020). All decisions in the invariance analyses were based on the statistical criteria of Brown (Reference Brown2015): We examined the variation in the Chi-square statistic and changes in the Comparative Fit Index (CFI) as different restrictions were imposed on the specification of the models. The CFI index could be used as an analysis criterion because the comparisons between the different models were performed on a sample pair basis (Meade et al., Reference Meade, Johnson and Braddy2008). Finally, based on seven predictions derived from the current literature, a t-test (to compare university and non-university education), a quadratic regression controlling for linear relation (with the GCBS as the dependent variable and Political Orientation as the independent variable), and linear correlations between the GCBS and the remaining predicted variables (Need for Uniqueness and the four social axioms) were also calculated to assess the convergent validity of the Spanish adaptation.
Results
Confirmatory Factor Analysis
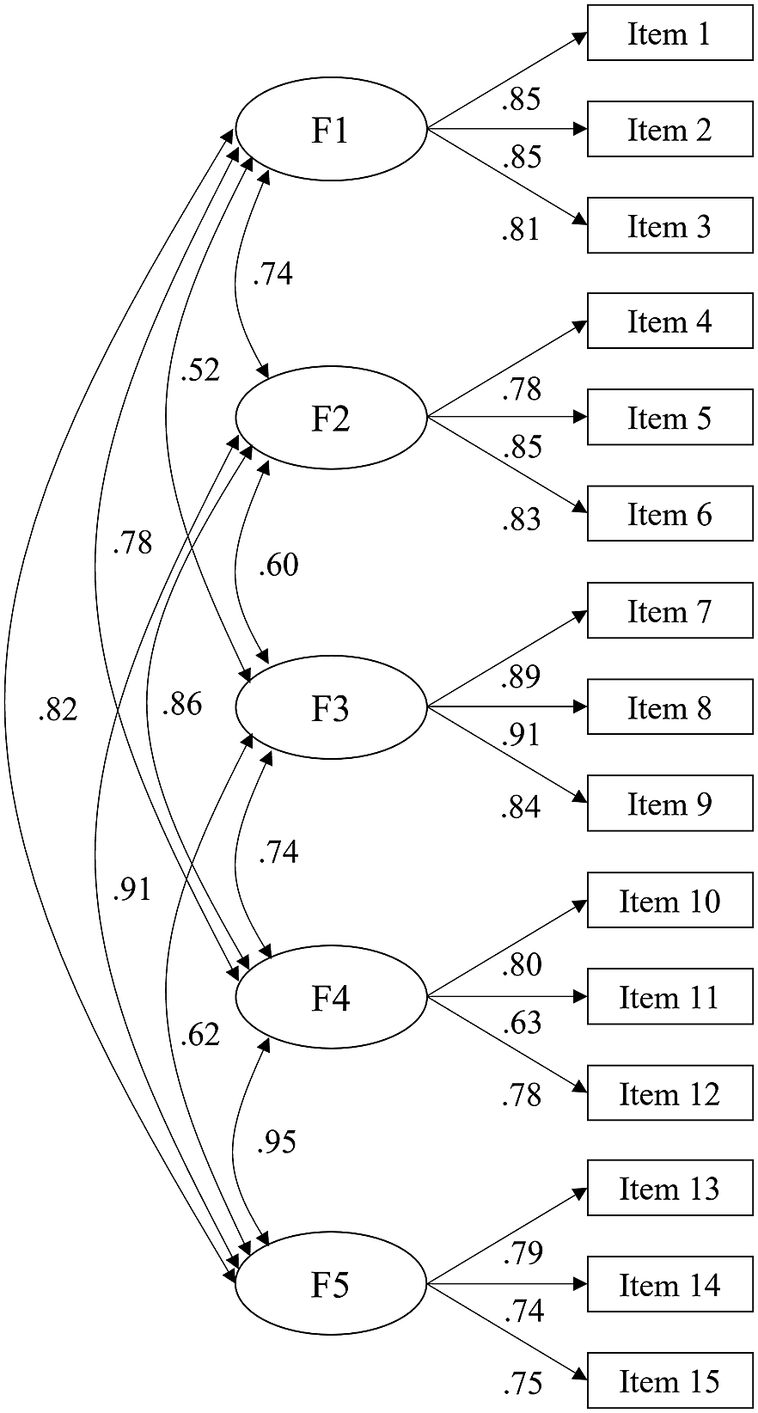
Before performing CFAs, we conducted an exploratory factor analysis using the same method as in the original scale validation (principal axis factoring and Promax rotation; Brotherton et al., Reference Brotherton, French and Pickering2013). Results suggested a 2-factor solution with Items 7, 8 and 9 (the original Extraterrestrial Cover Up factor) comprising one factor, and the rest of the items another one. However, a CFA revealed that this solution did not show good fit indices, χ2(89) = 772.43 (p = .001), TLI = 0.89, CFI = 0.91, RMSEA = 0.10, 90% CI [0.10, 0.11], SRMR = 0.06, BIC = 976.90, AIC = 834.43. Alternatively, we tested a 1-factor solution with CFA, which was also unsatisfactory, χ2(90) = 1,649.90 (p = .001), TLI = 0.76, CFI = 0.79, RMSEA = 0.15, 90% CI [0.15, 0.16], SRMR = 0.08, BIC = 1,847.77, AIC = 1,709.90. Finally, a last CFA resulted in excellent fit indices for the original 5-factor solution: χ2(80) = 281.22 (p = .001), TLI = 0.97, CFI = 0.97, RMSEA = 0.06, 90% CI [0.05, 0.07], SRMR = 0.03, BIC = 545.05, AIC = 361.22, with all item loadings above 0.63. Hence, we opted for retaining this factor structure. These results can be seen in Figure 1 and were similar when disaggregating the dataset between Spanish and Latin American participants—however, the results of Latin American participants must be interpreted with caution because the size of this subsample (N = 141) does not meet the usual rules of thumb for factor analyses.
Confirmatory Factor Analysis using the First Sample
Note. F1= government malfeasance; F2 = malevolent global conspiracy; F3 = extraterrestrial cover up; F4 = personal wellbeing; F5 = control of information. Error variables are not displayed. Values represent standardized coefficients.

Model Invariance Analysis
The invariance analysis was applied at the four levels specified by Brown (Reference Brown2015): (a) Configural invariance, (b) invariance of the factor loadings (weak factorial invariance), (c) invariance of the covariances (strong factorial invariance, also called scalar factorial invariance), and finally (d) invariance based on the residuals of the models (strict factorial invariance). Considering that the samples came from different countries, analysis of latent means was also added. All multi-group analyses were run on the 5-factor GCBS dimensional configuration (see Figure 1).
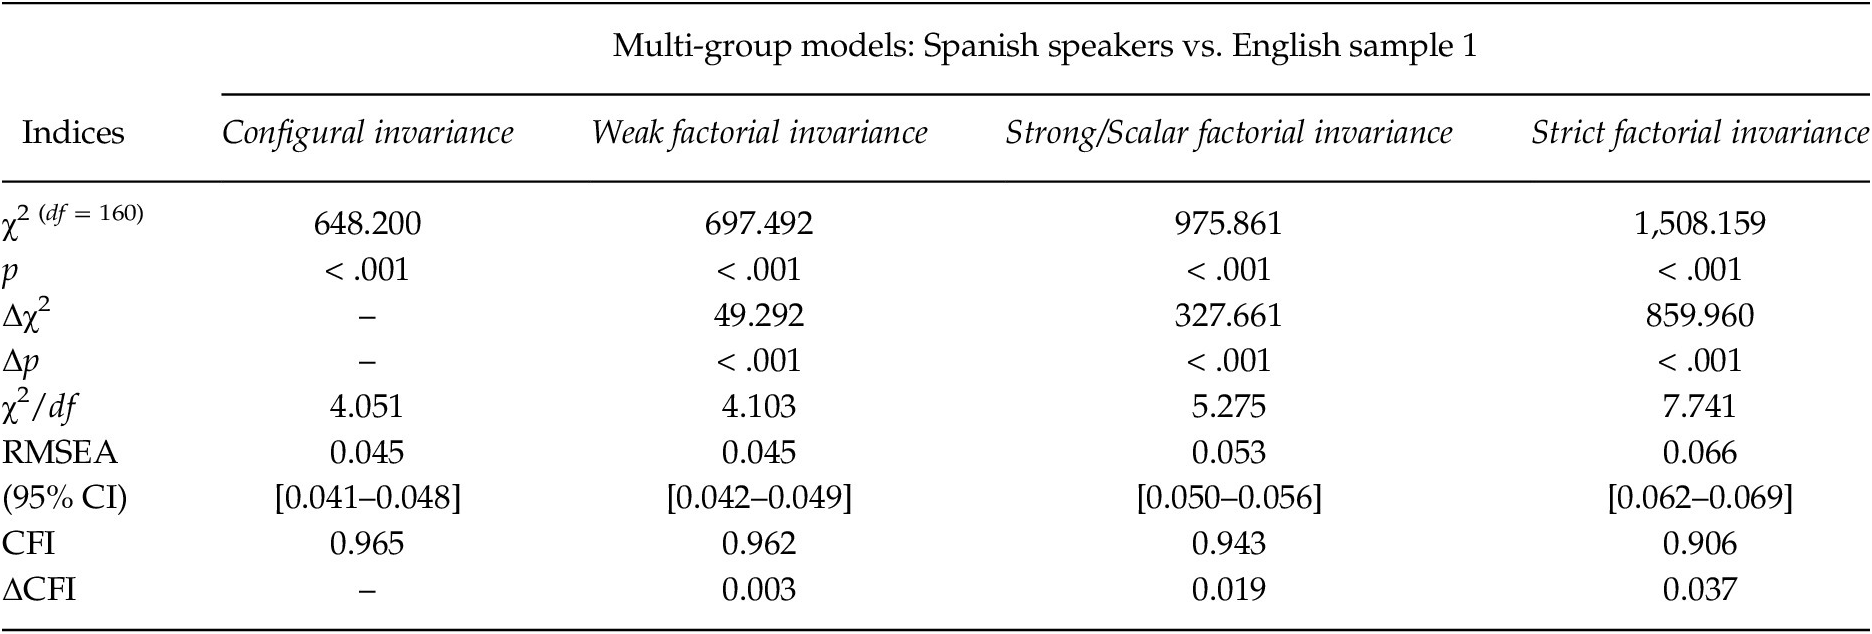
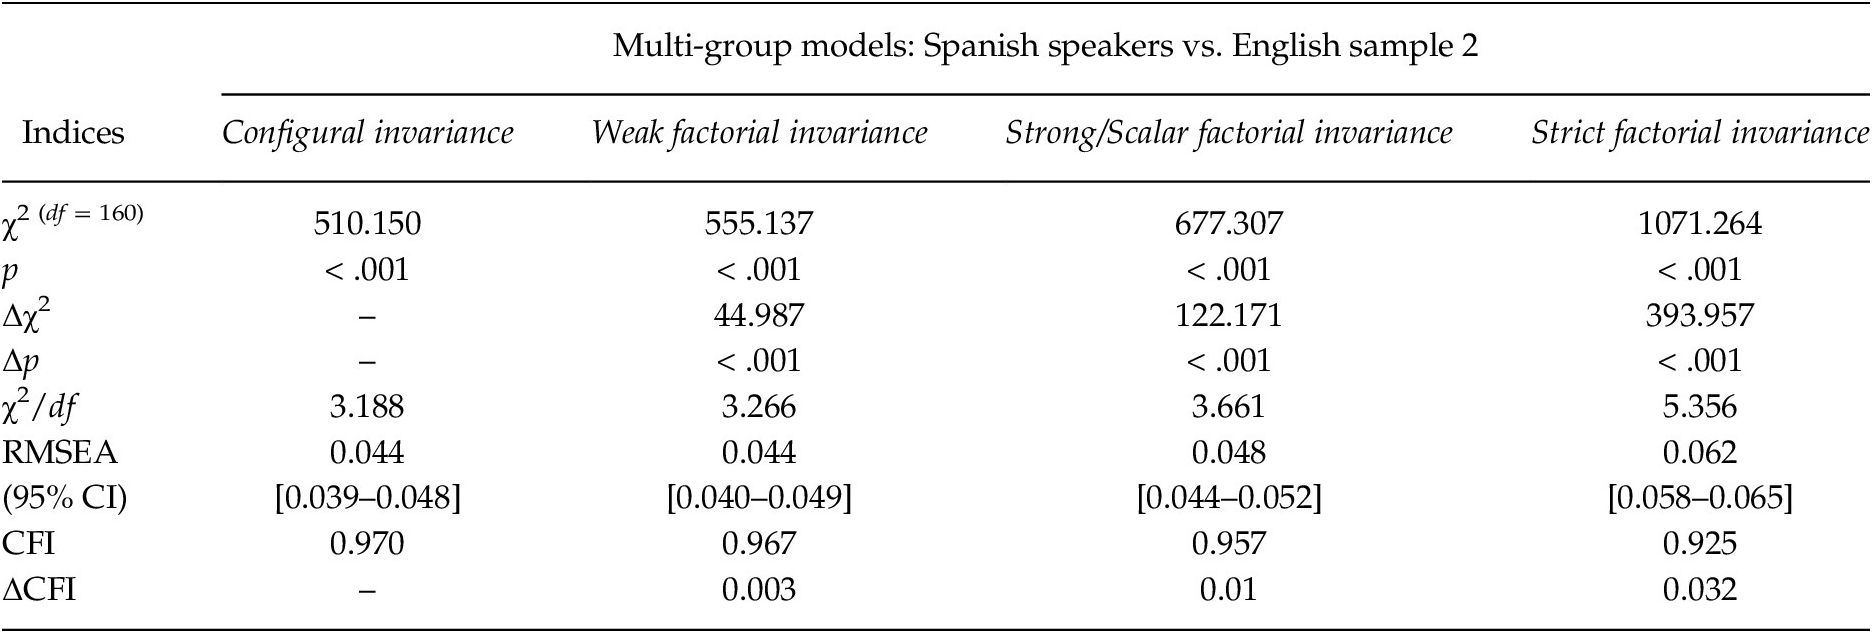
Firstly, the different types of invariances between the sample of Spanish speakers (N = 732) and the English sample 1 (N = 794) were analyzed. These results can be found in Table 3. Secondly, we examined the invariance between the Spanish speakers and the English sample 2 (N = 421). Information on this second comparison is available in Table 4. The results of these analyses revealed that the Chi-square statistic showed significant variations as new equality restrictions were imposed on the models. The validity of the configural invariance was met. However, considering the variations of the CFI and RMSEA indices, which were < 0.01 in some cases, weak and strong invariance could also be accepted (Chen, Reference Chen2007). Strict invariance was not assumed in either comparison. Therefore, we can accept partial invariance.
Model Fit Indices of the MMSI-2 Internal Structure and Multi-Group Analysis (Spanish Speakers vs. English Sample 1).

Note. RMSEA = Root mean square error of approximation; CFI = Comparative fit index; Δχ2 = Increase in the Chi Square coefficient; Δp = Probability that the increase in Chi Square does not differ from the previous model; ΔCFI = Increase in the CFI index.
Model Fit Indices of the MMSI-2 Internal Structure and Multi-Group Analysis (Spanish Speakers vs. English Sample 2).

Note. RMSEA = Root mean square error of approximation; CFI = Comparative fit index; Δχ2 = Increase in the Chi Square coefficient; Δp = Probability that the increase in Chi Square does not differ from the previous model; ΔCFI = Increase in the CFI index.
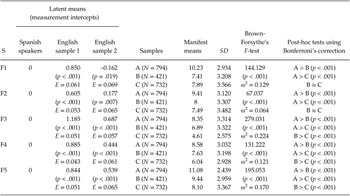
The analysis of the latent means is shown in Table 5. The latent means of the sample of Spanish speakers were set to "0" and the means of the English Samples 1 and 2 were liberalized. The contrasts with the manifest means of each dimension of the GCBS are also included. These results, displayed in Table 5, indicate that the hypothesis tests with the manifest means could be inadequate. The latent means also reveal that the differences between the Spanish and English samples could be due to cross-cultural differences and not necessarily due to the characteristics of the GCBS scale.
Descriptive Statistics and Direct Contrast of the Differences between the Responses of the Samples used

Note: S = Scales; F1 = government malfeasance; F2 = malevolent global conspiracy; F3 = extraterrestrial cover up; F4 = personal wellbeing; F5 = control of information; SD = Standard deviation; A = English sample 1; B = English sample 2; C = Spanish speakers; E = Error. Due to the fact that the sample sizes were very different from each other, the Brown-Forsythe correction of Fisher’s F was applied to obtain a more robust estimation.
Convergent Validity
To assess the convergent validity of the Spanish adaptation of the GCBS, we made five predictions based on well-established findings about conspiracy beliefs:
1. Based on Imhoff et al. (Reference Imhoff, Zimmer, Klein, António, Babinska, Bangerter, Bilewicz, Blanuša, Bovan, Bužarovska, Cichocka, Delouvée, Douglas, Dyrendal, Etienne, Gjoneska, Graf, Gualda, Hirschberger and van Prooijen2022; standardized β = .06 and .22), we predicted a quadratic relationship between conspiracy beliefs and political orientation controlling for linear relationFootnote 1.
2. Based on van Prooijen (Reference van Prooijen2017; r = −.15), we predicted that conspiracy beliefs are lower among people with higher educational attainment.
3. Based on Nestik et al. (Reference Nestik, Deyneka and Maksimenkо2020; standardized β = .16) and Biddlestone et al. (Reference Biddlestone, Green, Cichocka, Douglas and Sutton2022; r = .18), we predicted that conspiracy beliefs are positively correlated with Social Cynicism.
4. Based on Stasielowicz (Reference Stasielowicz2022; r = −.14), Beller (Reference Beller2017; correlation coefficients ranging from .09 to .36), and Oliver and Wood (Reference Oliver and Wood2014; correlation coefficients ranging from .10 to .36), we predicted that conspiracy beliefs are positively correlated with Religiosity.
5. Based on Imhoff and Lamberty (Reference Imhoff and Lamberty2017; correlation coefficients ranging from .13 to .20) and Biddlestone et al. (Reference Biddlestone, Green, Cichocka, Douglas and Sutton2022; r = .21), we predicted that conspiracy beliefs are positively correlated with Need for Uniqueness.
We also developed two hypotheses intended to be riskier than the previous ones. For this, we extrapolated the rationale offered by Fasce et al. (Reference Fasce, Adrián-Ventura and Avendaño2020) regarding paranormal and pseudoscientific beliefs to the domain of conspiracy beliefs, as some authors have argued that these three types of unwarranted beliefs may constitute a monological belief system (Lobato et al., Reference Lobato, Mendoza, Sims and Chin2014):
6. We predicted that conspiracy beliefs are positively correlated with Reward for Application (r = .20 and .33). Reward for Application may be promoting conspiracy beliefs through the prioritization of good social relationships over the defense of potentially conflicting ideas, showing heightened levels of social conformity and uncritical attitude (Bond et al., Reference Bond, Leung, Au, Tong and Chemonges-Nielson2004; Chen et al., Reference Chen, Bond and Cheung2006; Singelis et al., Reference Singelis, Hubbard, Her and An2003).
7. We predicted that conspiracy beliefs are positively correlated with Fate Control (r = .49 and .51). Fate Control has been previously linked to unfounded beliefs (Singelis et al., Reference Singelis, Hubbard, Her and An2003) by means of its existing association with an external locus of control (Chen et al., Reference Chen, Bond and Cheung2006) and with a conception of facts as shaped by social and political processes (Garrett & Weeks, Reference Garrett and Weeks2017). Conspiracy beliefs have also been associated with low external control (Biddlestone et al., Reference Biddlestone, Green, Cichocka, Douglas and Sutton2022; r = .19).
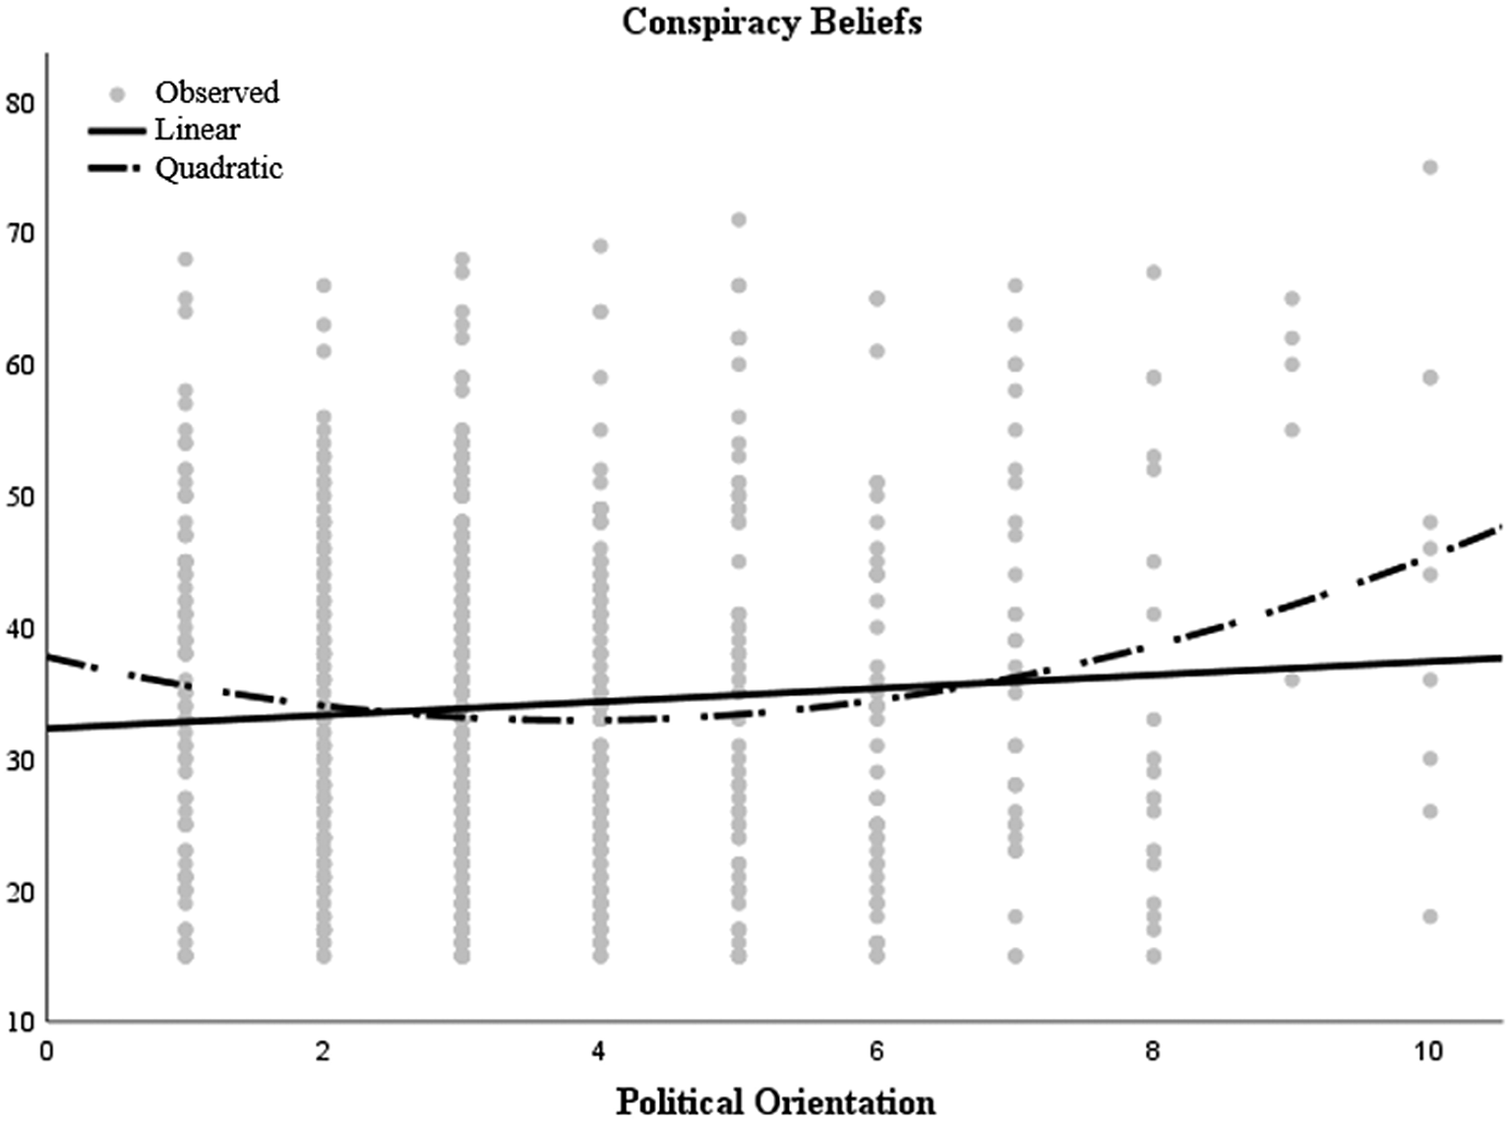
As expected by our first hypothesis (Figure 2), we found a quadratic relationship between conspiracy beliefs and political orientation controlling for linear relation (adjusted R2 = .018, standardized β = .45, p < .001). The size of this quadratic relationship was similar to the larger ones reported by Imhoff et al. (Reference Imhoff, Zimmer, Klein, António, Babinska, Bangerter, Bilewicz, Blanuša, Bovan, Bužarovska, Cichocka, Delouvée, Douglas, Dyrendal, Etienne, Gjoneska, Graf, Gualda, Hirschberger and van Prooijen2022). According to our second prediction, levels of conspiracy beliefs were lower among university educated people (sample size: 574; item M = 2.22, SD = 0.87) in comparison to people with pre-university education, sample size: 158; item M = 2.46, SD = 0.97: t(730) = 3.00, p = .003, d = 0.27, 95% CI [0.09, 0.44]. In line with van Prooijen (Reference van Prooijen2017), the size of this difference was small. Table 6 presents zero-order correlations with the predicted variables. As expected by our remaining six hypotheses, conspiracy beliefs showed to be positively correlated with Social Cynicism (r = .19, p < .001), Reward for Application (r = .18, p < .001), Religiosity (r = .19, p < .001), Need for Uniqueness (r = .12, p < .001), and Fate Control (r = .39, p < .001). In all cases, the directions and effect sizes of the predicted correlations were similar to those reported in previous studies. These results endorse the convergent validity of the Spanish version of the scale.
Quadratic Regression with the GCBS as the Dependent Variable and Political Orientation as the Independent Variable

Correlation Matrix between the GCBS and the Predicted Variables

Note. GCBS = total score; F1 = government malfeasance; F2 = malevolent global conspiracy; F3 = extraterrestrial cover up; F4 = personal wellbeing; F5 = control of information.
p values between parentheses. Values in bold survived Bonferroni correction at the p < .05 threshold.
Discussion
The Spanish adaptation of the GCBS provided a reliable measure of the construct, exhibiting the original 5-factor structure and convergent validity. However, despite invariance analyses indicating that the original factor structure is applicable, significant variations emerged when new equality restrictions were imposed on models. The interpretation of this relative lack of invariance is meaningful, as prior studies highlight the strong influence of cultural and sociodemographic variables on how conspiracy beliefs are conceived and targeted (e.g., Adam-Troian, Reference Adam-Troian, Wagner-Egger, Motyl, Arciszewski, Imhoff, Zimmer, Klein, Babinska, Bangerter, Bilewicz, Blanuša, Bovan, Bužarovska, Cichocka, Çelebi, Delouvée, Douglas, Dyrendal, Gjoneska and van Prooijen2021; Biddlestone et al., Reference Biddlestone, Green and Douglas2020; van Prooijen & Song, Reference van Prooijen and Song2021).
We would like to remark on other limitations. Firstly, our sample of Spanish speakers was composed of a higher number of non-religious and university-educated participants—with the latter socio-demographic asymmetry being attributable to our sampling strategy (Perrin, Reference Perrin2015). The impact of these factors should be assessed in future studies. Secondly, there is potentially relevant variability between Spanish-speaking countries and most participants in our sample originated from Spain (81%), a Western, Educated, Industrialized, Rich, and Democratic country (Henrich et al., Reference Henrich, Heine and Norenzayan2010). Hence, caution is required when the outcomes are extrapolated to non-WEIRD populations. Thirdly, we observed some fit indices with significant CFA values. It is important to note that the chi-square statistic used to test the goodness-of-fit of the confirmatory models is a highly sensitive indicator to sample size. When the samples are N > 400–450, this statistic overestimates the discrepancies and detects mismatches that are not relevant or constitute false positives (Satorra & Bentler, Reference Satorra, Bentler, von Eye and Clogg1994). Therefore, considering the sample size of the present study and the power limitations of the chi-square, the chi-square values observed in this study should also be addressed with caution. Finally, although external criteria allowed us to assess interesting convergent relationships (i.e., political orientation, fate control, and cynicism), we did not perform discriminant and concurrent validity using other conspiracy measures (e.g., conspiracy mentality). Future research confirming convergent validity using measures of general gullibility (e.g., bullshit receptivity) would also be very welcome.
After a process of back translation, we examined the validity of the GCBS using an international sample of Spanish speakers. Confirmatory factor analyses revealed that the Spanish adaptation exhibits a 5-factor internal structure analogous to that of the original English scale, optimal levels of internal consistency, and partial invariance regarding two English samples. According to correlational analyses, we also report evidence of convergent validity regarding educational level, political orientation, social cynicism, religiosity, need for uniqueness, reward for application, and fate control. We recommend researchers use this Spanish version of the scale in a variety of research contexts, as it can provide reliable measurement of general conspiracy beliefs.