Implications
Heat stress in dairy cows is a topic of high economic importance, since it reduces both productive and reproductive performances and health and welfare. This is especially true in the Mediterranean basin, where a gradual increase in temperature and humidity is expected in the coming years. Cooling systems help in reducing heat stress in dairy cows, but could be expensive if used when unnecessary. This study aims to deepen the knowledge about the effects of heat stress on rumination, electronically monitored, and to establish the basis for future research investigating the possibility of using this relationship as a useful alert.
Introduction
One of the major external factors that can negatively affect the performance of dairy cows is the thermal environment in which they live (Nardone et al., Reference Nardone, Ronchi, Lacetera, Ranieri and Bernabucci2010). This finding is especially true in high-yielding animals of high genetic merit, which are very sensitive to heat stress (Bernabucci et al., Reference Bernabucci, Biffani, Buggiotti, Vitali, Lacetera and Nardone2014). Several studies hypothesised the ‘thermo-neutral zone’ (i.e. the thermal equilibrium between the animal and the environment where it lives) for lactating dairy cows to be between 5°C and 25°C to 26°C (Berman et al., Reference Berman, Folman, Kaim, Mamen, Herz, Wolfenson, Arieli and Graber1985; Roenfeldt, Reference Roenfeldt1998). Whenever the temperature exceeds this thermal zone, trespassing either the upper or lower limit, animal physiology changes to a disorder status in which, for example, milk production declines and its composition changes (Johnson, Reference Johnson1980).
Heat stress is an important threat to cattle breeding, especially in the Mediterranean basin, which is supposed to undergo a gradual increase in temperature and humidity in the coming years up to 2050 (Segnalini et al., Reference Segnalini, Bernabucci, Vitali, Nardone and Lacetera2013). Moreover, the current trend in the dairy industry is towards fewer but larger farms, rearing a great number of animals in the same structure (Winsten et al., Reference Winsten, Kerchner, Richardson, Lichau and Hyman2010). Overcrowding and higher temperatures and humidity can indeed result in harsh conditions for dairy cows.
Responses of dairy cows to heat stress are copious: for example, raised respiration rates (Omar et al., Reference Omar, Kirrella, Fawzy and El Keraby1996), and panting and sweating (Blazquez et al., Reference Blazquez, Long, Mayhew, Perry, Prescott and Wathes1994). However, to date, few studies have analysed the effects of heat stress on health and rumination activity of cattle. Rumination, described by Erina et al. (Reference Erina, Cziszter, Acatincăi, Baul, Tripon, Gavojdian, Răducan and Buzamăt2013) as the process of regurgitation, remastication, salivation, and swallowing of ingesta to reduce the particle size of feedstuffs and enhance fibre digestion, is a key physiological function in ruminants, and is associated with cow welfare (Bar and Solomon, Reference Bar and Solomon2010). Feeding variables (e.g. feed intake) have the largest effect on rumination, being intrinsically connected to this function. However, in commercial farms, recording of feeding information is not so common, and it is almost impossible to calculate feed intake for each animal. It is, instead, quite common among breeders to group animals on their productive level, optimising the quantity and quality of feed (Spahr et al., Reference Spahr, Shanks and McCoy1993).
Despite its importance, the effects of length, severity, and timing with respect to stage of lactation of heat stress on health and rumination are still unknown. The overall effect of heat stress has been assessed by measuring body temperature of dairy cows, which shows a high susceptibility to hot environments (Araki et al., Reference Araki, Nakamura, Kam and Clarke1984). The temperature–humidity index (THI) combines ambient temperature and relative humidity into a single value, and is a commonly used index (Hahn et al., Reference Hahn, Mader and Eigenberg2003) to assess the effects of environmental temperature on dairy cows. However, THI does not include in its equation the effects of other environmental variables (e.g. solar radiation, wind). Several studies have already highlighted the negative relationship between THI and productive and reproductive performances in dairy cows (Bouraoui et al., Reference Bouraoui, Lahmar, Majdoub, Djemali and Belyea2002; García-Ispierto et al., Reference García-Ispierto, López-Gatius, Bech-Sabat, Santolaria, Yániz, Nogareda, De Rensis and López-Béjar2007; Bernabucci et al., Reference Bernabucci, Biffani, Buggiotti, Vitali, Lacetera and Nardone2014; Biffani et al., Reference Biffani, Bernabucci, Vitali, Lacetera and Nardone2016), but few studies investigated the relationship between THI and rumination time (RT). Soriani et al. (Reference Soriani, Panella and Calamari2013) found a significant negative correlation (r=−0.32; P<0.05) between THI and RT, but the study was conducted monitoring only 21 cows.
Based on the aforementioned relationships, THI might be useful as a welfare index. Temperature–humidity index recording could be implemented into automatic system programmed to send an alert directly to farmers, who can subsequently act to resolve or reduce the heat stress suffered by their animals. Several studies have already shown that the use of a cooling system helps in reducing the negative effects of heat stress in dairy cows (Frazzi et al., Reference Frazzi, Calamari, Calegari and Stefanini2000; Calegari et al., Reference Calegari, Calamari and Frazzi2016), thus an automatic activation based on a THI threshold could lead to further improvements. Indeed, some commercially available systems that can activate cooling apparatus based on THI levels already exist.
THI can be easily obtained at farm level by installing devices for temperature and humidity recording, but their distribution is still limited. On the other hand, automated recording devices to monitor cow behaviour (e.g. RT) are becoming increasingly common at farm level. Information could indeed be paired and used to disentangle their relationship. Eventually, evidences can be gained whether RT might be used as a potential and more comprehensive indicator of animal welfare than THI. The objective of the present paper is to investigate the relationship between THI and RT in dairy cows using data collected during a hot summer in a temperate area of the Mediterranean basin.
Material and methods
Animal and environmental data collection
Data were collected from 122 Italian Holstein cows, reared in the Tadini Dairy Park experimental farm, located in Gariga di Podenzano, province of Piacenza, Northern Italy (geographical position: 44° 58' 55.0" N, 9° 40' 58.8" E; 68 m above the sea level). Cows were located in a freestall barn, north–south oriented, without any ventilation system, and open on all of the four sides. All of the animals inside the barn were used for this study. The mean age (±SD) of the animals was 46.67±17.56 months and the average (±SD) daily milk production was 28.17±9.60 kg. Animals were classified by parity as ‘1’, ‘2’ and ‘3plus’ (all the cows after the third calving) and were 48, 34, and 44, respectively. Although recent studies confirmed a significant relationship between RT and both respiration rate and panting (Magrin et al., Reference Magrin, Brscic, Lora, Rumor, Tondello, Cozzi and Gottardo2016), this information is not available in commercial farms and was not considered in the present study.
Ambient temperature and relative humidity (AT and RH, respectively) were recorded from the 1 June to the 31 August 2015 using a HOBO® Micro Station Data Logger (Onset®, Cape Cod, MA, USA) installed inside the barn (next to the pen, just high enough to be out of cows’ reach) in April 2015 and equipped with a 12-bit temperature/RH sensor cable. Schüller and Heuwieser (Reference Schüller and Heuwieser2016) suggested that climate conditions should be obtained at cow level because of microclimatic differences that occur in dairy barns. However, since the barn was open on all of the four sides, fresh air supply and air recirculation was similar for all the animals and areas with different microclimates were less likely to generate. Any variability due to this issue was absorbed by the random effects of the models (namely animal and date-test effects).
Both AT and RH were measured once a minute and recorded as a mean value every 5 min. The guaranteed working range, as indicated in the manufacturer manual, was from 0°C to 50°C with an accuracy of ±0.2°C for the AT and from 10% to 90% with an accuracy of ±2.5% for the RH.
Descriptive statistics for the three months (June, July and August) were calculated and the difference between the means was statistically evaluated with a Tukey’s honest significant difference (HSD) test, a multiple comparison followed by a statistical test with a distribution similar to a t distribution. The HSD test was performed using the HSD.test function from the R package agricolae (de Mendiburu, Reference de Mendiburu2016).
The RT was measured and summarised in 2-h intervals using the Heatime® HR system (SCR Engineers Ltd., Hadarim, Netanya, Israel). The system is composed of a neck collar with a tag containing a microphone to monitor rumination and an accelerometer to quantify activity, as validated by Schirmann et al. (Reference Schirmann, von Keyserlingk, Weary, Veira and Heuwieser2009). The raw data are subsequently processed by the DataFlowTM II software (SCR Engineers Ltd.) provided by the farm with additional information about each cow, namely ID number, age, parity, dates of calving, days in milk (DIM), and the daily milk production registered by the linked parallel milking parlour. Each stall entrance was equipped with a single long-distance antenna, which read the specific signal coming from the rumination monitoring tag on each cow. A possible critical point of this study was the possible issues due to mis-identification of the animals at the milking parlour. Given the small dimensions of the herd and the milking parlour, the probability for cows to switch their positions once passed the identification antennae was low. We acknowledge that this could be an issue in larger farms. Furthermore, in order to check possible wrong association between cow ID and production/rumination data, consecutive recordings from the same cow were visually inspected in order to identify unexpected patterns and to remove potential outliers.
Temperature–humidity index
Temperature–humidity index was calculated according to the equation from Vitali et al. (Reference Vitali, Segnalini, Bertocchi, Bernabucci, Nardone and Lacetera2009):
 $$\eqalign { {\rm THI}\,{\equals}\, & \left( {1.8\,{\times}\,{\rm AT}{\plus}32} \right){\minus}\left( {0.55{\minus}0.55\,{\times}\,{\rm RH}} \right) \cr & {\times}\left[ {\left( {1.8\,{\times}\,{\rm AT}{\plus}32} \right){\minus}58} \right]$$
where AT is expressed in degrees Celsius and RH as a fraction of the unit. The (1.8×AT+32) term is used for the conversion from degree Celsius to Fahrenheit. Following Hahn et al. (Reference Hahn, Mader and Eigenberg2003), six THI thresholds for heat stress classification were used, namely ‘safe’ (THI<68), ‘mild discomfort’ (68⩽THI<72), ‘discomfort’ (72⩽THI<75), ‘alert’ (75⩽THI<79), ‘danger’ (79⩽THI<84), and ‘emergency’ (THI⩾84). After merging weather and rumination data, a mean value for each 2-h interval was estimated for THI, using AT and RH information.
Statistical analyses
The correlation between THI and RT was calculated using the cor function in R (R Core Team, 2014). The effect of THI on RT was analysed with a two-step procedure: in the first step, RT was adjusted for a set of fixed and random effects (excluding the THI), fitting the following mixed linear model (Model 1):
 $${\rm RT}_{{ijklm}} \,{\equals}\,{\rm animal}_{i} {\plus}{\rm par}_{j} {\plus}{\rm prod}\_{\rm lvl}_{k} {\plus}{\rm calv}_{l} {\plus}{\rm date}_{m} {\plus}{\epsilon}_{{ijklm}} $$
where RT ijklm is the rumination time in 2-h intervals; animal i is the random effect of the ith animal (in order to take account of the correlation between measurements recorded from the same animal); par j the fixed effect of the parity order j ; prod_lvl k the fixed effect of the animal milk production level k, classified based on the calculated production tertiles (low, mid and high) of animals grouped by parity and lactation phase (DIM<60, 60⩽DIM<100, DIM⩾100); calv l the fixed effect of the month and the year of the last calving event classl(format mmyyyy); date m the random effect of the mth test day; ε ijklm the random residual effect.
In the second step, THI (factor with six classes, as previously defined) were added as a fixed effect to Model 1:
 $$\eqalignno { {\rm RT}_{{ijklmn}} \,{\equals}\, & {\rm animal}_{i} {\plus}{\rm par}_{j} {\plus}{\rm prod\_lvl}_{k} {\plus}{\rm calv}_{l} {\plus}{\rm date}_{m} \cr & {\plus}{\rm THI}_{n} {\plus}{\epsilon}_{{ijklmn}} {\rm }[\rm Model{\rm }\,2]$$
where THI n is the fixed effect of the nth THI class.
Both models were performed using the lmer function of R package lme4 (Bates et al., Reference Bates, Mächler, Bolker and Walker2015), which fits mixed model by restricted maximum likelihood t-test using Satterthwaite approximations to degrees of freedom.
Subsequently, statistical significance of the model was checked with the lmerTest package (Kuznetsova et al., Reference Kuznetsova, Brockhoff and Christensen2015). The package updates the existing function ANOVA with the capability to evaluate statistical significance of fixed effects in a mixed model adding both least squares means and confidence intervals. Q-Q plots were used to check residuals distribution. Finally, in order to test the effect of THI on RT, Model 1 and Model 2 were compared by a simple ANOVA.
Results
Environmental data
In order to check the logger recording activity, AT and RH recorded during April 2015 were compared with data collected from an external professional weather station, located nearby (<1 km). The two data sets showed a Pearson correlation rate of 98%, with the values of on-farm temperature and humidity always being slightly higher than the external ones, most likely due to the heat dissipation mechanisms (e.g. sweat evaporation and breathing) of the animals. Schüller et al. (Reference Schüller, Burfeind and Heuwieser2013) stated that to assess heat stress accurately is mandatory to measure the relevant climate data inside the barn to avoid underestimation of heat stress. However, we did not find such a strong underestimation in our study: this is most likely due to the different distance between the meteorological station and the barn in our and their study (<1 and 18 km, respectively).
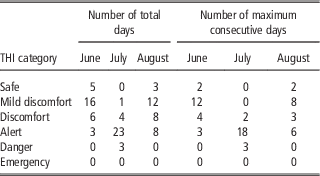
A total of 288 AT and RH records per day were collected in June (n=8640), July (n=8928) and August (n=8928). For each record, THI was calculated. Descriptive statistics for the 3 months are summarised in Supplementary Table S1. For each of the 3 months, the monthly THI mean was over the ‘safe’ condition threshold: specifically, ‘mild discomfort’ in June, ‘discomfort’ in August and ‘alert’ condition in July, which was the hottest summer month. Furthermore, the daily THI mean reached the ‘danger’ condition threshold in 3 consecutive days, from the 5th to the 7th of July. The numbers of total days and maximum consecutive ones per THI category are reported in Table 1.
Numbers of total days and consecutive ones per temperature–humidity index (THI) category: ‘safe’ condition (THI<68), ‘mild discomfort’ (68⩽THI<72), ‘discomfort’ (72⩽THI<75), ‘alert’ (75⩽THI<79), ‘danger’ (79⩽THI<84) and ‘emergency’ (THI⩾84)

Rumination time and fitted models
Descriptive statistics for the RT are summarised in Supplementary Table S2. Pearson correlation between RT and THI showed a significant unfavourable correlation (−0.22, P<0.001), in agreement with Soriani et al. (Reference Soriani, Panella and Calamari2013).
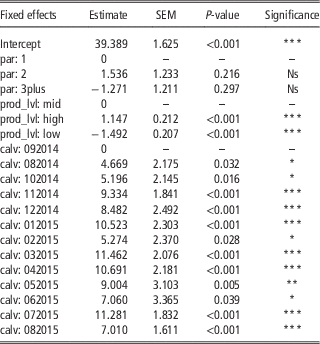
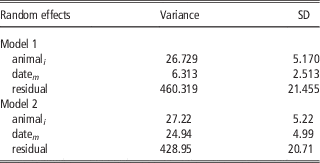
The fixed effects from Model 1 (estimated values, SEM and P-values reported in Table 2) were statistically tested, and the results are summarised in Table 3. Random effect variances are in Table 4. Cow and test day accounted for ~5.4% and 1.3% of the overall variance, respectively. The adjusted R 2 of this model was 0.07 (calculated as suggested by Xu, Reference Xu2003). The fitted values from the model were plotted v. the residuals of the same (calculated using the resid function of R), showing a symmetrical distribution without any clear pattern, suggesting that a linear model was suitable for our data.
Model 1: fixed effects estimates, standard error of the means and significance by P-value

The significance codes are: 0<***<0.001<**<0.01<*<0.05 <Ns.
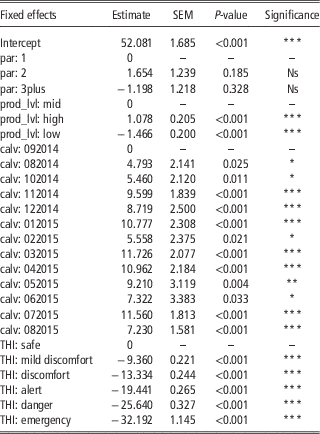
Model 2: fixed effects estimates, standard error of the means and significance by P-value

The significance codes are: 0<***<0.001<**<0.01<*<0.05<Ns.
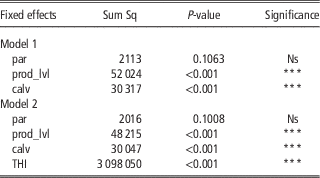
Statistical test for fixed effects from both Model 1 (including parity, par, milk productive level, prod_lvl, and the month and the year of the last calving event, calv, in the observed Italian Holstein herd) and Model 2, including the temperature–humidity index (THI) in addition to the previous model parameters

The significance codes are: 0<***<0.001<**<0.01<* <0.05<Ns.
Milk production level and the date of last calving had significant associations with RT (P<0.001 for both the variables), while parity did not (P=0.106). Using mid-production level as reference class, both high- and low-production levels showed a significant association with RT: the former increasing by 1.147±0.212 min per unit (P<0.001), and the latter decreasing by 1.492±0.207 min per unit (P<0.001). This result, together with a correlation of 20.2% (P<0.001), confirmed the hypothesis validated by Moallem et al. (Reference Moallem, Altmark, Lehrer and Arieli2010), in which RT and milk production are positively related. Differently, Byskov et al. (Reference Byskov, Nadeau, Johansson and Nørgaard2015) conducted a similar study in experimental farms where feeding data was available. A negative correlation was found between milk production and RT in minutes per kilogram of DMI. Although accounting for DMI in RT could result in more precise results, it is important to keep in mind that usually, in commercial farms, it is not possible to quantify DMI for each animal. Regarding the month/year of last calving event, all of the different classes resulted in a statistically significant difference from the 092014 (i.e. September 2014) reference level.
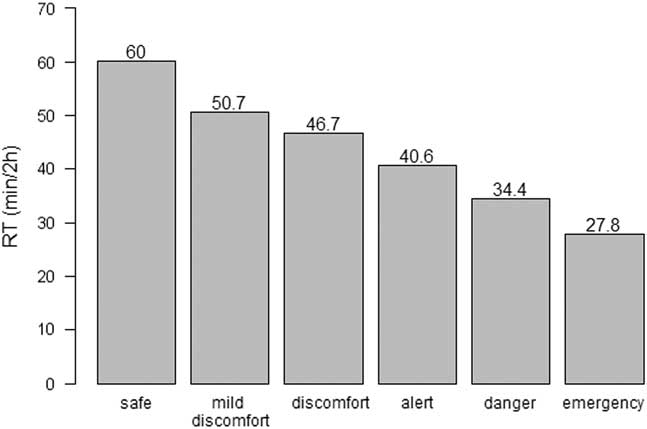
In the second step of this work, Model 2 (which included the THI effect) was fitted, its fixed effects (estimated values, SEM and P-values reported in Table 3) were statistically tested, and the results are summarised in Table 4. Temperature–humidity index effect was statistically significant and RT decreased by 9.36, 13.33, 19.44, 25.64 and 32.19 min/2 h per unit by a mild, discomfort, alert and danger THI status, respectively. Changes in RT due to different milk production in Model 2 were smaller than in Model 1. The greater effect that THI has on RT could have partially masked milk production effect on the dependent variable of the study, resulting in the observed minor effect on RT. As expected, parity did not have a significant effect on RT in Model 2 either. With the inclusion of the THI effect in Model 2 (Table 5), the variance explained by both test day and animal effect increased. Indeed, the residual variance of Model 2 was lower than the one in Model 1, confirming that the new added variable explained part of the remaining variability of the first model. Over the total variance, in the second model, the between-cow variation accounted for ~5.7%, while between-date variation accounted for 5.2%. Least squares means of RT by THI levels were calculated and presented in Figure 1.
Least squares means of rumination time (RT) by temperature–humidity index status in the observed Italian Holstein herd.

Random effects, variances and standard deviations from both Model 1 (including parity, par, milk productive level, prod_lvl, and the month and the year of the last calving event, calv, in the observed Italian Holstein herd) and Model 2, including the temperature–humidity index (THI) in addition to the previous model parameters

The significance codes are: 0<*** <0.001<** <0.01<* <0.05<Ns.
The differences between the two models were tested by ANOVA, resulting statistically significant (P<0.001). Both the Akaike Information Criterion (AIC) and the Bayesian Information Criterion (BIC) were smaller for Model 2, suggesting a better fit of the data. Adjusted R 2 for Model 2 (calculated as suggested by Xu, Reference Xu2003) was 0.13, showing a twofold increase with respect to Model 1.
Discussion
The results presented in this study confirm a significant unfavourable association between THI and RT in Holstein dairy cows: when THI increases (i.e. increasing heat stress), a reduction in the RT occurs. An intuitive explanation could be that heat stress is known to activate physiological and metabolic responses to cope with the not optimal environmental conditions. These responses might involve, for example, a reduction in feed intake which eventually causes a reduced RT. This negative correlation between RT and THI is furthermore confirmed by similar findings from a previous study (Soriani et al., Reference Soriani, Panella and Calamari2013).
The two fitted models (with and without THI as fixed effect, respectively) were statistically different. This result supports the hypothesis that a significant association does exist between THI and RT, the latter showing a decrease as the THI classes shifted from ‘safe’ to ‘emergency’. The THI classes adopted here are effectively describing a different response to a growing non-optimal climate, as highlighted by the statistical difference between the effects on RT at different classes. Furthermore, adding the THI to the other factors statistically improved the goodness of fit of the model (twofold increase in adjusted R 2).
The effect of milk production was included in the model as a categorical effect using three classes (namely, low-, mid- and high-productive) and not as a linear or nonlinear covariate. The rationale behind the use of such an approach was mainly due to an attempt to reduce model complexity, especially because of the limited number of available records. Nevertheless, both Model 1 and 2 were also fitted including milk production as linear and/or quadratic effect but results did not change. Milk was included as an independent variable in the model to assess the association between variations in RT and changes in milk production. There is a positive correlation between the two variables, with RT increasing in high-productive animals and decreasing in low-productive ones. This association confirmed the results previously obtained by other authors (Moallem et al., Reference Moallem, Altmark, Lehrer and Arieli2010). However, a different result was reported by Byskov et al. (Reference Byskov, Nadeau, Johansson and Nørgaard2015), where the correlation between RT (expressed in minutes per kilogram of DM intake) was negative. The association presented here could be therefore biased due to the absence of feed intake information. Nevertheless, Byskov et al. (Reference Byskov, Nadeau, Johansson and Nørgaard2015) reported that variation in feed intake took into account for 32% of the variation in RT, whereas 48% of the total variation in RT was found between-cows. Considering that our model took into account the between-cows variation, which represents almost half of the total variation, introduced bias due to the absence of feed intake recording should not invalidate our results and, therefore, could be a reasonable compromise between scientific precision and commercial farm needs, where feed intake is rarely recorded.
The correlation between THI and RT presented in this study suggests that rumination could be a valuable tool for evaluating the heat stress effect on Holstein dairy cows. Further studies are needed to confirm the potential predictive use of the RT changes.
Acknowledgements
The authors thank SCR Engineers Ltd. (Hadarim, Netanya, Israel) for supplying the technologies used in this study, Milkline Srl (Gariga di Podenzano, Piacenza, Italy) for the technical support and Sivam Spa (Casalpusterlengo, Lodi, Italy) for the raw data from the Tadini Dairy Farm herd.
Supplementary Material
To view supplementary material for this article, please visit https://doi.org/10.1017/S1751731117001173