


Introduction
Sea ice in the Weddell Sea undergoes a large seasonal cycle, varying from about
 area for the summer minimum to about
 for the winter maximum (Reference Zwally, Comiso, Parkinson, Campbell, Carsey and GloersenZwally and others, 1983). The summer minimum of the Weddell Sea ice
represents about half the area of the pack ice in Antarctica at that time. The
Weddell Sea pack ice as a whole is a climatic feature of some importance. Its
northern limit (55¶ S latitude) extends well into sub-Antarctic regions and
consequently has an influence on the climate, ocean and ecosystems of the South
Atlantic region.
Sea-ice cover in the Southern Ocean has been modeled by Reference Parkinson and WashingtonParkinson and Washington (1979) using comprehensive atmospheric and oceanic heat flux inputs and ice thermodynamics together with ad hoc sea-ice dynamics. Using more realistic sea-ice dynamics, Reference Hibler and AckleyHibler and Ackley (1983) examined the dynamic-thermodynamic response of a Weddell Sea sea-ice model focusing on the role of sea-ice processes on the advance and retreat of the ice margin. An important conclusion of that study was that the inclusion of sea-ice dynamics produces a realistic seasonal cycle of sea-ice extent. Following these, a series of ice–ocean coupled models (e.g. Reference Yperselevan Ypersele, 1986; Reference Lemke, Owens and HiblerLemke and others, 1990; Reference Owens and LemkeOwens and Lemke, 1990; Reference Stössel, Lemke and OwensStössel and others, 1990), and an atmospheric–ice coupled model (Reference KochKoch, 1988) have also been developed.
Expanding from the results of Reference Hibler and AckleyHibler and Ackley (1983), we pose the following question: how do specific external (air and ocean) forcings affect the ice expansion and decay cycle in the Weddell Sea region? To address this question, we consider sensitivity studies of a sea-ice model to the external thermal forcing terms of air temperature, ocean heat flux and relative humidity variations. These three variables, plus solar radiation and cloud cover, comprise the thermal inputs for sea ice. Solar radiation is well defined, has a in-variable annual cycle and is included in the model at 6 hour interval averages. Cloud cover can vary widely, is estimated poorly and understood very little.
The three variables examined here fall between being constant (and well defined) and wildly variable (and not understood); they are examined in this paper as a collective. Based on results from a more comprehensive model study (Reference GeigerGeiger, 1996), increasing the temporal resolution of the input fields from daily to 6 hour time intervals has a far greater impact on the response of the seasonal cycle of sea ice than does an increase in spatial resolution from 200 to 50 km. This result allows for a considerable reduction in computational time, and enables an efficienl series of sensitivity studies. For this reason a relatively low spatial-resolution (200 km) model with high temporal-input field resolution (4 times a day) is used in the simulations presented here. The sensitivity responses of sea ice to sub-daily atmospheric and radiation forcing conditions presented here have not been well investigated previously. The emphasis of this study is to identify in relative terms how external factors affect sea-ice growth and decay processes. By looking specifically at the response of sea ice to each imposed condition, the intent is to identify the response of the ice prior to the onset of feedback processes to get a first order look at how sea ice reacts to these imposed conditions.
Overview of the Numerical Model
Numerical sea-ice sensitivity studies were conducted for the Weddell Sea pack ice (80°S–55°S by 60°W–20°E) at 200 km spatial resolution using the Reference HiblerHibler (1979) dynamic-thermodynamic sea-ice model employing a viscous–plastic rheology with pressure relaxed to the origin (Replacement Method in Reference IpIp, 1993; Reference Hibler, Ip, Dempsey and RajapakseHibler and Ip, 1995). For details of the numerical formulation see Reference Zhang and HiblerZhang and Hibler (in press) ad Reference GeigerGeiger (1996). The European Centre for Medium-Range Weather Forecasts (ECMWF) air temperature and pressure fields are used as input forcing at 6 hour intervals for 1992 while 1991 fields are used to spin-up the model. Model results are compared to observed ice-edge estimates obtained from satellite analyses conducted by the Navy-National Oceanic and Atmospheric Administration (NOAA) National Ice Center (NIC) as archived at the Nalional Snow and Ice Data Center (NSIDC).
Temporally constant ocean currents were generated from a composite for the Weddell Sea region based on geo-strophic estimates from steric height anomaly contours from Plate 56 in Reference Olbers, Gouretski, Seiss and SchroterOlbers and others (1992), from 1992 Ice Station Weddell (ISW) current measurements, and from subjective interpretation (Reference GeigerGeiger, 1996). A temporally varying mixed-layer depth was generated using sinusoidal interpolation between 20 m on 1 February and 100 m on 1 August based on measurements from Reference GeigerGordon and Huber (1990). For oceanic heat fluxes, estimates from ISW measurements (Reference Lytle and AckleyLytle and Ackley, 1996) show about 7 W m−2 in the western Weddell Sea (about 60° W –40° W) in winter. From Reference Gordon and HuberGordon and Huber (1990) a winter heat flux value below the ice of about 37 W m−3 is estimated for the eastern Weddell (about 20° W–10° E). In the summer, an average value of about 2 W m−2 for the entire region is typical (Reference Parkinson and WashingtonParkinson and Washington, 1979). Using these values, with linear interpolation between 40° W and 20° W, we generated a longitudinal heat-flux distribution. Local temporal variations between summer and winter values were then used with the same sinusoidal interpolation method as for the mixed-layer depth, Relative humidity is based on climatological 30 year monthly mean surface dewpoint and air temperature from Reference Talijaard, van Loon, Crutcher and JenneTaljaard and others (1969).
The three forcing parameters (air temperature, ocean heat flux and relative humidity) examined in this paper are input variables to the surface heat budget equation used to compute growth:

where





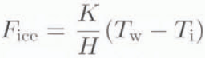
A is the albedo and C is the fractional cloud, F sw and F 1w are the shortwave and longwave radiation terms; F sh and F 1h are the sensible and latent heat fluxes; F bb is blackbody radiation emitted from the ice and open water areas; F ice is the conductive heat flux through the ice; F ocean is the specified oceanic heat flux: T is temperature (K); q is the specific humidity; and V is velocity with subscripts a. i, and w specifying air, ice and water values, respectively. Terms in square brackets are the arguments to the functions specified to their left. In areas of open water, the mixed-layer temperature replaces the ice temperature. Coefficinets D 1 and D 2 are respectively the bulk sensible and latent heat transfer coefficients; D 3 is the Stefan–Boltzmann constant times the surface emissivity; K is the ice conductivity; H is the ice thickness; and RH is the relative humidity. Q is the time-averaged local radiation flux defined by:
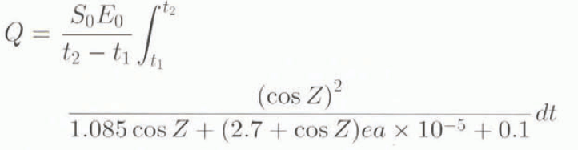

S
0 is the solar constant equal to 1353 W m−2;
E
0 the eccentricity correction given in Equation (1.2.1) in Reference Iqbal and IqbalIqbal (1983);
 is latitude and
 is the declination in degrees as given in Equation (1.3.1) in
Reference Iqbal and IqbalIqbal (1983). H A is
hour angle (15° times noon-local apparent time) and ea is the
vapor pressure. Monthly average cloud cover is interpolated from figure 9 in
Reference Parkinson and WashingtonParkinson and Washington (1979). This
budget is the same as that used in Reference HiblerHibler
(1980) and is further described in Reference GeigerGeiger (1996) and Reference Parkinson and WashingtonParkinson and
Washington (1979).
Response and Sensitivity to Air Temperature
Thermal contributions to the expansion and decay of sea ice depend on the freezing and melting points of sea ice, which are not the same. Sea ice freezes with the onset of winter at sea-water freezing point, depending on salinity, around –2°C or 271 K (Reference Weeks, Ackley and UntersteinerWeeks and Ackley, 1986). During the winter season, ice undergoes a continuous leaching process expelling salt from the ice, so that by spring melt, the ice thaws at a temperature closer to 0°C or about 273 K, which is the melting point of fresh-water ice (Reference Weeks, Ackley and UntersteinerWeeks and Ackley, 1986). This phase-change temperature dependence significantly affects the relation of air temperature to the annual decay and expansion of sea ice. We examine this dependence and the response of the ice edge to different temperature scenarios by looking at temporal changes in ice thickness and air temperature along a 28°W north–south transect.
The case of atmosphcric-only input (no ocean current or heat flux and a constant 60 m mixed-layer depth) using the original ECMWT temperature field, is shown in the middle panel of Figure 1 for the 1992 annual cycle at 6 hour time intervals. The two cases of a 2 K air-temperature increase (Fig. 1, upper panel) and decrease (Fig. 1, lower panel) are also shown. Monthly averaged air-temperature contours of 271 K (the freezing point of sea ice) and 273 K (the melting point of fresh water) are the dotted and dashed lines, respectively.
Ice-thickness sensitivity to air temperature along a 28°W transect using 6 hour interval ECMWF atmospheric input fields, both unaltered (middle panel) and modified by ±2K (upper and lower panels). Solid contours are m of ice thickness: the dotted 271 K (ice freezing) air temperature; the dashed 273K (ice melting) air temperalure.
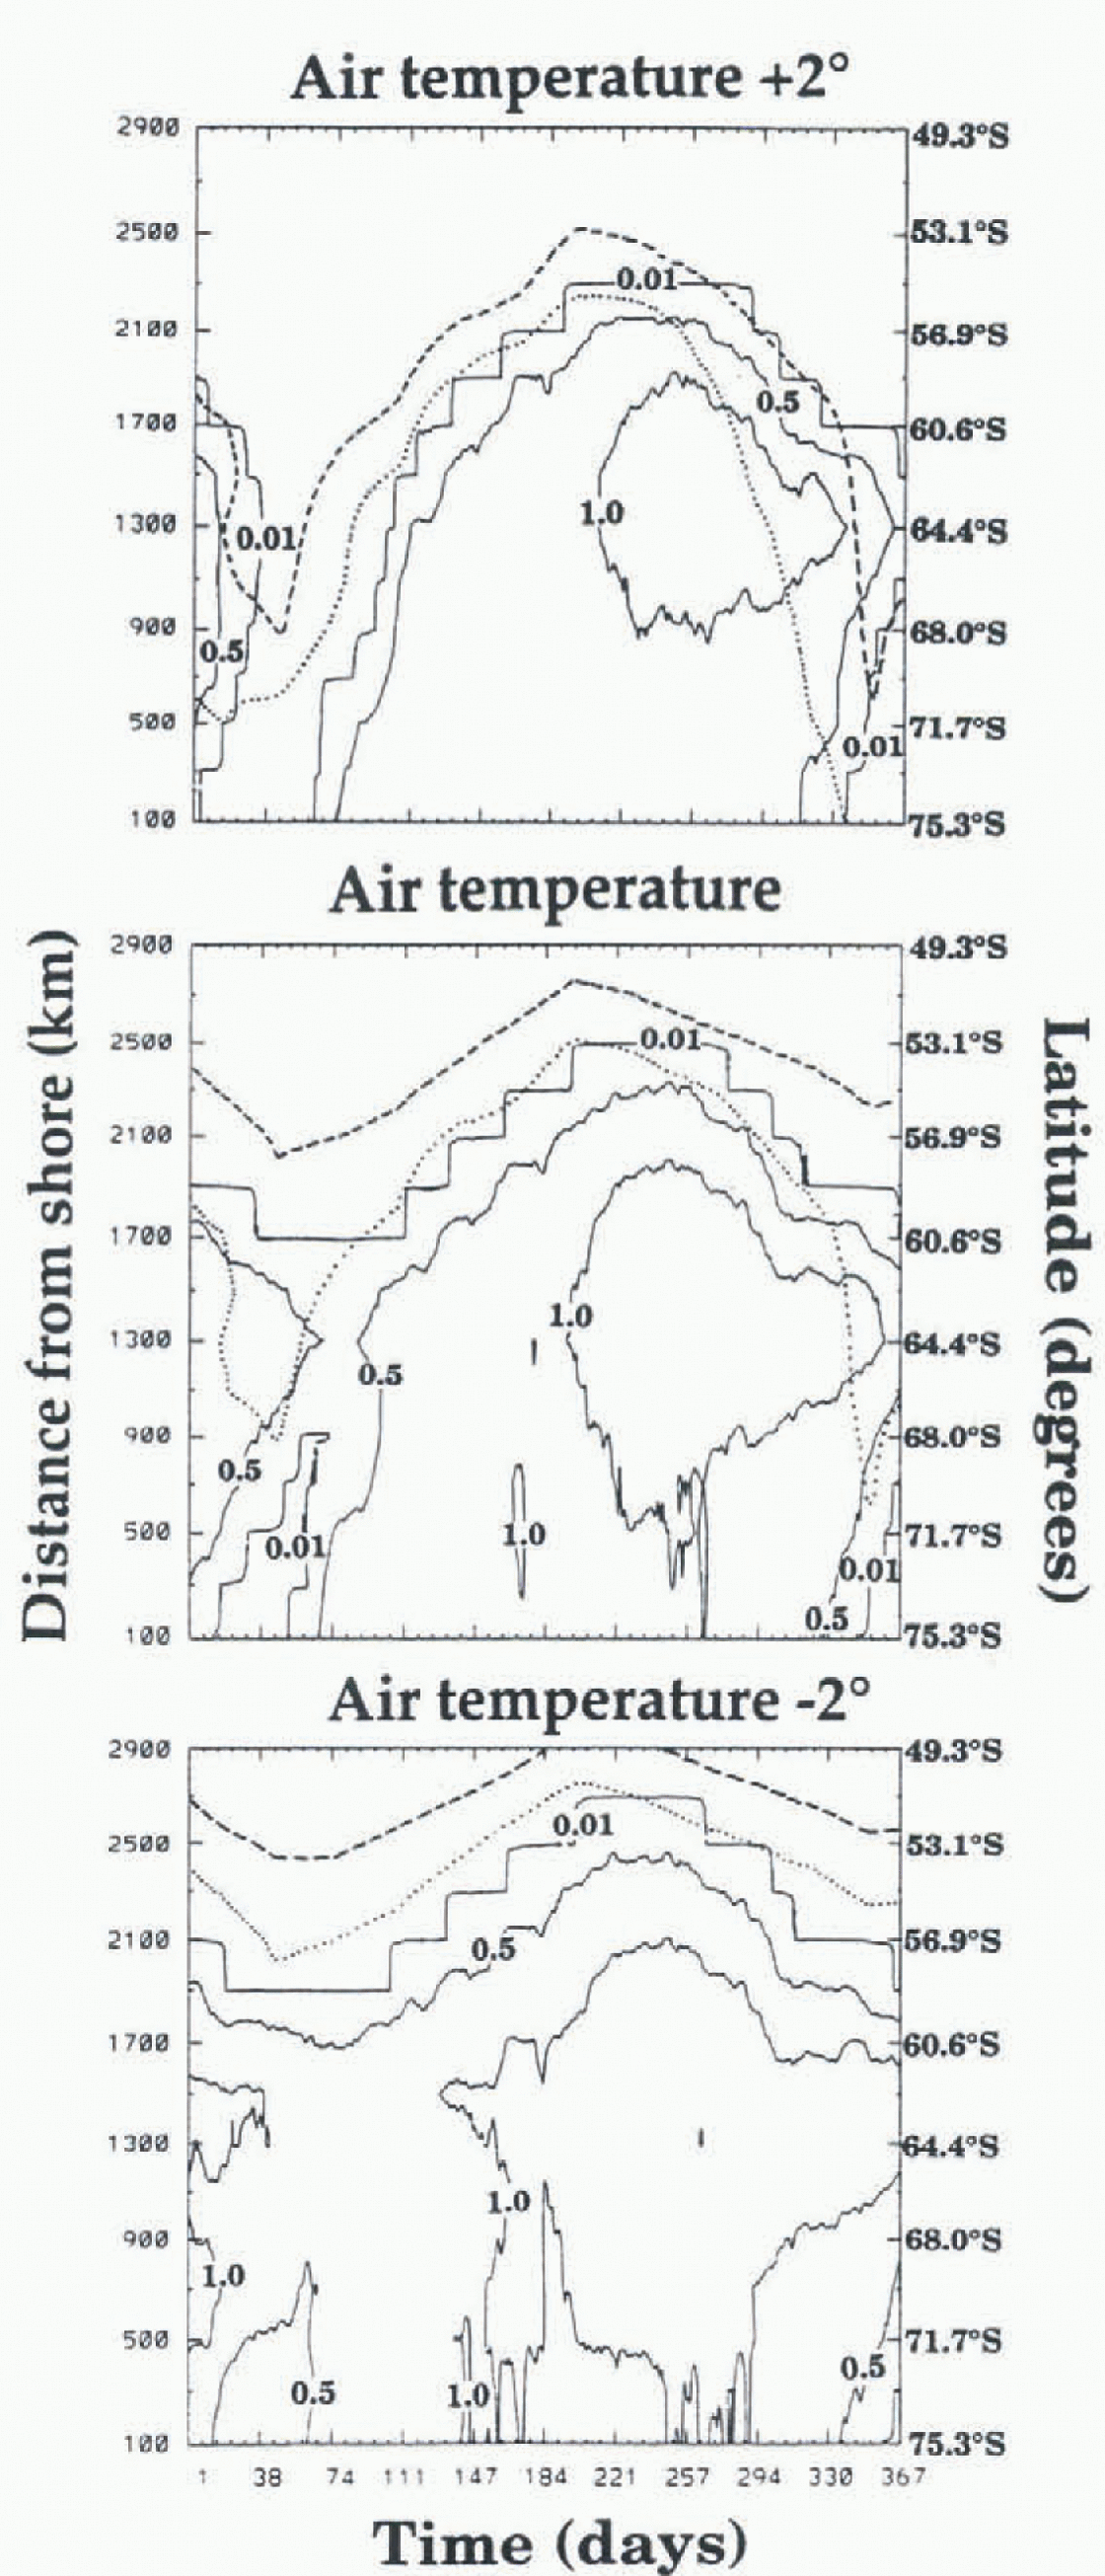
Beginning with the original ECMWF air-temperature fields (middle panel), an ice-edge decay and expansion emerges with an annual cycle offset (phase shifted) from the annual cycle in air temperature, The delay of ice expansion is partially due to the thermal inertia of the mixed layer. During expansion, the ice edge is south of the freezing line, while during the decay, the ice edge lies between the air-temperature lines where ice melts and freezes, with air-temperature changes preceding the ice response. The transect is located in a region that becomes ice free along the coast in February (see the presence of the 0.01 m contour along the coast between days 10 and 45 in the middle panel).
If air temperature is increased uniformly in both space and time by 2 K (Fig. 1, upper panel), the location of the 271 K air-temperature contour from the original dataset instead becomes the 273 K air temperature contour. A consequent reduction of 200 km in the maximum extent of sea ice in winter occurs. Open water along the coast, combined with increased global air temperature, also completely eliminates ice along this transect for all of February (days 31–60). This meltback occurs in a location that had a minimum ice extent of 800 km (900–1700 km from the shore) under standard atmospheric conditions (middle panel). Decreasing the air temperature by 2 K (Fig. 1, lower panel) uniformly in space and time extends the ice edge about 200 km further north than for the standard atmospheric dataset, and removes the presence of open water in summer along the coast. The summer minimum extent during the decreased-temperature case similarly is increased by about 200 km. These cases illustrate that the ice responds linearly in maximum ice extent relative to air-temperature change. Additionally, the summer meltback is particularly sensitive to combined feedback responses between air temperature and local dynamics, and has a positive feedback response to temperature changes near the melting point, as occur during that period.
Air temperature plays a role at the onset of the decay process by reducing ice thickness. This initial process sets off a series of thermodynamic and dynamic processes. Air-temperature increases contribute to heat storage in the mixed layer, and hence the oceanic dynamics. The combined ocean and at mospheric conditions then work together to melt the ice to form open water, which then changes the albedo. Additional feedbacks to the atmosphere, not considered here, can then also follow. For example, thermal atmospheric changes could induce atmospheric pressure changes and hence wind changes, thereby creating or destroying leads and redistributing the compactness and thickness of the sea-ice field. Since most of the Southern Ocean is covered with relatively thin ice, particularly along its wide outer margin (300–1000 km in extent from the shore), the albedo changes are particularly extensive. In the Arctic, an analogous process involving melt pond formation in much thicker ice, with increasing temperatures, is followed by feedback radiative heating. Since melt ponds do not exist in the Antarctic (due to its lower relative humidity; Reference Andreas and AckleyAndreas and Ackley, 1982), the analogue of the Arctic melt pond is the extensive melt-back of thinner ice (<0.5m) in the Antarctic that proceeds directly to open water. Radiative heating processes, in turn, impact dynamics, thermodynamics and the albedo from which a feedback loop ensues. Hence air temperature acts as an activator in both the melt-back process and ice-expansion processes.
Ocean Heat Flux Sensitivity
Examples of the two dimensional (2-D) distribution of 7 day average ice thickness are shown in Figure 2. An atmospheric-only case (Fig. 2, left panels), with no ocean heat flux or ocean current and a 60 m fixed mixed layer, shows modeled ice exceeding the observed 7 day composite ice edge to the northeast in March, and in general everywhere during the maximum extent in August. For the standard model (Fig. 2, right panels) including ocean heat flux, geostrophic current and a variable mixed-layer depth, a similar ice-edge extent during the maximum in August is seen, but there is less extent of ice in March, more closely corresponding to the observed ice edge. There is also an overall thinner ice-thickness distribution. A sensitivity study examining the response of the ice to ocean heat flux (Fig. 3), clarifies this response. A small amount of uniform ocean heat flux (2 W m−1), has negligible impact on the ice edge vs the at mospheric-only case, but a slight impact on the ice-thickness distribution during both minimum and maximum extent (e.g. comparing the location of the 1.0 m and 1.8 m contours). Comparatively, the minimum ice-edge extent with a tenfold increase in ocean heat flux (20 W m 2, right panels in Fig. 3) is obviously further south in March at the onset of ice growth, while the ice edge is similar to the atmospherie-only case during the winter maximum. In terms of oceanic heat processes, the oceanic heat flux there-fore works in conjunction with the mixed-layer heat storage to reduce the ice thickness.
The 2-D 200 km resolution sensitivity study for the 1992 annual sea-ice cycle in the Weddell Sea. Atmospheric-only forcing is in the left panels (no ocean heat flux or current and constant 60 m mixed-layer depth). The standard case is in the right panels (6 hour interval wind and air temperature, monthly mean climatological relative humidity and geostrophic current, seasonally varying ocean heat flux and mixed-layer depth). Solid contours are m of ice thickness: the 1 m contour is bold for reference; the dotted line is the 271 K (ice freezing) air temperature; the dashed line is the 273 K (ice melting) air temperature; the dash-dot line is the NSIDC observed 1992 ice edge.
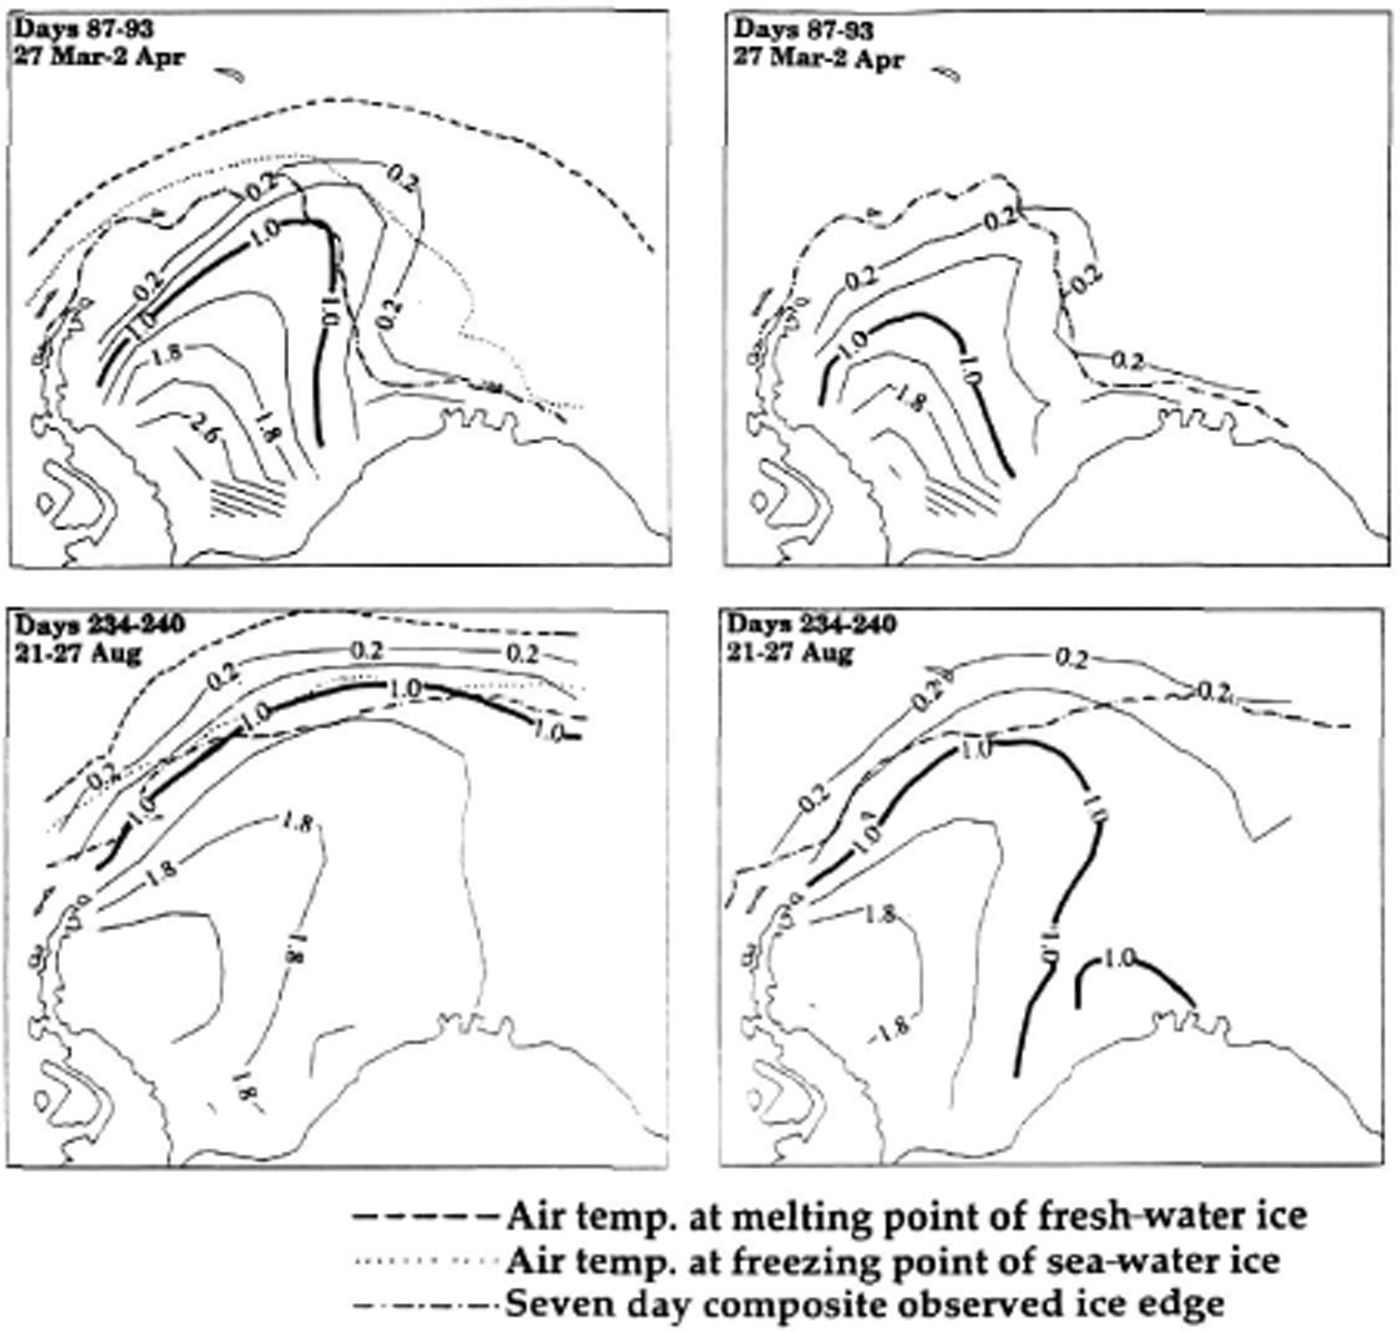
During the maximum extent period, the ice-edge extent changes little with ocean heat flux compared to atmospheric-only forcing, while the interior ice thickness becomes uniformly thinner everywhere during both minimum and maximum extent. In the summer, the oceanic heat flux is sufficient (despite being very low (2 W m2)) to reduce the extent of the ice edge where the ice is thin (e.g. March in Fig. 2). The ice-thickness distribution, particularly thin ice, is therefore much more sensitive to ocean heat flux than is the ice-edge winter advance and retreat (e.g. 0.2 m and 1.0 m thickness contours in Figs 2 and 3). With the variable heat flux in the standard case as described earlier, the eastern part of the Weddell Sea ice pack reflects of the higher oceanic heat flux case, while the western part reflects results from the lower heat flux case shown in Figure 3.
Ice-thickness sensitivity to low (2 W m−2 in the left panels) and high (20 W m−2 in the right panels) constant ocean heat flux for the 2-D–200 km resolution case. The dash-dot line is the NSIDC observed 7 day composite ice edge from the same 7 day period as the model; the solid contours are m of ice thickness.

Relative Humidity Sensitivity
Initial runs were made assuming constant relative humidity values for both low (40%) and high (90%) values, as seen in Figure 4. Using otherwise standard atmospheric and oceanie input fields, these produced unrealistic ice-extent results. While a lower relative humidity simulation seems to produce a reasonable ice extent along the coast of the Antarctic Peninsula, it overshoots the observed ice edge elsewhere, especially for the winter months. Contrary to this, a high humidity case (90%) is reasonable in repreducing the observed ice edge during winter months, but excessively reduces the ice in the summer months. Humidities were not available from the ECMWF fields used for the atmospherie forcing, so a spatially variable relative humidity field, rather than a constant one, was derived using the dewpoint and air temperatures from the climatological 30 year monthly mean data of Taljaard and others (1969). Using this information, a monthly average regional distribution of relative humidity was computed, linearly interpolated to 6 hour in terval input fields, and then used in the heat budget for the standard run (Fig. 2, right panel).
The 2-D model output for two different cases of constant relative humidity and otherwise standard atmospheric and oceanic input fields. The left and right panels show cases of relative humidity (RH) at 40 and 90%, respectively. The dash-dot line is the NSIDC observed 7 day composite ice edge from the same 7 day period as the model; solid contours are m of ice thickness.

To understand this response further, we examine ice growth sensitivity to relative humidity (RH) as it affects the latent heat (Equation (5)). We can rewrite Equation (5) as:

The approximation comes about because, in this form, the formula for
q
a and q
i is the same except for their respective temperatures such that
 for relatively small differences between air temperature and
surface ice temperature. For RH close to 1, this yields a
small latent heat flux relative to the sensible heat flux because
(RH – 1) approaches zero. Conversely, as
RH decreases, (RH – 1) becomes an
increasingly more negative number and the latent heal magnitude increases.
Since the sensible heat flux is unaffected by RH, the change in latent heat is responsible for the ice growing rapidly at lower relative humidities and slowly at higher humidities. A smaller RH in regions of sub-freezing temperatures therefore results in more ice growth. Furthermore, the sensitivity results show that the ice-thickness distribution in the interior of the pack during winter (August in Fig. 4) is only marginally different at 40% vs 90% RH for thicknesses of 1.0 1m) or more, but the ice edge and thinner ice (<0.671m) are much further north in the RH = 40% ease. Therefore, it is the thin ice and open water during the advance, and the thin ice during the decay, which are being impacted by the relative humidity in the annual cycle.
Along the dry continent of Antarctica relative humidity is low, while moist air of marine origin is located closer to the ice edge. Because of the presence of a dry central continent in the Antarctic region, the seasonal sea-ice cycle is subjected to a greater range of humidity than the Arctic, which is typically close to 90% relative humidity year round. The presence of melt ponds in the summer in the Arctic vs a lack of melt ponds in the Antarctic (Reference Andreas and AckleyAndreas and Ackley, 1982) further substantiates the lower humidity seen in the western Weddell Sea relative to the Arctic. Hence the need for high-quality humidity data in input fields is more critical for sea-ice modeling in the Antarctic than in the Arctic.
A test to illustrate this effect is shown in Figure 5 using the standard model. Climatological monthly average relative humidity at the tip of the Antarctic Peninsula ranges from 80% to > 90%. Also in this region, the standard model poorly predicts the northward ice margin near the Peninsula coast during the summer months (Fig, 2, right panel), a difficulty not atypical of ice models in the Weddell Sea (Reference Hibler and AckleyHibler and Ackley, 1983). By reducing the humidity near the continent to 40% (boxed area in Fig.5) we obtain an increase in ice growth in summer along the Peninsula compared to the standard run (Fig. 2), producing an ice edge closer to the observed. Increasing the local northward ocean current along the Antarctic Peninsula (by 7 cm s −1) is also capable of increasing the northern extent of the ice growth there (Reference GeigerGeiger, 1996). While the humidity may not be the only reason for the lack of good correlation in summer months between models and observed ice at the northern tip of the Peninsula, it is a likely candidate to explain the discrepancy.
The 2-D model sensitivity to low relative humidity along the Antarctic Peninsula. Model inputs are the same as the standard case except for constant low humidity (RH = 40%) in the dotted box area. The solid contours are m of ice thickness; dash-dot line is the NSIDC observed 7 day composite ice edge.
Discussion and Summary
Ice-edge and ice-thickness distribution were used to determine responses and relative differences caused by the specific thermal input variables of air temperature, ocean heat flux and relative humidity. Air temperature dominates ice-edge extent during the winter months. The difference in ocean heat flux values between the eastern and western areas of the Weddell Sea indicate that minimum ice extent and overall thickness were both reduced by increased ocean heat flux with responses in the eastern Weddell Sea being particularly sensitive to the high heat fluxes currently observed there. Later stages of ice-edge retreat and earlier stages of expansion (summer months) are sensitive to relative humidity, which affects the latent heat flux. Because of the presence or absence of the cold dry air along the Antarctic Peninsula, relative humidity sensitivity was most noticeable there, such that the case with an imposed RH = 40% along the coast produced the best results compared to observed ice-edge composites.
In terms of sea-ice response to climate changes, increases and decreases in mean air temperature can significantly affect the ice-edge extent. In this respect, air temperature acts as an activator for the seasonal meltback by preconditioning the system such that albedo feedback, radiative heat transfer and dynamic processes begin once significant amounts of open water form. Events that increase ocean heat flux will reduce the overall ice-thickness distribution, but have little effect on the maximum ice-edge extent during the winter months. It will, however, be very difficult to detect these ice-thickness changes using remote sensing unless the ice becomes critically thin, and an overall catastrophic melt-back occurs. On the other hand, if increased atmospheric temperatures also lead to an overall increase in atmospheric moisture, the latent heat transfer from air to ice, as well as the sensible heat, will be altered. In this scenario ice-edge extent would be changed considerably, and would probably be readily detectable by current satellite monitoring methods. These findings emphasize the need for comparison of both ice-edge location and interior ice-thickness distribution in model validation. The ice-thickness distribution is the more critical and sensitive variable to variations in oceanic forcing, while ice extent responds more directly to atmospheric forcing changes.
Acknowledgements
This work was made possible by grants from the NSF (No. OPP-9024809 and DPP-9203470) and ONR (No. N0014-93-1-1221). Our thanks to ECMWF for the analysis fields made available by C. Kottmeier (AWI) in Brmerhaven, Germany, to C. Hanson at NSIDC who provided the Navy-NOAA NIC ice edge information, and J. Waugh for technical support at the Thayer School of Engineering.



