INTRODUCTION
Cellulose in tree rings preserves an archival record reflecting the carbon isotope content of the atmosphere. In long-lived species with broad annual rings, it is possible to extract sufficient carbon for high-precision liquid scintillation measurement of 14C content in single rings, in addition to routine measurement of δ13C. Examples include records for Douglas fir (Pseudotsuga menziesii) sampled in the Pacific Northwest, USA, for tree rings spanning the interval AD 1500–1953 (Stuiver and Braziunas Reference Stuiver and Braziunas1993; data republished with corrections by Stuiver et al. Reference Stuiver, Reimer and Braziunas1998), for the giant sequoia (Sequoiadendron giganteum) of California for the years AD 1065–1150 (Damon et al. Reference Damon, Eastoe, Hughes, Kalin, Long, Peristykh, Mook and van der Plicht1998) and AD 1688–1710 (Damon et al. Reference Damon, Eastoe and Mikheeva1999). More recently, high-precision data measured by accelerator mass spectrometry (AMS) have been presented for single tree rings from Japanese cedar (Cryptomeria japonica) for AD 600–1021 (Miyake et al. Reference Miyake, Nagaya, Masuda and Nakamura2012, Reference Miyake, Masuda and Nakamura2013a, Reference Miyake, Masuda and Nakamura2013b) and AD 1415–1629 (Miyahara et al. Reference Miyahara, Masuda, Furuzawa, Menjo, Muraki, Kitagawa and Nakamura2004, Reference Miyahara, Masuda, Muraki, Kitagawa and Nakamura2006, Reference Miyahara, Masuda, Nagaya, Kuwana, Muraki and Nakamura2007), and from European oak for AD 1010–1110 (Güttler et al. Reference Güttler, Wacker, Kromer, Friedrich and Synal2013). In other cases, where material was insufficient for annual measurement or where annual samples were not feasible over a long time interval, 14C content has been measured in decadal and bidecadal tree-ring samples (e.g. Stuiver and Becker Reference Stuiver and Becker1993, data republished with corrections by Pearson et al. Reference Pearson, Pilcher, Baillie, Corbett and Qua1986; Stuiver et al. Reference Stuiver, Reimer and Braziunas1998; Pearson and Qua Reference Pearson and Qua1993, data republished with corrections by and McCormac et al. Reference McCormac, Hogg, Higham, Lynch-Stieglitz, Broecker, Baillie, Palmer, Xiong, Pilcher and Brown1998). Reimer et al. (Reference Reimer, Baillie, Bard, Bayliss, Beck, Bertrand, Blackwell, Buck, Burr and Cutler2004) discussed the reasons for corrections to early datasets.
Such datasets have been applied (1) to the calibration of the radiocarbon time scale (Stuiver and Becker Reference Stuiver and Becker1993); (2) in conjunction with measurements of 10Be in ice cores (Oeschger and Beer Reference Oeschger and Beer1990; Raisbeck et al. Reference Raisbeck, Yiou, Jouzel and Petit1990; Bard et al. Reference Bard, Raisbeck, Yiou and Jouzel1997; Beer et al. Reference Beer, McCracken and von Steiger2012), to the identification and explanation of abrupt, cyclic and secular changes in atmospheric 14C content (Damon and Sonnett Reference Damon, Sonnett, Sonnett, Giampapa and Matthews1991, and references therein); and (3) to examining connections between changes in the solar magnetic field and modulation of 14C production at multi-decadal time scale (Miyahara et al. Reference Miyahara, Yokoyama and Masuda2008). Changes in the 14C content of the atmosphere at Earth’s surface reflect changes in the rate of generation of 14C in the upper atmosphere, and also in the distribution of CO2 among near-surface reservoirs (Damon and Sonnett Reference Damon, Sonnett, Sonnett, Giampapa and Matthews1991; Stuiver and Braziunas Reference Stuiver and Braziunas1993).
Datasets with annual resolution have been searched for evidence of short-term changes in the rate of generation of 14C, such as might result from the 11-yr Schwabe cycle of solar activity (Stuiver and Braziunas Reference Stuiver and Braziunas1993; Miyahara et al. Reference Miyahara, Masuda, Furuzawa, Menjo, Muraki, Kitagawa and Nakamura2004, Reference Miyahara, Masuda, Muraki, Kitagawa and Nakamura2006, Reference Miyahara, Masuda, Nagaya, Kuwana, Muraki and Nakamura2007, Reference Miyahara, Yokoyama, Yamaguchi, Kosovichev, Andrei and Rozelot2009), from supernovae (SN) in the galactic neighborhood (Damon et al. Reference Damon, Dai, Kocharov, Mikheeva, Peristykh, Cook, Harkness, Miller and Scott1995a, Reference Damon, Kocharov, Peristykh, Mikheeva and Dai1995b), or from solar proton events (SPEs) generated by giant solar flares (Miyake et al. Reference Miyake, Nagaya, Masuda and Nakamura2012, Reference Miyake, Nagaya, Masuda and Nakamura2013b). Recent interest has focused on an abrupt increase of 14‰ in Δ14C at AD 774–775 (Miyake et al. Reference Miyake, Nagaya, Masuda and Nakamura2012) and another of 9‰ at AD 994–995 (Miyake et al. Reference Miyake, Masuda and Nakamura2013b). The AD 774–775 event was global in effect (Jull et al. Reference Jull, Panyushkina, Lange, Kukarskih, Myglan, Clark, Salzer, Burr and Leavitt2014). Explanatory hypotheses include an SPE, a gamma-ray burst from beyond the solar system, and collision of a comet with the Sun or the Earth; of these, an SPE appears most plausible (Jull et al. Reference Jull, Panyushkina, Lange, Kukarskih, Myglan, Clark, Salzer, Burr and Leavitt2014, and references therein).
The contribution of solar luminosity cycles to climate change is receiving close scrutiny in the context of present climate change (Masson-Delmotte et al. Reference Masson-Delmotte, Schulz, Abe-Ouchi, Beer, Ganopolski, González Rouco, Jansen, Lambeck, Luterbacher, Naish, Stocker, Qin, Plattner, Tignor, Allen, Boschung, Nauels, Xia, Bex and Midgley2013; Myhre et al. Reference Myhre, Shindell, Bréon, Collins, Fuglestvedt, Huang, Koch, Lamarque, Lee, Mendoza, Stocker, Qin, Plattner, Tignor, Allen, Boschung, Nauels, Xia, Bex and Midgley2013). In this context, long-term trends in δ13C are of interest because δ13C records in tree rings are used in climatic reconstructions (Leavitt Reference Leavitt2010 and references therein). None of the tree-ring archive studies cited above included a δ13C dataset with the published 14C record, notwithstanding the necessity of measuring δ13C in order to correct the 14C measurements (Stuiver and Polach Reference Stuiver and Polach1977). Stuiver and Braziunas (Reference Stuiver and Braziunas1987) considered a 2000-yr dataset of δ13C measurements in tree rings at decadal resolution, without reference to 14C measurements. Shorter-term studies of δ13C in sub-annual portions of tree rings, preferably samples from multiple individuals in a study area, are a staple of dendrochronology (Leavitt Reference Leavitt2010).
In this article, we present the results of a study initiated by the late Professor Paul Damon in the 1980s. The study has produced high-precision measurements of 14C and routine measurements of δ13C in annual tree-ring samples from a giant sequoia for the years AD 998–1510. Objectives of the study included (1) assembly and time-series spectral analysis of the high-precision dataset; (2) analysis of the differences between the new dataset and a set of decadal measurements (Stuiver and Becker Reference Stuiver and Becker1993) spanning the same time interval; (3) interpretation of short-term fluctuations in the 14C data in the context of identifying decadal and shorter events such as supernovae, giant solar flares and the Schwabe cycle; and (4) examination of the relationship of δ13C and Δ14C records and its implications for climate change.
BACKGROUND
Study Area
Material for the study was obtained from a fallen sequoia in the Big Stump Grove (36.75°N, 118.97°W, altitude 1850 m above sea level, masl) in the southern Sierra Nevada Mountains, California, USA. Prior dendrochronological studies in the area include determinations of temperature over the past 2000 yr from Pinus balfouriana collected at the tree-line at Cirque Peak, about 70 km southeast of Big Stump grove (Scuderi Reference Scuderi1993), and determinations of temperature and precipitation records over the past 1000 yr from Pinus balfouriana and Juniperis occidentalis at tree-line sites, 3300–3400 masl, between 40 and 60 km southeast of Big Stump Grove (Graumlich Reference Graumlich1993). The derived temperature records differ greatly. Hughes et al. (Reference Hughes, Touchan, Brown, Dean, Meko and Swetnam1996) presented a multi-millennial tree-ring chronology for sequoias from multiple locations, and noted the consistency of low-growth years between sites. Hughes and Brown (Reference Hughes and Brown1992) interpreted low-growth years in terms of drought frequency in central California since 101 BC. Swetnam and Baisan (Reference Swetnam, Baisan, Veblen, Baker, Montenegro and Swetnam2003) evaluated the record of fire preserved in tree rings from the Big Stump Grove and neighboring sequoia groves, finding the highest frequency of widespread fire in the interval AD 1000–1200. Craig (Reference Craig1954) presented a set of δ13C values for the central wood of tree rings from a sequoia from Springville, California, representing the period 1072 BC to AD 1649. The samples are spaced at intervals of 50 yr or more since AD 1000.
Previous Work on the Current Dataset
Several progress reports have arisen from parts of the dataset, which was collected between 1992 and 2006. Spectral analysis of the data for the Late Medieval Solar Maximum was presented by Damon et al. (Reference Damon, Eastoe, Hughes, Kalin, Long, Peristykh, Mook and van der Plicht1998) and Damon and Peristykh (Reference Damon and Peristykh2000). A pattern of 14C data thought to correspond to the SN of AD 1006 was discussed by Damon et al. (Reference Damon, Dai, Kocharov, Mikheeva, Peristykh, Cook, Harkness, Miller and Scott1995a, Reference Damon, Kocharov, Peristykh, Mikheeva and Dai1995b) and Damon and Peristykh (Reference Damon and Peristykh2000). Kalin et al. (Reference Kalin, McCormac, Damon, Eastoe and Long1995) compared annual 14C data for the 11th and 12th centuries with decadal data from other laboratories.
Contemporaneous Datasets
Stuiver and Becker (Reference Stuiver and Becker1993) presented high-precision decadal 14C data for tree rings spanning the interval 6000 BC to AD 1950. These and decadal or bidecadal data of Pearson and Qua (Reference Pearson and Qua1993) overlap the annual data presented here, and form the basis of calibration of the last 8000 yr of the radiocarbon time scale. The AMS data of Miyake et al. (Reference Miyake, Masuda and Nakamura2013a) and Miyahara et al. (Reference Miyahara, Masuda, Furuzawa, Menjo, Muraki, Kitagawa and Nakamura2004) overlap the present dataset from AD 998–1021 and AD 1415–1510.
Cosmogenic Isotopes, Solar Activity, and Climate
It has long been recognized (Damon and Sonnett Reference Damon, Sonnett, Sonnett, Giampapa and Matthews1991 and references therein) that records of cosmogenic isotopes archived at Earth’s surface reflect interaction of three groups of factors: (1) long-term changes in the dipole moment of Earth’s magnetic field, (2) changes in the fluxes of cosmic radiation and charged particles of solar origin, modulated by interaction of the solar wind with Earth’s magnetic field, and (3) changes in the geochemical cycle of each cosmogenic isotope. The following summary of the interplay of these factors for the isotopes 10Be and 14C is based on Beer et al. (Reference Beer, McCracken and von Steiger2012, Chapter 17).
After low-pass filtering, time series of 10Be and 14C show similar form at the time scale of the Holocene (Bard et al. Reference Bard, Raisbeck, Yiou and Jouzel1997; Figure 17.3.2–1 of Beer et al. Reference Beer, McCracken and von Steiger2012), and since AD 1600 (Figure 17.2.1–1 of Beer et al. Reference Beer, McCracken and von Steiger2012). In the latter case, the time series can be compared with sunspot numbers, a direct measure of solar activity. The production rate of each isotope is inversely related to sunspot number. High sunspot number corresponds to high solar luminosity, the luminosity being the net sum of radiation increases due to bright solar faculae and decreases due to dark sunspots. Higher solar activity also corresponds to high intensity of the solar wind, leading to attenuation of the flux of galactic cosmic rays into Earth’s upper atmosphere. High solar activity therefore leads to two interdependent effects on Earth: decreased abundance of cosmogenic isotopes, and increased total solar irradiance (TSI). The 10Be time series, archived in stratified polar ice, has the advantages of a close relationship with solar activity and little attenuation arising from the geochemical cycle of Be, but the disadvantage of imprecise chronology. The 14C time series, archived in tree rings, has the advantage of precise chronology. However, the signal 14C originating from cosmogenic production is attenuated and delayed relative to the 10Be signal as a result of cycling of carbon among surface reservoirs, particularly transfers to and from the deep oceans. Attenuation and phase-shift are functions of the period of the cosmogenic production signal, and have been estimated from 5-box and 3-box models of the surface carbon cycle (Houtermans et al. Reference Houtermans, Suess and Oeschger1973; Damon and Peristykh Reference Damon and Peristykh2004; Usoskin and Kromer Reference Usoskin and Kromer2005; Beer et al. Reference Beer, McCracken and von Steiger2012, Figure 13.5.3.2–2). The 14C time series as archived at Earth’s surface may be complicated by any modification of climate (leading to changes in the carbon cycle) arising from changing TSI (Damon and Sonnett Reference Damon, Sonnett, Sonnett, Giampapa and Matthews1991). Whether changes in solar activity affect climate significantly will be addressed in the Discussion.
METHODS
Wood samples were collected and subjected to dendrochronological analysis by researchers at the Laboratory of Tree-Ring Research at the University of Arizona. Individual tree-ring samples, ideally 40–60 g, were separated as chiseled flakes at the Laboratory of Tree-Ring Research, University of Arizona, under the supervision of Dr. Ramzi Touchan. Each sample represents much of the circumference of a whole tree-ring. The flakes were ground in a Wiley® mill. Cellulose was prepared from the wood in two stages: first, leaching of components soluble in a toluene-ethanol mixture in a Soxhlet® distillation apparatus; second, bleaching of remaining non-cellulose components in an aqueous solution of sodium chlorite. Ideally, the resulting fraction of cellulose amounted to 20–25 g. Details of the method are given in Kalin et al. (Reference Kalin, McCormac, Damon, Eastoe and Long1995).
In the intervals AD 1065–1070, 1073–1074, 1126–1135, 1143–1144, 1189–1190, and 1256–1265, the tree rings were narrow, requiring the combination of two rings to make a sufficient sample. Samples that were too small for liquid scintillation counting (AD 998–1024 and a few samples for which most of the cellulose was lost in laboratory mishaps), were measured on 3 to 5 graphite targets at the NSF-Arizona AMS facility. For the years AD 1096, 1136, 1366, and 1372, all sample material was lost and no measurements could be made.
Samples of sufficient size, ideally 7 g of benzene, were prepared for liquid scintillation counting (LSC) following a method designed to minimize impurities in the benzene product (Witkin Reference Witkin1992). Details of the method and characteristics of counting vials are provided as supplementary material, including Table S1.
Data are presented as Δ14C (Stuiver and Polach Reference Stuiver and Polach1977). An error (1σ) of ± 2‰ or better was routine for LSC over most of the study. Using standard statistical formulae, errors were calculated from machine error of a given measurement in combination with long-term statistics for standard and background measurements. In the interval AD 1065–1141, several samples have errors in the range ± 2.0 to 2.5‰. In the case of samples measured by AMS, results are presented as the mean, weighted for variance, of measurements on three or more targets, and the standard error of the mean. Errors of AMS data ranged from ± 2.5 to 4.7‰, the larger errors being limited to the interval AD 998–1024. Results were standardized relative to international standards Oxalic Acid I (LSC) and Oxalic Acids I and II (AMS).
Values of δ13C were determined on a portion of the CO2 prepared for 14C measurement and were used to correct the 14C data for variable isotope fractionation, for instance in photosynthetic uptake of CO2 as a result of climatic stress. Prior to 1995, the δ13C measurements were made using a modified VG® 602C dual-inlet gas source mass spectrometer, with an analytical precision (1σ) of 0.15‰. Since 1995, measurements were made on a Finnigan® Delta-S dual-inlet gas source mass spectrometer, with an analytical precision (1σ) of 0.10‰. Results were standardized relative to standards NBS 22 and USGS 24.
RESULTS AND COMPARISONS WITH OTHER DATASETS
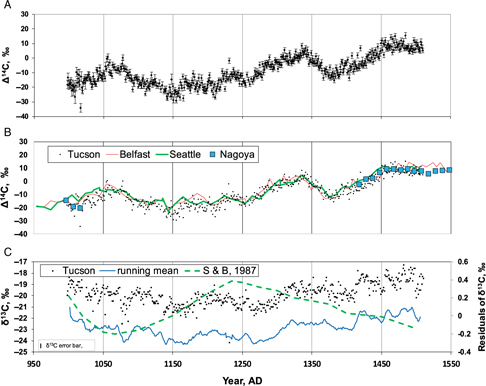
The data (supplementary Table S2) are presented as paired measurements of Δ14C and δ13C, and are depicted as a time-series of annual Δ14C and δ13C in Figure 1, where the data (referred to as the Tucson dataset below) are compared with (1) contemporaneous decadal data for Douglas fir samples, collected in the Pacific Northwest and measured at the University of Washington (the Seattle dataset: Stuiver and Becker Reference Stuiver and Becker1993; Stuiver et al. Reference Stuiver, Reimer and Braziunas1998), and (2) contemporaneous bidecadal data for Irish oak samples measured at Queen’s University, Northern Ireland (the Belfast dataset: Pearson et al. Reference Pearson, Pilcher, Baillie, Corbett and Qua1986; McCormac et al. Reference McCormac, Hogg, Higham, Lynch-Stieglitz, Broecker, Baillie, Palmer, Xiong, Pilcher and Brown1998). In Figure 2, the Tucson and Seattle annual datasets are combined with annual data (and some decadal data, or data averaged over decadal intervals, for clarity) from the Nagoya laboratory (Miyahara et al. Reference Miyahara, Masuda, Furuzawa, Menjo, Muraki, Kitagawa and Nakamura2004; Miyake et al. Reference Miyake, Nagaya, Masuda and Nakamura2012, Reference Miyake, Masuda and Nakamura2013a, Reference Miyake, Masuda and Nakamura2013b) to provide a record from AD 600 to 1953. Systematic differences exist between LSC Δ14C measurements from contemporaneous sets of tree rings from different continents, regardless of the laboratory that made the measurements (McCormac et al. Reference McCormac, Baillie, Pilcher and Kalin1995). An early evaluation based on non-corrected data from Seattle and Belfast and a partial Tucson dataset (Kalin et al. Reference Kalin, McCormac, Damon, Eastoe and Long1995) concluded that there was a satisfactory agreement between the Tucson and Seattle data, but noted a systematic offset between data from Tucson and Belfast. Damon et al. (Reference Damon, Eastoe, Hughes, Kalin, Long, Peristykh, Mook and van der Plicht1998) calculated a mean difference (non-corrected Seattle data minus Tucson data) of 1.0 ± 2.1‰ for decadal averages over the period AD 1065–1145, and concluded that the difference was well within error. Applying the same approach to the entire Tucson dataset and the corrected Seattle data, the average difference is 2.2 ± 3.2‰. The three datasets (Figure 1B) match in general, but show systematic differences over certain periods of several decades (Figure 3, for Seattle and Tucson data).
A. The Tucson Δ14C time series, with error bars (1σ). B. Comparison of the Tucson Δ14C time series (points) with the decadal Seattle and the decadal/bidecadal Belfast Δ14C time series (both represented as lines). C. The Tucson δ13C time series, with a 10-yr running mean displaced downward by 5‰. Also shown is the time series of average residuals of δ13C in a variety of North American tree species (Stuiver and Braziunas Reference Stuiver and Braziunas1987).

Annual and decadal Δ14C time series for tree rings since AD 600 (Tucson laboratory: this study; Seattle laboratory: Stuiver et al. Reference Stuiver, Reimer and Braziunas1998; Nagoya laboratory; some data expressed as decadal means: Miyahara et al. Reference Miyahara, Masuda, Furuzawa, Menjo, Muraki, Kitagawa and Nakamura2004; Miyake et al. Reference Miyake, Nagaya, Masuda and Nakamura2012, Reference Miyake, Masuda and Nakamura2013a, Reference Miyake, Masuda and Nakamura2013b), with a 3-yr running mean (displaced downwards by 12‰) for AD 998–1954. Named Grand Solar Minima and Maxima are shown. E(L)MSM = Early (Late) Medieval Solar Maximum, MOD SM = Modern Solar Maximum.

Time series of differences between the Seattle decadal dataset of Δ14C and the Tucson dataset expressed as decadal averages (Seattle minus Tucson), compared with a 10-yr running mean (rm) of the Tucson Δ14C time series.

For the Seattle measurements, each of which represents a single, high-precision decadal measurement, the typical standard deviation (1σ) is 2.5‰. For the decadal means calculated from the Tucson dataset, values of σ are calculated as standard errors of each decadal mean of Δ14C (supplementary Table S3). The typical value of σ for the difference (Seattle-Tucson) is between 2.6 and 2.9 ‰ (Table S3). The range of the decadal differences in Figure 3 is 14‰.
If the differences arose from measurement error only, their scatter as a function of time would be random. Such is not the case; whether the differences are depicted as individual points or moving averages, there appears to be a cyclic change in the magnitude of the differences, and the change is inversely related to the decadal means for the Tucson data (Figure 3). The cyclic variation of difference between the two datasets appears to be real, in that the extremes of difference are statistically different. Comparing the extended Tucson dataset with the Seattle decadal data suggests that systematic, cyclic differences, possibly climatic in origin, exist between the Pacific Northwest and the Sierra Nevada. The Tucson δ13C time-series (Figure 1C) shows a long-term change broadly matching that of the Δ14C data, and shorter cyclic variations.
SPECTRAL ANALYSIS
The data in the vicinity of the Late Medieval Solar Maximum have been detrended by (1) calculation of a smoothing spline for T = 200 yr (Figure 4) which has the effect of removing cyclic variations of T/2 or less, and (2) subtraction of the spline from the dataset, leaving the short-period cycles without long-term trends (Figure 5). A period near 55 yr is clearly seen, along with cycles with T near 10 yr. This shorter cycle has intervals of low amplitude near AD 1130 and 1240, suggesting amplitude modulation with T near 110 yr.
Δ14C data for the Late Medieval Solar Maximum: Tucson dataset, annual data (points) with a smoothing spline (line) with gain 0.95 and a period of 200 yr.

Δ14C data for the Late Medieval Solar Maximum: Tucson dataset, annual data, detrended by subtraction of the smoothing spline in Figure 4.

Discrete Fourier Transformation (DFT) of the detrended data (modified by subtraction of the smoothing spline for T= 200 yr) shows strongest peaks at 126, 91, 56, 17.6, 13.6, 10.4, and 7.1 yr (Figure 6). Amplitudes < 0.5 units appear to be noise; only peaks of greater amplitude are labeled with the corresponding period in years. Periods less than 5 yr are probably spurious.
Discrete Fourier Transform power spectrum of the detrended Tucson Δ14C dataset. Larger peaks are labeled with the corresponding period in years.

The distribution of short-T variations in time can be seen in the spectrogram (Figure 7) constructed using a 77-yr moving window. Periods near 7 yr are most in evidence during the interval AD 1320–1450. Periods of 10–17 yr are most prominent during the interval AD 1000–1120. A 56-yr period persists between AD 1000 and 1200 and from 1350 to 1400, but is weak or absent at other times.
Spectrogram of Tucson Δ14C data (frequency vs. time plot showing contours of Discrete Fourier Transform spectral amplitude for a 77-yr time window). Yellow and enclosed colors indicate high amplitudes. Horizontal dashed lines mark prominent periods.

COMPARISON WITH ANNUAL DATA, AD 1510–1954
Considering cyclicities between the 88-yr Gleissberg cycle and 5 yr, Stuiver and Braziunas (Reference Stuiver and Braziunas1993) noted periods of 56, 26, 17, 13.2, 10.4, 6.4, 5.7, and 5.1 yr in the Seattle annual dataset for AD 1510–1954. This set of periods compares closely with the Tucson power spectrum for T > 5 yr. As discussed above, the Seattle and Tucson laboratories produce data that appear to be comparable in accuracy and precision, but the raw Tucson data in Figure 2 appear to show greater scatter than the Seattle data. Whether this arises from the raw material or from experimental technique is unclear. If there were greater scatter due to error in the Tucson data, however, the error should be random and would be attenuated by smoothing. Figure 2 shows that smoothing in fact results in the detection of non-random cyclic variations in both datasets. The cycles are the 7–17-yr periods described above, and their amplitude, particularly between AD 1000 and 1300, is larger than that of corresponding periods in the Seattle data. Outlying results (supplementary Table S2), present in the Tucson dataset to a greater degree than in the Seattle dataset, include five large jumps in Δ14C at AD 1017 (negative jump, AMS measurement), AD 1160 (negative, LSC), AD 1165 (negative, LSC), AD 1231 (positive, LSC), and AD 1420 (positive, LSC). Laboratory contamination might be expected to shift δ13C either positively (atmospheric contamination) or negatively (contamination from pre-treatment chemicals); however, only the outlier at AD 1231 has a δ13C value markedly different from neighboring data. Large jumps in Δ14C are present in comparable datasets (Miyahara et al. Reference Miyahara, Masuda, Furuzawa, Menjo, Muraki, Kitagawa and Nakamura2004, Reference Miyahara, Yokoyama, Yamaguchi, Kosovichev, Andrei and Rozelot2009; Miyake et al. Reference Miyake, Nagaya, Masuda and Nakamura2012). Whether the outliers in the Tucson dataset result from experimental shortcomings or from the nature of the raw samples remains unclear. The data are presented here without censoring.
SHORT-TERM EVENTS
Annual time-series data are of use in identifying decadal cyclic phenomena such as the Schwabe and Hale cycles of solar activity, and non-cyclic phenomena of similar time-scale, for example the generation of 14C pulses by SPEs from large solar flares. The cyclic phenomena are expected to approximate sinusoids, while the non-cyclic events may appear as abrupt single-year changes followed by slower reversal of the initial change, approximating a single cycle of a square wave. The latter are termed stepwise changes below.
Sinusoid-Like Cycles
Cycles of T = 10–17 yr (Figure 7) and amplitudes of 3–6‰ (Figure 6) are most visible in the Tucson dataset in the Late Medieval Solar Maximum. Such amplitudes are comparable to the 4‰ expected to result at Earth’s surface from atmospheric low-pass filtering of variations due to the Schwabe cycle (Damon and Sonnett Reference Damon, Sonnett, Sonnett, Giampapa and Matthews1991). For sinusoidal signals of T near 10 yr, the attenuation factor is near 100 and the phase shift is about 2 yr (Damon and Peristykh Reference Damon and Peristykh2004; Usoskin and Kromer Reference Usoskin and Kromer2005). Between AD 1350 and 1450, T near 7 yr predominates (Figure 7) and amplitudes of 10‰ or more may be present, notwithstanding the larger expected attenuation of a 7-yr period relative to a 10-yr period (Damon and Peristykh Reference Damon and Peristykh2004; Usoskin and Kromer Reference Usoskin and Kromer2005).
For comparable periods, amplitudes less than 5‰ are present in the Seattle and Nagoya datasets (Stuiver and Braziunas Reference Stuiver and Braziunas1993; Miyahara et al. Reference Miyahara, Masuda, Furuzawa, Menjo, Muraki, Kitagawa and Nakamura2004, Reference Miyahara, Masuda, Muraki, Kitagawa and Nakamura2006, Reference Miyahara, Masuda, Nagaya, Kuwana, Muraki and Nakamura2007, Reference Miyahara, Yokoyama, Yamaguchi, Kosovichev, Andrei and Rozelot2009), but periodicity is less regular than at the Late Medieval Solar Maximum. Güttler et al. (Reference Güttler, Wacker, Kromer, Friedrich and Synal2013) reported cycles with T = 12 yr and amplitudes near 2‰ in the interval AD 1010–1110. Note that Kocharov (Reference Kocharov, Taylor, Long and Kra1992) reported amplitudes of 10‰ or greater for cycles of approximately 10-yr period in a single-yr Δ14C time series for AD 1600 onwards; such large amplitudes are not seen in the contemporaneous Seattle dataset. Stuiver and Braziunas (Reference Stuiver and Braziunas1993) proposed a combination of modulation of Δ14C production by the solar wind and modification of the carbon cycle by North Atlantic thermohaline circulation as an explanation for observed spectral power corresponding to the Schwabe cycle.
Modulation of Δ14C by the solar wind appears to be a sufficient explanation of the amplitudes and periods of the cycles depicted in Figure 6. However, it is surprising, considering the routine 1σ analytical precision near 2‰, that the observed amplitudes of 3–6‰ are preserved in the Tucson and other datasets. Random errors might be expected to disrupt the sequential increases and decreases in Δ14C (Figure 6). The larger amplitudes and shorter periods in the interval AD 1380–1420 may reflect a climatic influence, as yet unexplained, on the surface carbon cycle. At present, it remains unclear whether the short-period variations reported here are indeed related to the Schwabe cycle.
Stepwise Events
The AD 1006 SN, observed optically, may have produced the stepwise increase in Δ14C of about 8.5‰ at AD 1010–1011 in our time-series of Δ14C (Damon et al. Reference Damon, Dai, Kocharov, Mikheeva, Peristykh, Cook, Harkness, Miller and Scott1995a, Reference Damon, Kocharov, Peristykh, Mikheeva and Dai1995b), followed by gradual decay over a decade. The delay between the arrival of visible light and gamma radiation may have resulted from a delay in the arrival of gamma rays relative to visible light (Damon et al. Reference Damon, Dai, Kocharov, Mikheeva, Peristykh, Cook, Harkness, Miller and Scott1995a, Reference Damon, Kocharov, Peristykh, Mikheeva and Dai1995b), but may be partly explained by phase shift due to low-pass filtering. If this pulse of radiation is considered as a square wave of period 12 yr, its principal sinusoidal component also has a period of 12 yr, with a phase shift of about 2 yr and an attenuation factor comparable to that for T ≈ 10 yr. Dee et al. (Reference Dee, Pope, Miles, Manning and Miyake2017), however, discounted a SN as the cause of the stepwise increase because tree-ring records from other localities fail to show what should have been a global phenomenon.
Both Damon et al. (Reference Damon, Dai, Kocharov, Mikheeva, Peristykh, Cook, Harkness, Miller and Scott1995a, Reference Damon, Kocharov, Peristykh, Mikheeva and Dai1995b) and Miyake at al. (Reference Miyake, Nagaya, Masuda and Nakamura2012) considered SPEs arising from clusters of giant solar flares as an alternative explanation for stepwise increases in Δ14C. However, Damon et al. (Reference Damon, Dai, Kocharov, Mikheeva, Peristykh, Cook, Harkness, Miller and Scott1995a, Reference Damon, Kocharov, Peristykh, Mikheeva and Dai1995b) concluded that Δ14C signatures of clusters of flares of the required energy are absent in the Seattle dataset between AD 1500 and 1954 (Stuiver and Braziunas Reference Stuiver and Braziunas1993), and that such SPEs would therefore be unlikely at earlier times.
Additional stepwise increases in Δ14C, all ≤ 5‰, may be present in the Tucson dataset (supplementary Figure S1 and Table S2) at AD 1063, 1167, 1297, 1429, and 1448–1450. Possible stepwise decreases are less common, at AD 1182 and 1367, both about 5‰. All of these changes are comparable in amplitude to the Schwabe-like cycles, and therefore difficult to distinguish reliably.
Usoskin and Kovaltsov (Reference Usoskin and Kovaltsov2012) suggested large SPEs dated approximately at AD 1460 and 1505 on the basis of 10Be data from an ice core at the South Pole. The stepwise change at AD 1448–1450 in the Tucson Δ14C record (Figure 8) is 4.9‰, calculated as the difference between means for the preceding and following time intervals indicated by horizontal bars. The change coexists with a 5-yr decrease of about 0.6‰ in δ13C, which may indicate a climate effect corresponding to the change in Δ14C. We suggest that these stepwise changes correspond to the AD 1460 SPE, with better time resolution. A 5‰ stepwise change also appears to be present near AD 1450 in the Δ14C record of Miyahara et al. (Reference Miyahara, Masuda, Muraki, Kitagawa and Nakamura2006). At AD 1506–1507 in the Tucson dataset (Figure S1), a series of declining Δ14C values is abruptly interrupted by a 6‰ increase that is difficult to distinguish in form from neighboring Schwabe-like cycles (Figure S1).
Tucson Δ14C data, AD 1378–1472 (continuous curve), detrended using the linear regression shown (diamond symbols), compared with the Tucson δ13C time series. Solid bars indicate mean Δ14C and δ13C (over the intervals indicated by bar length, with standard errors, se, indicated) around the 4.9‰ change in Δ14C at AD 1450.

A very large volcanic eruption that occurred in AD 1258 or 1259 (Emile-Geay et al. Reference Emile-Geay, Seager, Cane, Cook and Haug2008) is not convincingly recorded in the Tucson Δ14C and δ13C records (supplementary Figure S1), but corresponds to a decade, beginning in AD 1256, of thin tree rings (supplementary Table S2).
THE δ13C RECORD
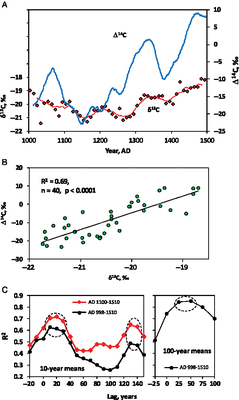
The time-series of δ13C and Δ14C are broadly similar in form (Figures 1A ,1C, 9A). The δ13C and Δ14C time series, expressed as decadal averages in order to eliminate short-period noise, are most closely related in the interval AD 1100–1510, within which R2 = 0.69 (Figure 9B). For the entire dataset, AD 998–1510, R2 = 0.53, reflecting poor correlation in the interval AD 998–1100. The R2 values have been calculated for decadal averages, beginning AD 1105, 1115 etc. (see Table S1); note that the values of R2 are lower when calculated for decades beginning AD 1100, 1110, etc., e.g. 0.63 for AD 1100–1510. For both sets of decadal means, R2 is maximized if δ13C lags behind Δ14C by 10 to 30 yr, or 130 to 140 yr (Figure 9C). This lag appears to be related to cycles with T near 110 yr in both datasets, causing R2 to have a second maximum where the cycles realign with increasing applied lag. Lag between δ13C and Δ14C at millennial time scale is more difficult to determine in a dataset spanning 513 yr; using 100-yr means calculated every 25 yr (in order to remove short-period variations) suggests that R2 is maximized if δ13C lags behind Δ14C by 25–50 yr (Figure 9C).
A. Time-series plot of decadal averages of Δ14C and δ13C for the Tucson dataset. B. Δ14C vs. δ13C, for AD 1100–1510; the points represent decadal averages, beginning AD 1105, 1115 etc. (see Table S3); the value of R2 is lower for decades beginning AD 1100, 1110, etc. C. Effect of time lag on correlation (R2) of Δ14C vs. δ13C for decadal means, with separate calculations for AD 1100–1510 and AD 998–1510 (left), and for 100-yr means, calculated every 25 yr for AD 998–1510 (right). A positive lag signifies δ13C lagging behind Δ14C. R2 values within dashed ellipses have p values < 0.0001.

The changes in δ13C reflect surface environmental factors, not the cosmogenic processes ultimately responsible for the Δ14C time series. Carbon isotope discrimination between a C3 plant (p) and air (a) is
 $${\Delta _{\rm{3}}} = {{\delta (a) - \delta (\,p)} \over {1 + 0.001\delta (\,p)}} \approx \delta (a) - \delta (\,p)$$(1)
(Farquhar and Richards Reference Farquhar and Richards1984) where the δ symbols (simplified to δp and δa below) denote δ13C. Values of δa have remained close to constant in the global atmosphere over the time interval AD 1000–1500, on the evidence of measurements in ice cores (e.g. Rubino et al. Reference Rubino, Etheridge, Trudinger, Allison, Battle, Langenfelds, Steele, Curran, Bender and White2013). Persistent local inhomogeneities of 1‰ or more in δa are unlikely at annual to decadal time scales and have not been observed in recent decades (Carbon Dioxide Information Analysis Center 2010). Values of δp are therefore inversely related to values of Δ3.
Relevant environmental variables at the study site include temperature, water availability (encompassing both relative humidity of air and availability of soil water) and irradiance (Farquhar et al. Reference Farquhar, Ehleringer and Hubick1989; McCarroll and Loader Reference McCarroll and Loader2004; Cernusak et al. Reference Cernusak, Ubierna, Winter, Holtum, Marshall and Farquhar2013). Observed δp values result from the complex interplay of two biological functions: stomatal conductance, mediated by water availability, and photosynthetic rate, controlled by temperature and irradiance. Where plants are not subjected to extremes of stress from heat and dryness (as in the present study area), it is not possible to determine a simple causality for variations in δp (McCarroll and Loader Reference McCarroll and Loader2004, and references therein). Nonetheless, three of the four variables are climatic in origin; the origin of the fourth, irradiance, is discussed below. Even though a positive correlation between Δ3 and ambient temperature has been suggested from studies of lowland plants from various latitudes (Körner et al. Reference Körner, Farquhar and Wong1991), and in individual plants (e.g., Leavitt and Long Reference Leavitt and Long1982), contrary results exist (McCarroll and Loader Reference McCarroll and Loader2004). Likewise, although a global positive correlation has been suggested between Δ3 and mean annual precipitation (Diefendorf et al. Reference Diefendorf, Mueller, Wing, Koch and Freeman2010) and in individual trees (e.g. Leavitt and Long Reference Leavitt and Long1991), studies reviewed by McCarroll and Loader (Reference McCarroll and Loader2004) indicate a complex dependence.
Irradiance correlates negatively with Δ3 (Ehleringer et al. Reference Ehleringer, Field, Lin and Kuo1986; Leavitt and Long Reference Leavitt and Long1991). Ehleringer et al. (Reference Ehleringer, Field, Lin and Kuo1986) observed decreases of about 4‰ in δp where irradiance was reduced by a factor of 2.3 because of shading. Annual solar irradiance changes by 6% owing to the elliptical geometry of the Earth’s orbit (Floyd et al. Reference Floyd, Tobiska and Cebula2002), and by a factor of 2 (neglecting absorption in the atmosphere) at 37ºN as a result of seasonal change in the incident angle of solar radiation. The Schwabe cycle produces changes in solar irradiance in the visible spectrum that are much smaller, 0.1–0.38%, (Hoyt and Schatten Reference Hoyt and Schatten1997, p. 196 ff.). Change in visible irradiance between the Maunder Minimum and the present is likely to be of similar magnitude (Lean Reference Lean2000). Photosynthetic effects of solar luminosity cycles are therefore small relative to those arising from shorter-term phenomena, and are unlikely to cause large changes in δp.
The effect of irradiance (governed by the amount of shading from tree canopies), combined with the effects of tree height on the availability of water in leaf tissue (governed by hydraulic conductivity in tree trunks) causes Δ3 to decrease with tree height (Leavitt Reference Leavitt2010; McDowell et al. Reference McDowell, Bond, Dickman, Ryan, Whitehead, Meinzer, Lachenbruch and Dawson2011). Ambrose et al. (Reference Ambrose, Sillett and Dawson2009) measured the effect in leaves of contemporaneous individuals of Sequoiadendron giganteum, finding that Δ3 decreased by 3–4‰ as tree height increased from 30 to 90 m, which can be compared with our observed increase of 3 to 3.5‰ in δ13C of cellulose between AD 1150 and 1490 (Figure 1B). Most height-growth in sequoias takes place in the first 400 yr, but trunk volume continues to increase steadily until an age of at least 2500 yr in the case of the General Sherman tree (Weatherspoon Reference Weatherspoon, Bums and Honkala1990). Craig (Reference Craig1954) recorded an increase of 2‰ in δ13C during the first 200 yr of growth of a sequoia, and little change in the succeeding 600 yr. The age of the tree sampled for this study was not noted by the samplers. However, the sampling of broader rings since AD 1024 probably represents the later phase of growth, with modest increase in height and thus little change in δ13C attributable to tree growth.
Two possible explanations of the long-term changes in our δ13C time series arise: (1) that the long-term increase in δ13C is a consequence of growth of the tree, with secondary cyclic variations resulting from changes in environmental factors; and (2) that changes in δ13C arise from the factors controlling Δ14C, i.e. that solar luminosity was modulating climate at the Big Stump Grove in such a way as to generate long-term trends in δ13C. If (1) is correct, then the long-term parallel changes in δ13C and Δ14C in the Tucson dataset (Figures 1B, 9A) are coincidental. Our dataset shows a general decrease in δ13C between AD 998 and AD 1150, inconsistent with the δ13C change expected in early growth of a tree. This and the shared variance of δ13C and Δ14C favor explanation (2), notwithstanding our inability to identify causality in detail.
A complex interplay of environmental variables seems likely to be related to the noise in the annual δ13C record (Figure 1C), and also to the lack of correspondence between the sequoia δ13C record and dendrochronological records from the immediate region (Hughes and Brown Reference Hughes and Brown1992; Graumlich Reference Graumlich1993; Scuderi Reference Scuderi1993; Figure S2). Our sequoia δ13C time series also bears no relationship (Figure 1B) to δ13C in tree rings for multiple species at other locations over the same time interval (Stuiver and Braziunas Reference Stuiver and Braziunas1987). The latter data are expressed as residuals of δ13C (the differences between decadal δ13C measurements and the pre-1850 mean δ13C for each species) and have a range of 1.2‰, smaller than δ13C ranges found in the Tucson dataset, namely 3.3‰ in decadal averages and 5.2‰ in annual measurements (Table S2, excluding a single outlier).
DISCUSSION: IMPLICATIONS FOR CLIMATE CHANGE
The δ13C time series does not meet usual dendrochronological standards in that it is derived from a single tree. It is noisy, no doubt owing to short-term changes in environmental parameters (see previous section). Nonetheless, the time-series of Δ14C and δ13C in this study are strikingly similar in form with and without low-pass filtering (Figures 1 and 9A). The δ13C signal—a change of 3.5‰ in the smoothed δ13C time series—is large in the context of tree-ring isotope data (e.g. Körner et al. Reference Körner, Farquhar and Wong1991; Leavitt and Long Reference Leavitt and Long1991; Leavitt Reference Leavitt2010).
The Δ14C time series provides a record originating as changes in cosmogenic production rates of 14C and is attenuated and phase-shifted as described above (Background). The δ13C time series provides a record of long-term change in multiple interacting environmental parameters. The long-term δ13C record is therefore probably best explained as a product of climate change, the details of which cannot be deduced from δ13C alone. The principal mode of variation of the Δ14C and δ13C time series in this study is part of a cycle with a period (T) of 850 to 1000 yr (Figure 2). A secondary cyclicity with T near 100 yr is also visible in both series.
A recent version of the dependence of 14C phase shift on T (Beer et al. Reference Beer, McCracken and von Steiger2012, Figure 13.5.3.2-2) gives lags of 100–125 yr for T = 1000 yr between extrema of production of 14C in the upper atmosphere (inversely related to extrema of solar luminosity) and subsequent, corresponding extrema archived at Earth’s surface. For T = 100 yr, the lag is 10 yr. Earlier versions (Damon and Peristykh Reference Damon and Peristykh2004; Usoskin and Kromer Reference Usoskin and Kromer2005) gave lags of 60–110 and 19–21 yr, respectively. The smoothed δ13C time series expressed as 10-yr means (Figure 9A), lags behind the Δ14C time series by 10 to 30 yr (Figure 9C). As explained above, this additional lag applies to the centennial cyclicity. For the millennial cycle of δ13C, an additional lag of 25–50 yr is suggested (Figure 9C). The Tucson dataset therefore indicates a lag (incorporating the phase-shift estimate of Beer et al. Reference Beer, McCracken and von Steiger2012) of 20–40 yr between extrema of the centennial cycles of solar luminosity and δ13C, an effect seen most clearly between AD 1100 and 1500. Less clearly, there appears to be a lag of 125–175 yr between extrema of the millennial cycles of solar luminosity and δ13C.
Helama et al. (Reference Helama, Fauria, Mielikainen, Timonen and Eronen2010), in a study comparing widths of tree rings from Arctic Scandinavia and reconstructed sunspot numbers over the past 2000 yr, concluded that the millennial component of their tree-ring data lagged behind that of reconstructed sunspot numbers by 70–100 yr for the Late Holocene. If the long-term δ13C signal in our dataset is indeed of climatic origin, then a similar, but larger, lag of climate behind solar luminosity is implied, regardless of whether we can identify the specific cause of the long-term change in δ13C. A similar lag of 20–40 yr for the centennial component is implied. The studies describe regional effects, in widely separated regions of contrasting climate. Both studies assume that the phase shifts calculated from models of the carbon cycle are correct.
The most recent grand solar maximum occurred between AD 1960 and 1980, according to sunspot numbers (e.g. SILSO, 2019). It is not yet clear whether this maximum represents the culmination of the millennial cycle or a maximum of the centennial cyclicity superimposed on the millennial cycle, in which case the post-1980 decrease in sunspot numbers would be analogous to the punctuation of the long Medieval Solar Maximum by the Oort minimum (Figure 2). Steinhilber and Beer (Reference Steinhilber and Beer2013) deduced that the millennial grand maximum had occurred late in the 20th century, whereas Damon and Peristykh (Reference Damon and Peristykh2005) forecast it for about AD 2040. If the AD 1960–1980 grand maximum is of millennial time-scale, the corresponding peak climatic response, which may be more complex than warming alone, is predicted to lag behind the sunspot and luminosity maxima by at least a century, therefore occurring in the second half of the 21st century. This study suggests that peak climatic response to a centennial AD 1960–1980 grand maximum would end before AD 2020, but that the response to the underlying millennial component of increasing solar luminosity would continue into and possibly beyond the second half of the 21st century.
Predicting the magnitude of such climate response in relation to that arising from greenhouse gases is not straightforward. Two contrasting opinions are present in the literature. According to the first, the influence of solar activity is miniscule in comparison to the effect of anthropogenic greenhouse gases. Myhre et al. (Reference Myhre, Shindell, Bréon, Collins, Fuglestvedt, Huang, Koch, Lamarque, Lee, Mendoza, Stocker, Qin, Plattner, Tignor, Allen, Boschung, Nauels, Xia, Bex and Midgley2013) and Masson-Delmotte et al. (Reference Masson-Delmotte, Schulz, Abe-Ouchi, Beer, Ganopolski, González Rouco, Jansen, Lambeck, Luterbacher, Naish, Stocker, Qin, Plattner, Tignor, Allen, Boschung, Nauels, Xia, Bex and Midgley2013) in their reviews for the Intergovernmental Panel on Climate Change (IPCC) concluded that the radiative forcing attributable to changes in total solar irradiance (TSI) is small during Schwabe cycles, less than 1% of the radiative forcing due to greenhouse gases. That claim appears to be based on satellite measurements of TSI, modeled estimates of anthropogenic effects, and temperature observations during recent solar cycles. The authors suggested further that the amplitude of cyclic variations in TSI due to the Schwabe cycle is approximately the same as that due to the transition from the Maunder minimum to the modern grand solar maximum. The magnitude of the latter is less certain than that of the former.
According to the second opinion, the component of climate change due to solar radiative forcing is larger than that corresponding to the IPCC opinion. Direct observation and climate proxy archives show clear evidence of changes due to solar luminosity cycles at the time scale of the Schwabe cycle (e.g. Rigozo et al. Reference Rigozo, Nordemann, Evangelista da Silva, de Souza Echer and Echer2007; Meehl et al. Reference Meehl, Arblaster, Matthes, Sassi and van Loon2009; Perone et al. Reference Perone, Lombardi, Marchetti, Tognetti and Lasserre2016) and at longer time scales (e.g. Mann et al. Reference Mann, Bradley and Hughes1998; Yu and Ito Reference Yu and Ito1999; Eichler et al. Reference Eichler, Olivier, Henderson, Laube, Beer, Papina, Gäggeler and Schwikowski2009; Beer et al. Reference Beer, McCracken and von Steiger2012, Figure 17.5–2; Soon et al. Reference Soon, Connolly and Connolly2015). Damon and Peristykh (Reference Damon and Peristykh2005) estimated that 18% of 20th-century global warming was attributable to solar forcing. Possible mechanisms may involve (1) heating of the troposphere and upper stratosphere as a result of the formation and destruction of ozone by incident ultraviolet radiation (Hoyt and Schatten Reference Hoyt and Schatten1997; Meijer et al. Reference Meijer, Dergachev, van der Plicht, Renssen, Raspopov and van Geel1999; Floyd et al. Reference Floyd, Tobiska and Cebula2002) and (2) enhancement of cloud formation in the stratosphere when cosmic ray flux is high (Meijer et al. Reference Meijer, Dergachev, van der Plicht, Renssen, Raspopov and van Geel1999; Solanki and Krivova Reference Solanki and Krivova2003). In the far and middle ultraviolet spectral regions, relative cyclic variations are larger in amplitude than for TSI, and are as much 20–100% in the far ultraviolet spectral region responsible for tropospheric ozone formation (e.g. Lean et al. Reference Lean, Hulburt, White and Skumanich1995; Lean Reference Lean2000; Bolduc et al. Reference Bolduc, Charbonneau, Barnabé and Bourqui2014). Mechanism (1) is not yet understood in terms of its downward propagation to Earth’s surface. If the mechanism involves the downward transfer of heat, oxygen ions or ozone molecules (Floyd et al. Reference Floyd, Tobiska and Cebula2002), then amplitude modification and phase shift dependent on the periodicity of solar luminosity are likely as each component is distributed among “boxes.” Such processes would be analogous to those modeled for 14C in the carbon-cycle box models. Phase shifts are therefore plausible for mechanism (1), but less so for mechanism (2), which involves direct insolation at Earth’s surface. Meehl et al. (Reference Meehl, Arblaster, Matthes, Sassi and van Loon2009) observed enhanced precipitation, decreased sea surface temperatures and reduced low-latitude clouds in the tropical Pacific Ocean during maximum years of the Schwabe cycle, observations of a scale requiring an amplification of the Schwabe cycle in the atmosphere. The IPCC opinion on solar radiative forcing is no doubt correct in attributing the largest component of 20th-century climatic warming to the greenhouse effect. However, the component due to solar radiative forcing may be larger than that indicated by changes in TSI.
If the prediction of a delay in the effects of the most recent grand solar maximum is correct, a non-negligible climate response from that source may be occurring at present, or may yet occur. We observe that solar luminosity cycles of longer period differ from Schwabe cycles in providing sustained high solar irradiance over decades (the Modern Grand Solar Maximum) to a century or more (the Early and Late Medieval Solar Maxima). The climatic effects of solar variation at millennial and centennial scales may therefore be greater than those of Schwabe cycles.
CONCLUSIONS
Time series (Tucson dataset) of Δ14C and δ13C with annual resolution, representing the years AD 998–1510, have been measured in tree rings of a single sequoia from the Big Stump Grove, California. The Tucson data, together with data for other field locations from laboratories in Seattle and Nagoya, provide a high-resolution record of Δ14C for AD 600–1954.
The Tucson sequoia data, reduced to decadal means, compare closely with decadal data for AD 1000–1510 measured on Douglas fir by the Seattle laboratory. Differences between the decadal data are non-random, changing in sign with time.
Discrete Fourier Transform analysis reveals short-term periods of 126, 56, 17.6, 13.6, 10.4, and 7.1 yr, similar to those of the Seattle data for AD 1500–1954. The 56-yr period persists from AD 1000–1200 and AD 1350–1400, but is weak or absent at other times. Short-term cycles resembling Schwabe cycles, with periods of 10–17 yr, appear to be observed between AD 1000 and 1120, and have amplitudes of 3–6‰; however, analytical uncertainty renders such observations problematic. Short term cycles with periods near 7 yr are prominent between AD 1320 and 1450 and have amplitudes as high as 10‰.
Possible stepwise increases in Δ14C are mainly 5‰ or less, and therefore difficult to distinguish from Schwabe and other short-period cycles. A stepwise increase at AD 1450 may correspond to a large solar proton event recognized at about AD 1460 in 10Be data.
Smoothed time series of Δ14C and δ13C show similar forms and correlate most closely if δ13C lags behind Δ14C by 10–30 yr (centennial-scale cyclicity) and possibly 25–50 yr (millennial-scale). The δ13C time series may represent a regional climate signal related to solar luminosity, but lagging behind it by 125–175 yr for the millennial cycle, and 20–40 yr for centennial cycles. Peak climate response resulting from the modern grand solar maximum may occur with a delay of decades to over a century, and may be larger in relation to greenhouse-induced warming than has been predicted by the IPCC.
ACKNOWLEDGMENTS
The authors acknowledge the role of the late Professor Paul Damon in initiating and completing much of the research reported here, and of the late Professor Austin Long, in whose laboratory the measurements were undertaken. Alexei Peristykh carried out the spectral analysis of the 14C time series. The authors express their gratitude to Dr. Paula Reimer and to two anonymous reviewers whose comments greatly improved the manuscript. The research was funded by several grants from the National Science Foundation, viz. ATM 0226063, ATM-0210091, ATM-024710, ATM-9520135, ATM-8919535 EAR-8822292 and by the State of Arizona.
SUPPLEMENTARY MATERIAL
To view supplementary material for this article, please visit https://doi.org/10.1017/RDC.2019.27