I. INTRODUCTION
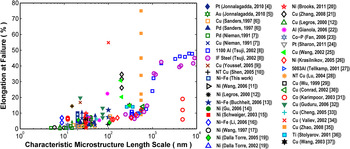
In general, metals follow a Hall–PetchReference Hall1,Reference Petch2 trend with small grains affording enhanced strength. Although grain refinement has been observed to result in increasing strength, at least until Hall–Petch breakdown,Reference Meyers, Mishra and Benson3 this same grain refinement appears to result in lower ductility. Figure 1 plotting total elongation versus a characteristic microstructural length scale such as the grain size or twin spacing has been compiled using data extracted from published works.Reference Jonnalagadda, Chasiotis, Yagnamurthy, Lambros, Pulskamp, Polcawich and Dubey4–Reference Wang and Ma37 It is clear that nanocrystalline grains (≤100 nm) often result in elongations of less than 15%. On the other hand, ultra-fine-grains (UFG) with sizes above 100 nm can achieve well over 15% elongation. Several previous reportsReference Meyers, Mishra and Benson3,Reference Koch38–Reference Koch, Morris, Lu and Inoue41 have included similar plots, all illustrating the concept that weaker UFG materials achieve 15+% elongation, whereas the stronger NC materials fall short of 15% strain at failure.
A compiled plot of elongation versus characteristic microstructure length scale (grain size or twin spacing). The data, taken from published quasi-static (∼10−6 to ∼10−3 s−1) tensile experiments, illustrate that metals with smaller grain sizes appear to have limited ductility. Note that if a reference provided a size range for the microstructural length scale, the average was used.

The limited tensile ductility in NC metals has been primarily attributed to three causes: (i) lack of available strain accommodation processes such as slip or grain boundary (GB) sliding, (ii) premature flow instability from preexisting processing-induced flaws, and/or (iii) low hardening capability. Koch et al.,Reference Koch38,Reference Koch, Youssef, Scattergood and Murty42 Wang and Ma,Reference Wang and Ma43 and MaReference Ma44 have detailed viable routes for improving ductility. Examples of such that have been successfully demonstrated include the generation of bimodalReference Witkin, Lee, Rodriguez, Nutt and Lavernia45,Reference Wang, Chen, Zhou and Ma46 and multimodalReference Zhao, Topping, Bingert, Thornton, Dangelewicz, Li, Liu, Zhu, Zhou and Lavernia47 grain size distributions to have small crystallites for strengthening and large ones to accommodate slip. Bimodal Cu made by Wang et al.,Reference Wang, Chen, Zhou and Ma46 e.g., was able to attain over 60% elongation at failure. Another approach is to incorporate nano-scale twins, phases, and precipitates to alleviate shear banding.Reference He, Eckert, Loser and Schultz48 Effectively, all of these techniques aim to tailor the grain structure so as to increase uniform elongation and “put the brakes on plastic or failure instability mechanisms” as stated in Ref. Reference Ma49.
Although engineering the grain structure certainly provides ductility enhancements, do NC metals themselves possess inherently poor ductility? The observations in this work and in other works suggest that NC metals do possess adequate strain accommodation mechanisms, but those processes are cut short by necking instabilities arising from poor work hardening and nonideal specimen geometries. Further, these observations re-emphasize the known issue that there is no geometry-independent material property metric for ductility. Axial strain or uniform elongation alone is inadequate as these measurements are sensitive to more than just intrinsic material parameters. Consider the work of Zhao et al.,Reference Zhao, Guo, Wei, Dangelewiez, Zhu, Langdon, Zhou, Lavernia and Xu35 marked with solid orange squares in Fig. 1, which is a series of tensile experiments on the same UFG Cu metal with the specimens having different geometric configurations. Total elongation varies from 9 to 75%, demonstrating the geometric-sensitivity of this metric.
The purpose of this work is to provide an over-arching view of ductility for small grain metals and outline the most important elements one should consider when evaluating ductility. This paper begins by presenting a set of tensile experiments exploring the ductility of NC Ni–Fe. A comparison of the Ni–Fe results to the published literature follows. The discussion, intended as a compact review, focuses on the key intrinsic and extrinsic factors that govern tensile ductility measurements. The inadequacy of evaluating ductility based on total elongation or uniform elongation alone will be presented along with how specimen geometry can have nontrivial effects that must be taken into account.
II. EXPERIMENTAL
A. Specimen synthesis and characterization
Thin film tensile specimens of Ni–Fe were prepared in the manner as detailed in Ref. Reference Padilla, Boyce, Clark and Michael50. In short, a Kapton® film was first mounted to an alumina carrier substrate and then electron beam evaporation was used to deposit a 20 nm thick Ti adhesion layer followed by a 100 nm thick seed layer of Cu. Next, this layered substrate was placed into an electro-chemical bath for electro-deposition of a 10 µm thick Ni–Fe foil onto the Cu seed layer. After deposition, the tensile geometry of the individual specimens was defined using a pneumatic punch process and then a lift-off procedure was performed to release the specimens from the carrier substrate.
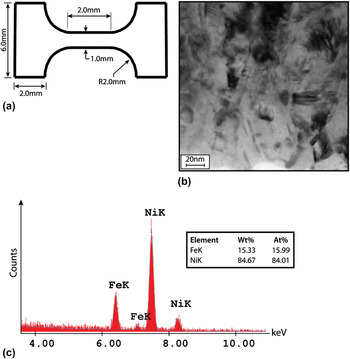
Nominally, the 10 µm-thick tensile geometry had a gage length of 2.0 mm and a gage width of 1.0 mm [see Fig. 2(a)]. For each specimen, gage length and width were measured with ±0.5 µm accuracy using an Olympus STM 6 measuring microscope (Olympus Corporation, Tokyo, Japan). The thickness was measured along the gage at five different locations using a Mitutoyo VL-50A digital indicator (Mitutoyo Corporation, Kanagawa, Japan), capable of 0.01 µm resolution and outfitted with spherical probes. It was found that the deposition process did not produce foils with uniform thicknesses. Along the gage, a thickness gradient was detected with the extremities differing by 0.9 µm on average. This gradual thickness taper obviously has a nonnegligible effect on the stress gradients within the gage section and is taken into account as discussed in Sec. II. B.
(a) Ni–Fe micro-tensile specimen geometry with (b) a representative bright-field TEM image of the grain structure and (c) EDS analysis.

Characterization of the as-deposited Ni–Fe was performed using a Phillips CM30 transmission electron microscope (TEM). A TEM specimen was prepared using the focused ion beam (FIB) lift out techniqueReference Mayer, Giannuzzi, Kamino and Michael51 with a FEI Helios Nanolab. The grain structure, as shown with a representative bright-field image [Fig. 2(b)], has grains, between 15 and 30 nm in size, with boundaries that are not well defined making it difficult to determine an exact grain size. From a survey of 25 grains, the average size was 22 nm with a 7.5 nm standard deviation. An energy dispersive spectroscopy (EDS) module (EDAX Genesis) on an FEI dual beam Nanolab 600 was also used to confirm the elemental composition. Figure 2(c) shows the relevant portion of the EDS scan. Both the Ni and Fe peaks were clearly identifiable, and the alloy, by atomic percent, was measured to be 84% Ni and 16% Fe.
B. Mechanical testing
The Ni–Fe specimens were mechanically tested using a custom small-scale tensile system that incorporates a closed loop PIHera® piezo actuator (Physik Instrumente® model P-625.1, Physik Instrumente (PI) GmbH & Co.KG, Karlsruhe, Germany) and a Honeywell subminiature 10 lb tension-compression load cell. The experiments were displacement controlled with strain rates varying from 5 × 10⁻⁵ s−1 to 2.5 × 10⁻³ s−1. Strain-rate jump tests were also performed in which the displacement rate was periodically increased by either a half or full order of magnitude during a tensile test.
Strain was measured using digital image correlation (DIC). During each experiment, a series of images was captured using a Prosilica GX2750 camera from Allied Vision Technologies (Stadtroda, Germany) mounted to an Olympus STM 6 optical microscope with a 2.5x objective (Olympus Corporation, Tokyo, Japan). The specimen surface had a mirror finish; therefore black toner particles 3–9 µm in size were blown through a lens paper filter onto the gage to create a random dispersion that served as contrast for the image correlation.
Vic-Snap software from correlated solutions was implemented to synchronize the captured images with the load data which was collected with a National Instruments data acquisition unit (model NI USB-9162, National Instruments Corporation, Austin, TX). To compute strain, the image sequence was processed using commercially available Vic2D software from correlated solutions. As the specimens had a thickness variation along the gage, the deformation was concentrated in the thinnest section and not uniformly distributed over the full 2.0 mm nominal length. For all samples, an average axial strain was measured only in the thin region which was taken to have an effective gage length of 0.6 mm. Strain uniformity inside the 0.6 mm gage was confirmed using DIC strain mapping of this reduced gage section (note that the thickness over this short gage section varied by <5%). In terms of spatial resolution, the subset size for all analyses was set at 56 µm (31 pixels) with a step size of 5 μm (3 pixels). In terms of strain-resolution, the highest noise floor measurement was 33 µ-strain.
III. RESULTS
A. Mechanical behavior
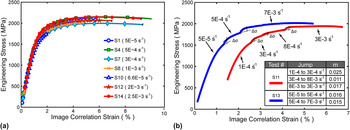
The mechanical response of the Ni–Fe is shown in Fig. 3(a), plotting engineering stress versus image correlation strain. As previously mentioned, the strain was measured from the thin region of the gage and the engineering stress was computed using the corresponding cross-section from that region. The tensile experiments all began with the specimen under a slight preload, and the strain data was adjusted to account for this such that zero load matched zero strain.
(a) Engineering stress–strain curves for seven Ni–Fe tensile tests. The “image correlation strain” was assessed over a gage section of 0.6 mm. (b) Response of Ni–Fe for strain rate jump tests. Rate sensitivity factor m is given in the inset table. The red curve for specimen S11 has been shifted right by 1% strain so that it is distinguished from the S13 curve.

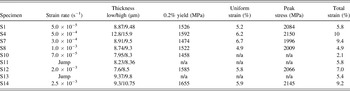
Table I contains full measurement details from the tensile response data. As expected, the specimens failed consistently in the thin region of the gage. Although specimen S10 appeared to fail prematurely, all the other Ni–Fe specimens behaved similarly. Ultimate strengths peaked around 2 GPa and the strain at failure was less than or equal to 10%. Li, Ebrahimi, and Liaw have performed several prior studies on the small grain NC Ni–FeReference Li and Ebrahimi16,Reference Ebrahimi, Ahmed and Li52–Reference Li, Choo and Liaw54 and the present results are comparable to their mechanical test data as well as that of others.Reference Buchheit, Goods, Kotula and Hlava13
Mechanical response measurements for tensile tested Ni–Fe.

The strain rate sensitivity (m) which describes how the flow stress changes with strain rate was also investigated. This parameter is of interest as rate sensitivity affects ductility by providing another source of hardening for the material to resist necking. To measure the rate sensitivity of Ni–Fe, a strain-rate jump test was used. For the jump tests, the strain rate ( ${{\dot \varepsilon }}$) was incrementally increased by increasing the displacement rate while the change in flow stress (σflow) at each jump was recorded. The sensitivity, m, was determined using the following equation m = (∂ln σflow/∂ln
 ${{\dot \varepsilon }}$).
The strain rate sensitivity of NC face-center-cubic (FCC) metals has been reported to be elevated in comparison to coarse grain counterparts. From a previous work,Reference Wei55 the strain-rate sensitivity of FCC metals Ni, Al, and Cu were compared and for grain sizes under 100 nm, m typically falls between 0.01 and 0.1. Other NC FCC metals such as Pt4 and Au5 also exhibit this behavior. The results for Ni–Fe of this study are provided in Fig. 3(b) and for strain rates from 5 × 10⁻⁵ s−1 to 3 × 10⁻³ s−1, the average value for m was determined to be 0.017. This value is on par with other NC Ni–Fe reports where the rate sensitivity was measured to be m = 0.010Reference Qin, Zhu, Gao, Chi and Lee56 and m = 0.0103Reference Li, Choo and Liaw54 and is also comparable to m for NiReference Wang, Hamza and Ma11,Reference Gu, Lian, Jiang and Jiang14,Reference Schwaiger, Moser, Dao, Chollacoop and Suresh15,Reference Dalla Torre, Van Swygenhoven and Victoria19 of similar grain sizes. Overall, the Ni–Fe follows the basic trend of NC FCC metals as its m is higher compared to the rate sensitivity of bulk Ni which Dalla Torre et al.Reference Dalla Torre, Spatig, Schaublin and Victoria18 measured to be ∼0.0028.
B. Failure morphology & fracture surface
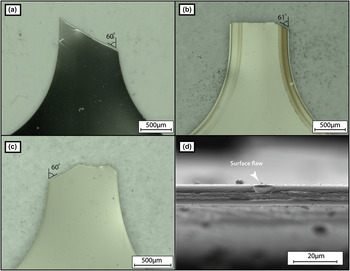
Failure of the Ni–Fe was associated with localized necking, a phenomenon commonly observed in sheet metal formation as discussed by Backofen.Reference Backofen57 Following the formation of a local neck, a crack initiated from either an edge flaw or surface pit would cause final failure [see Fig. 4(d)]. The cracks, following lines of local necking, were inclined at approximately 60° from the tensile axis. This is in general agreement with Hill’s analysisReference Hill58 that predicts local neck formation at 55° from the tensile axis under uniaxial sheet loading conditions. If Mohr’s circle of strain for an isotropic material in tension is considered, one will see that this particular angle corresponds to a line of zero normal extension which is needed to maintain strain compatibility between the local neck and the un-necked adjacent material. A consequence of this is that plane strain exists inside the local neck such that only the thickness reduces to accommodate tensile elongation. Failure of thin and wide specimens at ∼55° from the tensile axis due to local necking or other instabilities like shear banding is not uncommon and has been reported in UFG Al,Reference Lee, Zhang and Bravman59 NC Ni,Reference Gu, Lian, Jiang and Jiang14,Reference Brooks, Palumbo, Hibbard, Wang and Erb20 UFG Cu,Reference Cheng, Ma, Wang, Kecskes, Youssef, Koch, Trociewitz and Han33,Reference Zhao, Guo, Wei, Dangelewiez, Zhu, Langdon, Zhou, Lavernia and Xu35 and bulk Cu.Reference Zhao, Guo, Wei, Topping, Dangelewicz, Zhu, Langdon and Lavernia60
Images of a typical fracture profile; (a) specimens S4 and S14 have the angled shape; (b) specimens S8 and S10 have the angled-straight profile; and (c) specimens S1, S7, and S12 have the mixed-angle profile. (d) A surface pit that was a common site of crack initiation.

Only a slight amount of diffuse necking, which typically precedes local necking in tensile tests, was observed. The limited width contraction also explains the difference in the local neck inclination between Hill’s analysis and that measured for the Ni–Fe. Hill noted that the angle of the local neck is sensitive to plastic anisotropy i.e., the ratio of the strain in the thickness direction compared to the strain in the width direction.
The geometry of the fractured specimens was grouped into three typical shapes. The first fracture profile, common to specimens S4 and S14, is of the angled type [Fig. 4(a)] where failure follows a single local neck across the entire width. The second fracture profile, termed angled-straight [Fig. 4(b)], was observed in specimens S8 and S10. For this mode, a crack initiated at an edge flaw and propagated in Mode-I straight across the width until it met a local neck and deflected onto that angled path. The last fracture profile, called mixed-angle [Fig. 4(c)], is a more complex shape with failure following multiple intersecting local necks. These fracture profiles share similarities with those noted by Brooks et al.Reference Brooks, Palumbo, Hibbard, Wang and Erb20 for NC Ni specimens with thin and wide geometries.
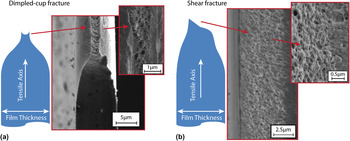
Cross-sectional examination of the fracture surface with scanning electron microscopy (SEM) revealed that failure occurred in a dimpled rupture fashion. Despite low elongation, dimple-like features are directly reported or are visible on the fracture surfaces of NC systems in numerous studies.Reference Jonnalagadda, Karanjgaokar, Chasiotis, Chee and Peroulis5,Reference Gu, Lian, Jiang and Jiang14,Reference Li and Ebrahimi16,Reference Dalla Torre, Spatig, Schaublin and Victoria18,Reference Brooks, Palumbo, Hibbard, Wang and Erb20,Reference Zhang, Jiang, Lian and Jiang21,Reference Fan, Fu, Qiao, Choo, Liaw and Browning23,Reference Krasilnikov, Lojkowski, Pakiela and Valiev26,Reference Guduru, Murty, Youssef, Scattergood and Koch32,Reference Cheng, Ma, Wang, Kecskes, Youssef, Koch, Trociewitz and Han33,Reference Wang, Cheng, Wei, Ma, Nieh and Hamza61 Although voids are typically associated with ductile failure, Li and EbrahimiReference Li and Ebrahimi62,Reference Li and Ebrahimi63 note that for NC metals, dimpling can be misleading. For Ni–Fe, when grains are above a critical size of ∼12 nm,Reference Cheung, Palumbo and Erb64 operative ductile mechanisms drive void formation and coalescence resulting in concave cups. Conversely, when the grain size is below the critical value, ductile deformation processes subside. Intergranular fracture or possibly GB sliding incompatibilities, as suggested by Hasnaoui et al.,Reference Hasnaoui, Van Swygenhoven and Derlet65 create a fracture surface with both shallow valley like cups and knobby protrusions. These features merely give the perception that voids are present. A similar observation linking the fracture surface features to deformation mode was made by Wang et al.Reference Wang, Cheng, Wei, Ma, Nieh and Hamza61 who tested electrodeposited NC Ni that had been heat-treated at various temperatures up to 300 °C. As-deposited samples and samples annealed under 250 °C had ductile dimples but when the heat treatment surpassed 250 °C, Ni became brittle from impurity segregation resulting in a fracture surface characterized by intergranular cleavage. For the Ni–Fe of the present study, the dimples on fracture surfaces inside the local neck are cup-like [Fig. 5(a)], suggesting that ductile mechanisms were active. Surfaces not following the local neck had characteristics of slant fracture and contained both cups and some knobby protrusions [see Fig. 5(b) inset], suggesting the possibility of intergranular crack propagation.
Oblique SEM view of the fracture surface. (a) Ni–Fe fracture surface inside the local neck with dimpled cup failure and (b) a region of shear fracture outside the local neck.

The fracture morphology of Ni–Fe is most likely due to the combined activity of void coalescence and shear for the slant fracture. Shear fracture is typically associated with a specimen in a state of plane stress; however, AndersonReference Anderson66 notes “pure slant fracture occurs when the distance over which high tri-axiality conditions exist is smaller than the fracture process zone.” This means that the extent of each type of fracture is driven by the tri-axiality of the stress state. For Ni–Fe, the fracture surface is then impacted by the maturity of the local neck as inside the local neck, a condition of plane strain exists bolstering the tri-axial stress state. This observation follows that of Yang et al.Reference Yang, Imasogie, Fan, Liaw and Soboyejo67 who performed bend tests to study the fracture of NC Ni–Fe and found large dimples at the mid-plane of the bend bar where stress tri-axiality would be the highest.
C. Measurements of ductility
The three most common metrics for ductility are uniform elongation, total strain at failure, and area reduction. Uniform elongation, or the strain at peak load, was typically ∼6% and the total strain at failure was approaching 10%. For all specimens, contraction along the width was relatively small, varying between 2.5–5%. The thickness reduction however was much more extensive as evident in the profiles shown in Fig. 5. An estimate for area reduction was taken from specimen S14 that failed along a single local neck. The fracture surface was entirely of the dimpled cup profile providing a more straight-forward geometry for the measurement. Taking into account variations in final thickness across the width, the reduction in area was determined to be approximately 75%. The specimens with more complex fracture surfaces obfuscate accurate area reduction measurements but estimates were at least 30%. From volume conservation, the final cross-sectional area can be converted into a true fracture strain with εaxial = ln(A initial/A final) = ln(L final/L initial) = ln(1/1 − q) where q is the area reduction. From this relation, elongation should always be larger than the area reduction. The observed 75% area reduction then corresponds to a fracture strain of 139% and even for those specimens whose cross-sections only reduced by 30%, the true fracture strain is 36%.
A disparity between area reduction and total strain at failure has been noted in several NC studies. For electrodeposited NC Ni, Gu et al.Reference Gu, Lian, Jiang and Jiang14 measured 7.5–8.3% elongation with about 50% thickness reduction at the fracture surface and Brooks et al.Reference Brooks, Palumbo, Hibbard, Wang and Erb20 measured elongations up to ∼10% with area reductions spanning ∼30 to 45% depending on the specimen thickness. This issue is also relevant to UFG metals. Ti made by equal channel angular pressing (ECAP) from Stolyarov et al.Reference Stolyarov, Zhu, Alexandrov, Lowe and Valiev36 had elongations of 10–14% with area reductions around 57–61%. ECAP UFG Cu produced by Wang et al.Reference Wang, Ma and Chen25 could elongate 15–30% with 70–90% area reduction, whereas that of Valiev et al.Reference Valiev, Alexandrov, Zhu and Lowe34 had 54.8% elongation with 51% area reduction. Even electrodeposited UFG Cu tested by Zhang et al.Reference Zhang, Jiang, Lian and Jiang21 had an elongation of ∼26% while the area reduction was ∼33%. The reason elongation is often not commensurate with the area reduction can be attributed to the fact that axial strain is commonly measured as an average quantity along the entire gage, whereas area reduction is measured locally at the point of fracture. Also the resolution limitations of strain measurement techniques preclude detection of highly localized deformation inside narrow local necks and shear bands. For the Ni–Fe of this study, the effectiveness of DIC breaks down at the formation of the local neck. The tracking particles and optics were not configured at sufficiently high spatial resolution to detect the strain inside the 10 µm wide local neck.
IV. DISCUSSION
Ductility can be interpreted as being governed by three factors: (i) there is the metallurgical, i.e., the material’s inherent capacity to flow, (ii) the material’s intrinsic resistance to instability formation as governed by work hardening and strain rate sensitivity, and (iii) extrinsic factors such as geometry for which certain configurations can encourage unstable flow. Each of these factors affects the interpretation of ductility. For example, premature neck formation may result in low elongation at fracture; however from the metallurgical perspective, the material may still be considered quite ductile if there was extensive plasticity within the neck. The following discussion draws on the experimental observations from this study as well as those surveyed from the published literature to better understand how the three factors influence ductility.
A. Intrinsic ductility: available strain accommodation mechanisms
Intrinsic or metallurgical ductility is controlled by the availability of atomic level processes that allow accommodation of substantial plastic deformation prior to final fracture. Most studies, including this one, only speculate on the active deformation mechanisms using the observed rate sensitivity and grain size. From thermodynamic formulations,Reference Taylor68,Reference Schoeck69 strain rate sensitivity is linked to the activation volume (v), a measure of the average volume of the atomic structure involved in deformation. Following Wei,Reference Wei55 the rate sensitivity can be related to the activation volume by m = (√3)kT/σflowv where k is the Boltzmann’s constant and T is the absolute temperature. The apparent activation volume determined for the NC Ni–Fe of this study was 16b3 which is less than 100 + b3 volumes associated with the intragranular dislocation activity of coarse grain metals. This measurement seems to be sensible as it is on par with those of other small grain metals such as 20–50b3 measured for NC Ni,Reference Wang, Hamza and Ma11,Reference Dalla Torre, Spatig, Schaublin and Victoria18,Reference Wang, Hamza and Ma70 10–55b3 measured in NC Al,Reference Gianola, Warner, Molinari and Hemker71 20–30b3 measured in NC CuReference Guduru, Murty, Youssef, Scattergood and Koch32 and 4.5–14.6 b3 reported for NC Au5.
The four most common deformation mechanisms for NC metals are dislocations and twins initiated from GBs, GB sliding, GB motion, and Coble creep. The emission and absorption of dislocations at the GB has been detected in molecular dynamics simulations,Reference Van Swygenhoven, Derlet and Hasnaoui72 and a model has been proposed by Asaro and SureshReference Asaro and Suresh73 who estimate that such a mechanism requires an activation volume of the order of 3–10b3 which is similar to the volumes measured experimentally. Mechanically driven grain coarsening through GB motion can also contribute to NC deformation. When active in NC Al, this mechanism has been reported to have v = 10–55b3 (Ref. Reference Gianola, Warner, Molinari and Hemker71) and support up to 20% elongation.Reference Gianola, Van Petegem, Legros, Brandstetter, Van Swygenhoven and Hemker22 In the present Ni–Fe study, FIB dissection was used to cut into the cross-section of a local neck to check for grain growth but no coarsening was readily detected. Sliding is another plausible mechanism and is often attributed to the deformation of superplastic materials with m > 0.4.Reference Sherby and Wadsworth74 Although m = 0.4 is higher than the rate sensitivities reported for small grained metals, simulations by Van Swygenhoven et al.Reference Van Swygenhoven, Derlet and Hasnaoui72,Reference Van Swygenhoven and Derlet75 have shown that the atomic processes that facilitate sliding are similar to those active during dislocation emission from GBs. This observation suggests that more than one mechanism may be active. The work of Kumar et al.Reference Kumar, Suresh, Chisholm, Horton and Wang76 support this notion. Kumar et al. performed a comprehensive mechanism study investigating NC Ni through in-situ techniques and found that “dislocation emission at grain boundaries together with intragranular slip and unaccommodated grain boundary sliding facilitate the nucleation of voids at boundaries and triple junctions” leading to final failure.
Coble creep, characterized with m = 1 and v = 1b3, is a final mechanism that needs to be addressed. Creep has been proposedReference Coble77–Reference Masumura, Hazzledine and Pande79 to be significant in NC materials even at room temperature (RT) due to the plethora of grain boundaries available for easy diffusion. Experimental data however is somewhat mixed regarding the impact of creep. Sanders et al.,Reference Sanders, Rittner, Kiedaisch, Weertman, Kung and Lu80 loaded Cu with 10 nm grains to ∼50 MPa at 0.28 T melt and measured a creep rate of 8 × 10⁻⁹ s−1. In contrast, a study by Cai et al.Reference Cai, Kong, Lu and Lu81 measured a steady state creep rate in electrodeposited Cu with 30 nm grains to be 10−6 s−1 at 313 K with an applied stress of ∼150 MPa. Although the respective publications should be consulted for full details regarding the material and experimental similarities and differences, these observations suggest that at the low end of the quasi-static strain rate regime, creep should be considered as in the case of Cai et al., it can be a nonnegligible deformation mechanism.
Given that NC metals exhibit substantial area reductions during tensile testing (see Sec. III. C), it appears that the GB mediated processes discussed above work in concert to facilitate plastic flow providing ample intrinsic ductility. A simple way to confirm whether or not these mechanisms provide intrinsic ductility has been inspired by the work of Lu et al.Reference Lu, Sui and Lu82 where high purity fully dense electrodeposited NC Cu was elongated by 5100% through rolling. Such a high degree of deformation certainly suggests that the Cu has metallurgical ductility. The benefit to rolling is that the deformation is more uniform diminishing the propensity for necking.
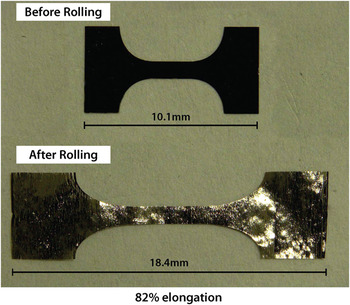
A rudimentary rolling experiment was conducted on one of the Ni–Fe tensile specimens from the present study. The Ni–Fe foil was sandwiched between two 125 μm thick Ni shims and rolled at RT in a bench top hand-cranked rolling mill. As shown in Fig. 6, the Ni–Fe was able to elongate by 82%. In comparison to uniaxial tension, it is recognized that rolling should produce higher elongations for nano-, micro- and coarse-grained metals; however, if the material was inherently brittle, an elongation of 82% would not be expected. Several partial cracks had formed on the edge of the Ni–Fe, but the specimen as a whole remained intact and had not failed catastrophically. This elongation, more commensurate with the area reduction measured during tension, suggests that the Ni–Fe indeed has ample atomic level processes that allow it to accommodate appreciable deformation. Due to its ease of implementation, rolling is therefore a simple complementary experiment to uniaxial tensile testing that provides an expeditious path toward evaluating intrinsic ductility.
82% elongation of nanocrystalline Ni–Fe achieved by rolling.

B. Intrinsic ductility: Resistance to necking
In uniaxial tension, the first instability that typically occurs is a diffuse neck initiating when geometric softening overcomes hardening. By differentiating F = σA, the outcome is dF = Adσ + σdA, where F is the force, σ is the stress, and A is the area. The term Adσ represents hardening, whereas σdA represents geometric softening since the cross-section contracts to conserve volume as the specimen elongates. A basic criteria to predict the onset of unstable flow is when an increment of deformation is no longer accompanied by a rise in load i.e., dF = 0. The diffuse neck may lead to a fracture; however, it is also possible to develop a subsequent instability in the form of a local neck as described in Sec. III. B.
In 1885, ConsidèreReference Considère83 outlined a construct for an isotropic flaw-free rate insensitive material to identify the onset of diffuse necking at max load. If it is assumed that the flow curve can be described by  ${\rm{\sigma }} = K{\rm{\varepsilon }}^n$, where σ is the flow stress, ε is the strain, K is a constant and n is the strain hardening exponent, then the strain at peak load equals the strain hardening exponent. As
 ${\textstyle{{{\rm{d\sigma }}} \over {{\rm{d\varepsilon }}}}} = n({\textstyle{{\rm{\sigma }} \over {\rm{\varepsilon }}}})$ and max load occurs when
 ${\textstyle{{{\rm{d\sigma }}} \over {{\rm{d\varepsilon }}}}} = {\rm{\sigma }}$ so diffuse necking begins at ε = n. Likewise, the local neck will form when ε = 2n as only the thickness decreases to afford tensile elongation such that
 ${\textstyle{{{\rm{d\sigma }}} \over {{\rm{d\varepsilon }}}}} = - {\textstyle{{{\rm{\sigma }}w{\rm{d}}t} \over {{\rm{d\varepsilon (}}wt{\rm{)}}}}}$ with
 ${\textstyle{{{\rm{d}}t} \over t}} = {\rm{d\varepsilon }}_{{\rm{thick}}} = ( - {\textstyle{{{\rm{d\varepsilon }}} \over 2}})$, thus
 ${\textstyle{{{\rm{d\sigma }}} \over {{\rm{d\varepsilon }}}}} = {\textstyle{{\rm{\sigma }} \over 2}}$.
Later in 1967, HartReference Hart84 proposed a stability criteria taking into account both work hardening and strain rate sensitivity. Hart identified instability when the smallest slice of the cross-section decreases faster than the rest of the homogeneous cross-sections and this occurs when γ ≥ 1 − m no longer holds. Here γ is the dimensionless work hardening coefficient [γ = (1/σ)(∂σ/∂ε)], and m is the rate sensitivity. Several researchers, including Jonas et al.,Reference Jonas, Holt and Coleman85 Kocks et al.,Reference Kocks, Jonas and Mecking86 Ghosh,Reference Ghosh87 and Hutchinson and Neale,Reference Hutchinson and Neale88 have raised issue with Hart’s approach and have offered stability criteria of their own. Although Hart addresses these disputes regarding his method in a subsequent publication,Reference Lin, Hirth and Hart89 it seems that questions still remain regarding how effective work hardening and rate sensitivity are at suppressing unstable flow.
Surveying the various analytic and computational approaches,Reference Hart84–Reference Lin, Hirth and Hart89 the onset of unstable flow is not only affected by the constitutive equation used and whether or not the analysis is linearized but also by the type of imperfection present in the tensile bar. Consider the comparison of two cross-sectional perturbations: one that is purely geometric with the underlying material in pristine condition, and another of the same shape made by mechanical damage with the microstructure at the imperfection site being hardened. The hardened mechanical imperfection will more readily resist localization upon tensile loading compared to a pristine geometric flaw. The chosen condition for unstable flow is also important. Hutchinson and Neale,Reference Hutchinson and Neale88 e.g., use dε0/dε = 0 where ε0 is the strain in the homogenous section and ε is the strain inside the developing neck. Such a criteria does not necessarily coincide with dF = 0 and can occur beyond the limit of uniform elongation making it difficult to connect this criteria to experimental data sets. As stated by Pardeon et al.,Reference Pardoen, Coulombier, Boe, Safi, Brugger, Ryelandt, Carbonnelle, Gravier and Raskin90 “a better understanding of plastic localization by necking or by true material instabilities heavily relies on a better understanding of the strain hardening and possible microstructure evolution mechanisms leading to rate dependent behaviors…” Irrespective of the approach one takes to determining flow stability, higher amounts of work hardening and rate sensitivity will provide a higher resistance to necking.
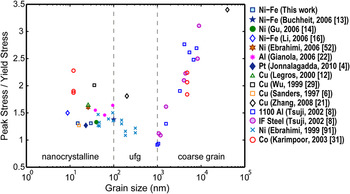
In terms of work hardening, NC metals have a limited capability as the small nano-grains do not support large dislocation tangles. A quick way to assess the work hardening of NC metals is to consider the ratio of peak stress to yield stress. This ratio has been plotted against grain size in Figure 7 using data extracted from a number of small grained metal studies.Reference Jonnalagadda, Chasiotis, Yagnamurthy, Lambros, Pulskamp, Polcawich and Dubey4,Reference Sanders, Eastman and Weertman6,Reference Tsuji, Ito, Saito and Minamino8,Reference Legros, Elliott, Rittner, Weertman and Hemker12–Reference Gu, Lian, Jiang and Jiang14,Reference Li and Ebrahimi16,Reference Zhang, Jiang, Lian and Jiang21,Reference Gianola, Van Petegem, Legros, Brandstetter, Van Swygenhoven and Hemker22,Reference Wu, Du, Zhang, Liu, Zhou, Li, Xiong and Bai29,Reference Karimpoor, Erb, Aust and Palumbo31,Reference Ebrahimi, Ahmed and Li52,Reference Ebrahimi, Bourne, Kelly and Matthews91 It is seen that for grains in the NC and UFG regime, this ratio (σUTS/σyeild) has an average value of 1.5, whereas the ratio (σUTS/σyeild) begins to easily exceed 2.0 as the grain size surpasses 1 µm.
A plot comparing the ratio of peak stress to yield stress against grain size.

With regard to strain rate sensitivity, from Ref. Reference Wei55, it is again noted that small-grained FCC metals like Al, Cu, and Ni often have rate sensitivities between 0.01 and 0.1. A few systems have m > 0.1 such as ECAP Cu tested by Valiev et al.Reference Valiev, Alexandrov, Zhu and Lowe34 where a total elongation of 55% was achieved with m = 0.14. Although m is often <0.1, the work of Hutchison and NealeReference Hutchinson and Neale88 suggests that even a small rate sensitivity can provide sizable resistance to unstable flow. This bodes well for small grain metals that need to compensate for their low amount work hardening; however from the Hutchinson analysis, it seems that this does not necessarily mean that higher rate sensitivity leads to a significant increase in attainable strain before peak load. Rather, the rate sensitivity can help extend a quasi-stable flow regime as Ghosh describes in Ref. Reference Ghosh87. Essentially after peak load, initial growth of the neck may be minute so that deformation also continues in the material outside of the neck. Only at a later stage when all deformation occurs within the neck is the flow fully unstable. This quasi-stable regime, between the onset of necking and catastrophic necking where all deformation occurs within the neck, can be extended by increases in strain hardening and strain rate sensitivity. There are a few experimental reports to support this concept. From the engineering stress–strain curve in the publication by Valiev et al.,Reference Valiev, Alexandrov, Zhu and Lowe34 it is estimated that ∼80% of the 55% total strain for ECAP Cu occurs after peak load. In a different study, ECAP Cu pulled in tension by Wang and MaReference Wang and Ma37 at 10−4 s−1 had m = ∼0.009 and achieved 15% total strain. Again from the engineering stress–strain curve, it appears that ∼80% of the deformation is post uniform. Similar behavior is reported again by Wang et al.Reference Wang, Ma and Chen25 in another Cu study. Although low work hardening means the end of uniform elongation is achieved relatively quick, the higher rate sensitivities of NC metals may afford extensive quasi-stable flow after peak load. This suggests that using uniform elongation, which often works well for bulk metals with relatively high work hardening and low m, may not fully describe the intrinsic resistance unstable flow for NC metals.
C. Extrinsic aspects of ductility
1. Geometry
The geometry of a tensile specimen can exacerbate instability formation reducing the amount of attainable elongation. Processing routes available to produce NC metals typically restrict the specimen to a thin sheet-like configuration with the gage length (L) > width (W) >> thickness (T). It is not the size of each dimension that is critical but rather the aspect ratios. Simulations on tensile bars with rectangular cross-sections by TvergaardReference Tvergaard92 have shown that as the W approaches L, diffuse neck formation is suppressed. If L is on par with W, then the rigid constraint at the grip edge is felt in the gage hindering the Poisson contraction necessary to form the hour-glass shaped diffuse neck. Tvergaard also notes that local necking effects develop as W/T begins to surpass 3. Experimentally, Brooks et al.Reference Brooks, Palumbo, Hibbard, Wang and Erb20 and Zhao et al.Reference Zhao, Guo, Wei, Dangelewiez, Zhu, Langdon, Zhou, Lavernia and Xu35,Reference Zhao, Guo, Wei, Topping, Dangelewicz, Zhu, Langdon and Lavernia60 have found local necking to become prominent when W/T ≥ ∼8. This behavior can be reconciled by considering the fact that when T is small, it is more sensitive to perturbations allowing deformation to easily concentrate over a length scale on par with the thickness and thus form the local neck. A round tensile bar whose symmetry allows the cross-section to shrink uniformly would help alleviate local necking; however this configuration is not common to NC tensile specimens. Only Refs. Reference Stolyarov, Zhu, Alexandrov, Lowe and Valiev36 and Reference Tellkamp, Melmed and Lavernia27 from the data plotted in Fig. 1 use the round bar configuration while numerous references had W/T ≥ 8.
Taking note of local necking is important as this failure mode can considerably reduce total elongation. When a local neck forms, only the thickness reduces to accommodate tensile elongation. If a critical thickness strain is assumed, that value is then reached sooner under the confines of local necking. The exact same specimen but with a smaller width to thickness disparity could attain significantly more elongation. This has been demonstrated by Zhao et al. in coarse-grainedReference Zhao, Guo, Wei, Topping, Dangelewicz, Zhu, Langdon and Lavernia60 and UFGReference Zhao, Guo, Wei, Dangelewiez, Zhu, Langdon, Zhou, Lavernia and Xu35 Cu and by Brooks et al. in NC NiReference Brooks, Palumbo, Hibbard, Wang and Erb20, where having T approach W so that the cross-section is more symmetric resulted in more elongation at failure. From the work of Brooks et al.,Reference Brooks, Palumbo, Hibbard, Wang and Erb20 it is estimated (using Fig. 5 from Ref. Reference Brooks, Palumbo, Hibbard, Wang and Erb20) that the thinner samples had ∼3.8% elongation at fracture, whereas thicker specimens could elongate ∼7.3% before failure, almost a 50% improvement.
One may think that well-known material testing standards have ameliorated such geometric issues; however, even ASTM guidelines are not entirely satisfactory in regard to ductility measurements. The ASTM E8/E8M Standard Test Method for Tension Testing of Metallic Materials93 explicitly notes that for round specimens “it is important the gage length for measurement of elongation be four times the diameter of the specimen when following E8 and five times the diameter of the specimen when following E8M.” However for rectangular samples, the common configuration for NC metals, the specifications are not as clear. A ratio of L/W = ∼4 is dictated but little guidance is given with regard to thickness. Brooks et al.Reference Brooks, Palumbo, Hibbard, Wang and Erb20 highlight the gravity of this issue by testing ASTM E8 compliant NC Ni specimens of the “subsize” configuration with varying thickness. In that study, specimens for which W/T ≥ 8, failed at a much lower total elongation compared to specimens with W/T < 8.
It is therefore desirable to have means to isolate and account for geometric effects when measuring the total elongation of a tensile specimen. One approach comes from the work of BarbaReference Barba94 and UnwinReference Unwin95 who put forth the notion that for a given material system, geometrically self-similar bars of different sizes will develop similar necks and thus have similar total elongations. This concept is more formally stated by Unwin with the equation: εtotal = εuniform + (B√A/L), where εtotal is the strain at fracture, B is a material constant, A is the cross-sectional area, L is the gage length, and εuniform is the uniform strain, assumed to be a constant. The validity of the above relationship, which has elongation vary linearly with geometry (√A/L), was demonstrated by UnwinReference Unwin95 and the work of others such as Kula and FaheyReference Kula and Fahey96 and Brooks et al.Reference Brooks, Palumbo, Hibbard, Wang and Erb20 also provide support. Essentially the √A/L term accounts for the size of the diffuse neck and how it affects the macroscopic axial strain measurement. For a given L, a larger cross-section will develop a larger neck and since the elevated deformation within the neck is more spread out along L, higher elongations will be measured.
Unwin’s equation will allow one to predict elongation regardless of the sample size, however, it is important to keep in mind the four main assumptions under which the Unwin relationship was constructed: (i) uniform elongation is constant, (ii) the gage is not so short, the measurement points fall within the neck, (iii) elongation is not affected by the form of the cross-section, and (iv) the points on the gage used to measure elongation are not too close to the enlarged ends of the test piece. Altogether, these assumptions bound the values L/W, W/T, and √A/L and thus offer a framework around which to develop a specimen configuration for predictable results.
Given L > W ≥ T, a small L too close to W risks violating condition (i) as diffuse necking becomes suppressed, thus affecting uniform elongation. Therefore, L/W = 4, as per the ASTM standard, is invoked. At this point, it is possible to estimate an upper bound for the value of √A/L. Taking L/W = 4 and W = T, √A/L should not exceed 0.25. This is in line with a notion from UnwinReference Unwin95 who when testing short tensile bars remarked that “it would be desirable if possible to adopt the rule that for all these short test bars the gauge-length should be taken so that” √A/L = 0.25. For a lower bounds, we again assume L/W = 4 but now set W/T = 8 which is the point at which ZhaoReference Zhao, Guo, Wei, Dangelewiez, Zhu, Langdon, Zhou, Lavernia and Xu35,Reference Zhao, Guo, Wei, Topping, Dangelewicz, Zhu, Langdon and Lavernia60 and BrooksReference Brooks, Palumbo, Hibbard, Wang and Erb20 found local necking to become prominent. Having W/T > 8 causes the form of the cross-section to impact the elongation violating condition (ii). The value of √A/L should therefore not go below 0.09.
It is worth noting that ASTM E8/E8M does recognize the effect √A/L can have on elongation. In the standard's appendixes, it is written that “specimens with smaller L 0/(A 0)1/2 ratios generally give greater elongation and reduction in area values” and “holding the L 0/(A 0)1/2 ratio constant minimizes, but does not necessarily eliminate, differences.” The E8 appendixes also makes note of tapered gages, a geometric feature not yet touched up here. According to ASTM E8, a taper incorporated to promote failure within the gage, “can result in lower elongation values. Reductions of as much as 15% have been reported for a 1% taper.” A taper of the gage is therefore another geometric aspect of the tensile specimen that should be considered as having a nonnegligible impact on ductility.
Overall, if the above guidelines were adhered to, then complications from local necking would be minimized and elongation would vary linearly with √A/L allowing any geometric differences to be taken into account. Although this would enable more direct comparisons of ductility from study to study, it is recognized that such geometric constraints can be in conflict with actual processing routes available for feasibly manufacturing NC tensile specimens.
2. Flaws and damage tolerance
It is obvious that the synthesis of flaw-free specimens will also enhance ductility as low total elongation may be caused in part by premature failure due to the presence of preexisting defects. For the Ni–Fe of this study, the failure process began with necking instability and final fracture ensued at preexisting edge flaws or surface pits as shown in Fig. 4(d). Li and EbrahimiReference Li and Ebrahimi16 report that an NC Ni–Fe specimen with defects had a plastic elongation of only 2.1%, whereas a relatively flaw-free specimen had a plastic elongation of 6%.
Flaws in thin film tensile specimens with small grains can come from the foil synthesis or from the preparation of the test specimen. As outlined by Koch et al.,Reference Koch40–Reference Koch, Youssef, Scattergood and Murty42 synthesis of NC materials can be classified as being a one-step or a two-step process. Single-step processes include severe plastic deformation (SPD), vapor deposition, and electro-deposition, whereas two-step methods typically involve creating nano-powders via milling followed by a compaction step. As mentioned by Koch et al. two-step approaches can suffer from compaction challenges such as incomplete bonding amongst particles and porosity giving specimens less than theoretical density. Overtime, continued processing improvements have reduced such adverse issues. In 1991, NC Cu and Pd made by Nieman et al.Reference Nieman, Weertman and Siegel7 via inert gas condensation and compaction had an average density of 90.5% and 86% of the their respective theoretical values. By 1997, Sanders et al.Reference Sanders, Eastman and Weertman6 using a similar process achieved densities above 97% of the theoretical value for the same metals and in 2004 Youssef et al. developed a milling and in-situ consolidation processReference Youssef, Scattergood, Murty and Koch97 to obtain fully dense artifact-free NC copper. This “flaw-free” CuReference Youssef, Scattergood, Murty, Horton and Koch9 with 23 nm-sized grains could elongate 15.5% before failure, more than seven times higher than the 2.1% elongation measured by Legros et al.Reference Legros, Elliott, Rittner, Weertman and Hemker12 for 26 nm grained Cu made via inert gas condensation and compaction.
Electro-deposition, a single-step synthesis process, can also suffer from porosity. Depending on the bath chemistry, current, etc., it is possible to incorporate hydrogen bubbles into the NC metal film being plated causing hydrogen pitting. The Ni–Fe of the present study clearly had some pitting issues as evident in the surface flaw shown in Fig. 4(d). The extent of subsurface pits was not quantitatively measured however if an extensive amount of pores were preexisting in the grain structure, it is doubtful that such significant plasticity within the neck, as seen in Fig. 5(a), would be possible. Brooks et al.Reference Brooks, Palumbo, Hibbard, Wang and Erb20 were able to successfully control the pitting issue in electro-deposited Ni with samples consistently achieving 6–8% elongation. Conversely, when the pitting was not accounted for, the Ni specimens had a more random behavior and would fail anywhere between 2 and 4 % elongation (see Fig. 4 of Ref. Reference Brooks, Palumbo, Hibbard, Wang and Erb20). Brooks et al. also performs a detailed stochastic study, using a Weibull analysis, to evaluate how elongation varies with respect to flaws and sample thickness; the reader is directed to Ref. Reference Brooks, Palumbo, Hibbard, Wang and Erb20 for full details.
Two additional issues shared amongst all synthesis methods are surface roughness and contamination. Surface roughness from nonuniform thin film deposition, hydrogen pitting of electro-deposited material, and tensile specimen preparation methods such as micro milling and electro-discharge machining can also serve as fatal flaw sources in the NC metals. Roughness introduced by these latter processes is often removed by polishing with slurries containing 0.25–0.1 µm-sized particles. Nieman et al.Reference Nieman, Weertman and Siegel7 demonstrated the importance of polishing the faces and sides of tensile specimens measuring failure at less than 100 MPa for unpolished NC Pd, whereas polished samples required over 200 MPa of stress to initiate failure. Contamination is another concern as it is possible for impurities to interfere with the atomic level mechanisms facilitating the tensile elongation of the NC metal. One example of this comes from the work of Gianola et al.Reference Gianola, Mendis, Cheng and Hemker98 who showed that oxygen impurities can inhibit grain boundary migration deformation mechanisms in NC Al.
In the present study on Ni–Fe, it is noted that prior to the onset of failure, deformation had entirely localized into a very small neck region. This localization would have likely permitted very little additional macroscopic stretch even if the material were free of preexisting flaws and had to undergo a natural flaw initiation process. As previously estimated from the area reduction, the local strains inside the neck are >30%, which is indicative of a damage tolerant material that can accommodate preexisting flaws. Although this observation provides a glimpse into flaw tolerance, a direct quantitative evaluation through fracture toughness testing is truly needed. Unfortunately, fracture toughness, like ductility, can be sensitive to geometry. Valid linear elastic fracture toughness measurements are only possible when the plastic zone is small compared to the cross-sectional area, a condition that can be difficult to achieve with the customarily thin specimens for NC metals, such as in the present 10 μm thick Ni–Fe films.
V. CONCLUSIONS
Tensile experiments on NC Ni–Fe exhibited relatively low total elongation (up to 10%), but significant area reduction (up to 75%) with the presence of ductile dimples on the fracture surface. These observations can be rationalized in the context of (1) the availability of adequate strain accommodation mechanisms affording intrinsic metallurgical ductility, (2) low work hardening and only modest strain-rate sensitivity providing little resistance to neck formation, and (3) a thin film geometry that promotes localized necking. More importantly, these observations highlight general concerns regarding comparisons of ductility across studies, and the need for better standardization or guidelines for reporting.
ACKNOWLEDGMENTS
The authors would like to thank M. Rye for TEM specimen prep, Dr. B.G. Clark for TEM imaging, and Dr. A.M. Rowen for electro-deposition. This work was funded by the U.S. Department of Energy, Office of Basic Energy Sciences, Division of Materials Sciences and Engineering. Specimen preparation and electron microscopy characterization was performed, in part, at the Center for Integrated Nanotechnologies, an Office of Science User Facility operated for the U.S. Department of Energy (DOE) Office of Science by Los Alamos National Laboratory (Contract No. DE-AC52-06NA25396) and Sandia National Laboratories (Contract No. DE-AC04-94AL85000). Sandia is a multiprogram laboratory operated by Sandia Corporation, a Lockheed Martin Company, for the United States Department of Energy’s National Nuclear Security Administration under Contract No. DE-AC04-94AL85000.