INTRODUCTION
Economic profit of dairy farms largely depends on milk revenues and feeding costs. In 2006, Dutch dairy farming feed costs averaged €6·49/100 kg milk. This represented 0·207 of the milk revenues of €31·28/100 kg milk (LEI 2006). Concentrate purchases are a major cost entry for farms feeding concentrates. Optimal supply of concentrates from the beginning of the lactation is important to achieve a good economic result.
During early lactation, when feed intake and daily milk yield increase, energy intake is often insufficient to meet the cow's energy requirements (DeVries & Veerkamp Reference DeVries and Veerkamp2000; Coffey et al. Reference Coffey, Simm and Brotherstone2002; Beerda et al. Reference Beerda, Ouweltjes, Šebek, Windig and Veerkamp2007). The difference between a cow's net energy intake and its net energy requirement is the energy balance. Early in lactation dairy cows enter into a negative energy balance and body reserves are mobilized to avoid loss in milk yield. Concentrates are fed to reduce the negative energy balance (Van Arendonk et al. Reference Van Arendonk, Nieuwhof, Vos and Korver1991). Energy intake is increased by feeding substantial amounts of energy-rich concentrates, especially during early lactation. In addition, this challenges the cows to increase their peak yield (Ekern & Vik-Mo Reference Ekern and Vik-Mo1983).
A common strategy on Dutch dairy farms is to start with a low level of concentrates at calving, followed by a linear increase during the first week of the lactation (Kokkonen et al. Reference Kokkonen, Tesfa, Tuori and Syrjälä-Qvist2004). Around the lactation peak, from week 3 until weeks 10–14, concentrate supply is kept at a constant level related to the cow's parity. After that, concentrate supply is lowered corresponding to the decline in daily milk yield. The amount of concentrates fed during the decline in milk yield is based on the expected net energy requirement. This expectation is based on a feed evaluation system (e.g. Van Es Reference Van Es1978), utilizing a model that predicts the net energy requirement of a dairy cow according to the cow's actual milk yield and an assumption of the cow's roughage intake. Feed evaluation systems are primarily intended for comparison of different feedstuffs (Cant Reference Cant, Dijkstra, Forbes and France2005) and are used in retrospect to evaluate the actual feeding (Okine et al. Reference Okine, Wang, Goonewardene, Mir and Liu2001). Feed evaluation systems are also used for the planning of rationing at the herd level over a certain period for managing farm resources. For these herd level decisions, feed evaluation systems perform well, especially when the prediction or measurement of feed intake and determination of energy content of ration components are accurate (Buckmaster & Muller Reference Buckmaster and Muller1994). However, the use of feed evaluation systems for determining daily individual concentrate supply is not feasible due to a lack of information on individual roughage intake and body weight change.
Two strategies for individual allocation of concentrates were investigated by Maltz et al. (Reference Maltz, Kroll, Spahr, Devir, Genizi and Sagi1991, Reference Maltz, Devir, Kroll, Zur, Spahr and Shanks1992) in comparison with total mixed rationing. The first strategy was based on the rule that 1 kg concentrates corresponds to 2 kg milk and it was concluded that milk yield cannot serve as the sole criterion for concentrate supplementation and that changes in body weight should also be taken into account. The second strategy accounted for changes in body weight, but the results of Maltz et al. (Reference Maltz, Kroll, Spahr, Devir, Genizi and Sagi1991, Reference Maltz, Devir, Kroll, Zur, Spahr and Shanks1992) were inconclusive regarding the superiority of individual supplementation of concentrates. Although in both trials, individual performance was evaluated afterwards, actual individual milk yield response to concentrate intake was neither assessed nor used to forecast future individual performance.
The main objective of the current study is to determine the economic optimal concentrate supply for each individual cow after 3 weeks in lactation. For this purpose, the relationship between milk yield and increasing concentrate intake during early lactation will be established. This relationship in the current study is regarded as milk yield response to concentrate intake. The response is influenced by several factors, e.g. roughage intake, mobilization, etc. Estimated individual response parameters will include all these effects and will be used to determine the individual economic optimum. Economic prospects will be assessed by comparing results of individual optimization with current strategies for concentrate supply.
MATERIALS AND METHODS
The present study consists of two parts. In the first part, the observational study, a random coefficient model is presented to quantify individual variation in milk yield response to concentrate intake. In the second part, the simulation study, the economic prospects of exploiting individual variation are assessed, based on the estimated individual response parameters in the observational study.
Observational study
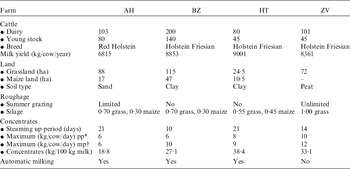
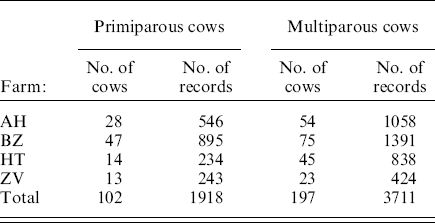
Data were collected in 2006 at four research farms in The Netherlands: ‘Aver Heino’ (AH), ‘Bosma Zathe’ (BZ), ‘High-tech’ (HT) and ‘Zegveld’ (ZV). AH was an organic dairy farm. AH, BZ and HT were farms milking with an automated milking system and ZV was a conventional dairy farm. Some farm characteristics are specified in Table 1.
Farm characteristics

* Primiparous.
† Multiparous.
The datasets, one for each farm separately, consist of daily milk yield (M) and concentrate intake (C)/cow/day during the first 3 weeks of lactation. At calving, the concentrate supply was 1–3 kg/day and after calving, concentrate supply was linearly increased over 2–3 weeks to a maximum that depended on parity. At BZ, HT and ZV conventional concentrates were supplied with 6·486 MJ NEL/kg dry matter (DM). AH is an organic farm, where organic concentrates were used with the same energy content but with a higher amount of grains. At AH, both the increase rate and the maximum supply for organic concentrates were lower than the maximum for conventional concentrates, because the content of glucogenic compounds is higher in organic concentrates. At BZ, the period after calving lasted 14 days and so the increase was more rapid than on the other farms. After 10 days, the concentrate supply was kept constant at the maximum level. At HT, the period after calving lasted 21 days. At ZV, the period after calving lasted 14 days and the maximum level of concentrate supply was higher than at BZ and HT, because the energy content of the roughage (entirely grass) was lower.
Concentrates were partly fed with external self-feeders and partly fed in the automatic milking systems on the robot milking dairies (AH, BZ and HT) or in the milking parlour on the conventional milking dairy (ZV). At AH, BZ and HT, cows were milked on average 2·38 times/day during early lactation. At ZV, milking was performed twice daily. Data from cows at ZV that calved in the summer of 2006 were not used, because concentrate intake was strongly limited due to extensive grazing.
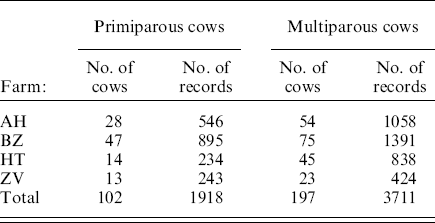
Outliers in milk yield, defined as observations that differed more than three times the standard deviation from the expected value for daily milk yield, e.g. because of illness, were excluded. Only cows with at least 15 complete daily records were used in the analysis. The remaining dataset for analysis consisted of 5629 records from 299 cows; 102 primiparous and 197 multiparous cows. The numbers/farm/parity are given in Table 2.
Numbers of cows and daily cow records per farm
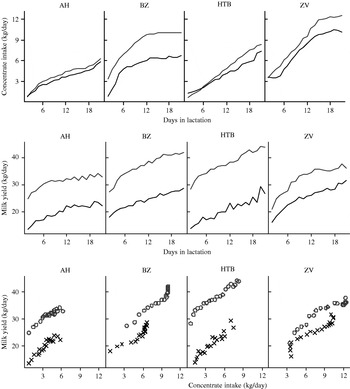
In Fig. 1, mean profiles of concentrate intake and milk yield/day are given for the four different farms, for primiparous and multiparous cows separately. Milk yield is also plotted against concentrate intake to indicate the response in milk yield to concentrate intake. At BZ, after 10 days, concentrate supply was kept constant, while milk yield continued to increase. The same phenomenon was observed, though to a lesser extent, at ZV.
Averaged concentrate intake v. days from calving (first row), averaged daily milk yield v. days from calving (second row). Averaged milk yield v. averaged concentrate intake at different days after calving (third row). Upper lines and symbols (o) are multiparous cows and lower lines and symbols (x) are primiparous cows.

Modelling milk yield response to a linear increase in concentrate intake during early lactation
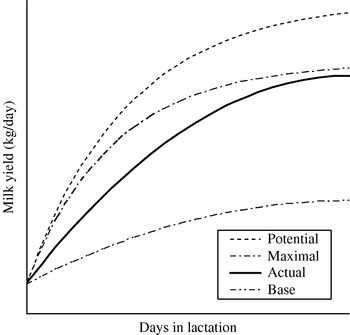
During early lactation, daily milk yield increases rapidly from around calving to a peak a few weeks later. After parturition, the growth of active alveoli increases to a maximum, 0·88 of the proliferation occurs in the first 2 weeks of lactation (Vetharaniam et al. Reference Vetharaniam, Davis, Upsdell, Kolver and Pleasants2003). This process is seen as the ‘inner drive’ for the cow to produce milk. The number of active alveoli, together with the maximum secretion rate, determines the potential milk yield. Milk secretion is inhibited by the udder filling which in turn depends on the alveolar and cysternal storage capacity of the udder in relation to milking frequency (Mepham Reference Mepham1976; Knight Reference Knight1982; Thornley & France Reference Thornley and France2007, pages 560–569, following Neal & Thornley Reference Neal and Thornley1983). Therefore, maximal milk yield depends on the number of milkings and cannot equal potential milk yield. The degree to which maximal milk yield is reached depends on the energy status of the cow (Vetharaniam et al. Reference Vetharaniam, Davis, Upsdell, Kolver and Pleasants2003), i.e. the amount of metabolizable energy above maintenance requirement supplied by feeding concentrates and roughage (Broster & Thomas Reference Broster, Thomas and Haresign1981). When no concentrates are fed, energy is only supplied by roughage intake and there will be only a slight increase in milk yield during early lactation due to mobilization of body reserves (Broster & Thomas Reference Broster, Thomas and Haresign1981). Concentrates are fed to increase energy supply and to enhance milk production. At higher levels of energy supply, daily milk yield will increase, the mobilization rate will decrease and bodyweight will increase. Consequently, with increasing daily concentrate intake, milk yield increases and approaches maximum milk yield. The profiles of potential (no limitations), maximal (only limited by number of milkings), base (feeding only roughage) and actual milk yield (feeding roughage and linear increasing concentrates) during early lactation are shown in Fig. 2.
Development of potential, maximal, actual and base milk yield during early lactation.

The development of milk production during early lactation is a complex non-linear dynamic system in which daily milk yield (and body weight change) are response (dependent) variables and concentrate intake is a controllable (independent) variable. The following model was used for the development of milk yield during early lactation. The model is a two-dimensional response surface, omitting higher order interactions:

where M(t,C) is the milk yield (kg/day) at lactation day t and concentrate intake C (kg/day), α0 is the intercept, milk yield at lactation day t=0 and concentrate intake C=0, α1, α2 are coefficients for linear and quadratic effect of time (days in lactation), β1, β2 are coefficients for linear and quadratic effect of concentrate intake, γ is the coefficient for interaction between time and concentrate intake.
In the current study, concentrate supply was increased linearly from the start of the lactation to a maximum, starting at a low level after parturition. Assuming that concentrate intake equals supply

with c 0 the intake at calving (t=0), linearly increasing with c 1 (kg/day).
The aim of the current study was to predict the optimal concentrate supply, in order to maximize gross margin (milk revenues minus concentrate costs).
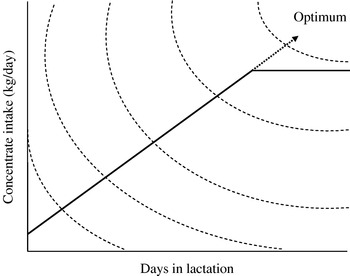
Figure 3 offers an example where the optimum is not reached because the increase in concentrate supply is stopped too early. Alternatively, in practice, the rate of concentrate increase could be too fast or the duration of concentrate increase could be too long, such that the level of concentrate supply has to be decreased to achieve the optimum.
Response surface of milk yield (dashed contour lines) during early lactation in relation to concentrate intake. Concentrate supply is increased in a linear manner to a plateau (solid line), but the optimum will be achieved if the increase is continued (dashed arrow).

Substitution of model (2) into model (1) yields a quadratic function describing the development of milk yield over time in terms of concentrate intake

Due to the linear relationship between concentrate intake and time, the effect of concentrate intake and time on milk yield cannot be estimated separately. Note that estimating the effects of concentrate intake and time separately is not the aim of the present study, but to predict M(C Opt), where milk revenues minus concentrate costs are maximal. The associated day in lactation is calculated using model (2). Please refer to Appendix 1 for details. Considering milk yield as a function of concentrate intake rather than time is analogous to Parks (Reference Parks1982) who considered weight of young growing animals as a function of cumulative feed intake explicitly, without taking time into consideration.
Incorporating individual variation in milk yield response to concentrate intake
To account for variation in response of milk yield to concentrate intake, model (3) is extended with fixed effects for parity and random effects for individual variation on the level of milk yield and response to concentrate:

where Mij is the daily milk yield (kg/day) for cow i of parity j, C is the concentrate intake (kg/day), β0 is the intercept for a primiparous cow (kg/day), τ0j is the effect of parity of the cow in intercept (kg/day), b 0i is the random effect of individual i in intercept (kg/day), β1 is the mean effect of linear concentrate intake for primiparous cows (kg/kg), τ1j is the effect of parity in the coefficient of linear concentrate intake (kg/kg), b 1i is the random effect of individual i in the coefficient of linear concentrate intake (kg/kg), β2 is the mean coefficient of quadratic concentrate intake for primiparous cows (kg/kg2), τ2j is the effect of parity in the coefficient for quadratic concentrate intake (kg/kg2), b 2i is the random effect of individual i in the coefficient of quadratic concentrate intake (kg/kg2), ∊it is the residual at day t (kg/day), representing residual variation.
Individuals' random effects b in the model are assumed to follow a multivariate normal distribution with mean 0 and covariance matrix Σb. The residuals ∊ are assumed to be normally distributed with mean 0, variance σ∊2 and (auto) correlation φ within an animal over time. Random effects b and ∊ are assumed to be mutually independent. Random effects for different animals are also assumed to be independent. Parameters β0, β1 and β2 are the population means for the primiparous cows, i.e. τ01=τ11=τ21=0.
Statistical analysis
Because there were structural differences between the farms in milking and feeding strategy, model (4) was fitted for each farm separately. Parameters were estimated by restricted maximum likelihood (REML) (Searle et al. Reference Searle, Casella and McCullouch1992). Calculations were performed with Genstat (Genstat Committee 2006). Only parameters that were statistically significant (P<0·05) were retained in the model.
Simulation study
To assess the economic prospects, a simulation was carried out for each farm separately, based on the estimated variance components from the observational study. Individual optimal settings (IOS) were compared with two other strategies assuming equal concentrate allocation for all individuals of the same parity. The first strategy was based on the current settings (CS) for concentrate supply at the end of the steaming up period on the research farms. The second strategy was based on the averaged optimal setting (AOS) for concentrate supply, ignoring individual random effects.
Optimal settings for concentrate allocation were determined by maximizing the gross margin (S), i.e. milk revenues minus feeding costs:

Here πM and πC are milk and concentrate prices (€/kg) and θ0 …2,ij were the estimated parameters of an individual. Concentrate intake is optimal when marginal milk revenues are equal to marginal concentrate costs. IOS followed from dS(C)/dC=0:
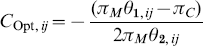
Economic evaluation could be based on first-order approximations, as presented in Appendix 2. However, some constraints have been included to allow for a solution of the optimization problem. Firstly, there must be an optimum, θ2,ij<0. Secondly, in practice, the concentrate supply is limited to avoid digestion problems, C Opt,ij⩽20. Therefore, the IOS for concentrate supply, corresponding milk yield and gross margin were calculated using a parametric Bootstrap method (Efron & Tibshirani Reference Efron and Tibshirani1993). The profit of individual concentrate feeding was calculated as the differences in gross margins between the different strategies. Details of the bootstrap are presented in Appendix 3. The 0·95 range and standard deviation were calculated for concentrate supply, milk yield and economic gain in order to display the potential variation between individuals for IOS.
For BZ, HT and ZV, the following prices (LEI 2006) were used: πM=0·3256 €/kg milk and πC=0·1814 €/kg concentrates. Prices were higher for the organic farm AH: πM=0·3829 €/kg milk and πC=0·2209 €/kg concentrates.
RESULTS
Observational study
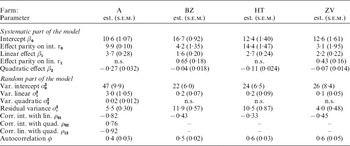
Parameter estimates and standard errors of model (4) are given in Table 3. The parameters of the systematic part of the model characterize the global population response curve including the effects of parity, consisting of the intercept and the linear and quadratic effect of concentrate intake on milk yield. The parameters of the random part consist of the variance components that quantify the individual variation in intercept and milk yield response on concentrate intake.
Parameter estimates and standard errors of means per research farm

The intercept predicts milk yield at the start of lactation when no concentrates are fed (C=0). The intercept is lowest for AH, 10·58 kg M/day, and highest for BZ, 16·65 kg M/day. As expected the intercept for multiparous cows is higher than the intercept for primiparous cows. Multiparous cows at ZV had the lowest intercept (12·56+3·06=15·62 kg M/day) and multiparous cows at HT the highest intercept (12·40+14·38=26·78 kg M/day). This is related to the energy intake from forage, at ZV the roughage consists exclusively of grass silage and at HT 0·45 of the roughage is maize silage.
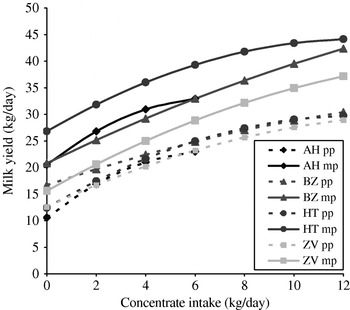
The milk yield response to concentrate intake at AH (organic) differs from the other farms; the linear effect (3·67 kg M/kg C) was higher, but there was a much more pronounced curvature, given the lowest quadratic effect (−0·267 kg M/kg2 C). This difference may be explained by the fact that organic concentrates consist mainly of grains and that the herd at AH consists of cows from a breed with a lower production level. The curvature at BZ was the least pronounced, probably underestimated due to a linear increase of concentrates during only 10 days. At the farms BZ and ZV, multiparous cows showed a significantly higher coefficient for linear concentrate intake than primiparous cows. Differences in milk yield response to concentrate intake between farms might also be explained by interaction with different forages across farms. Parity did not significantly affect the curvature. The fitted global response curves/farm/parity are given in Fig. 4.
Fitted mean milk yield response curves v. concentrate intake/farm/parity.

In addition to systematic differences in response between farms, random variation between individuals was found on all farms. A considerable amount of individual variation was captured by individual variation in the intercept (σ02), but there was also variation in the coefficient for linear concentrate intake (σ12). Individual variation in the coefficient for quadratic concentrate intake (σ22) was only significant at AH, at the other farms, this variance component appeared to be negligible. Variation between individuals in intercept, linear and quadratic coefficients was highest at AH. Individual random effects were negatively correlated, e.g. the higher the intercept the lower the linear response to concentrate intake.
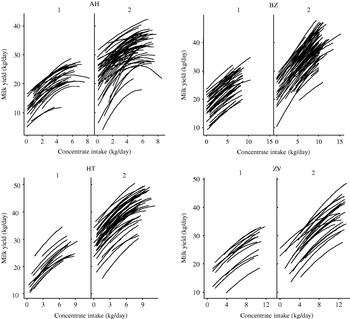
Figure 5 displays the estimated individual response curves, based on predicted random effects, the so-called best linear unbiased predictions (BLUPs) (Robinson Reference Robinson1991; Searle et al. Reference Searle, Casella and McCullouch1992) for all individuals.
Fitted individual milk yield response curves v. concentrate intake/farm. Different lines represent different cows (1=primiparous cows and 2=multiparous cows).

The residual variance (σ∊2) that quantifies variation around the individual profiles was higher at BZ and HT than at AH and ZV. This indicates that the variation within an individual over time was higher at BZ and HT than at AH and ZV. The estimated autocorrelation (φ) was approximately the same for all farms, showing that the residuals were positively correlated over time.
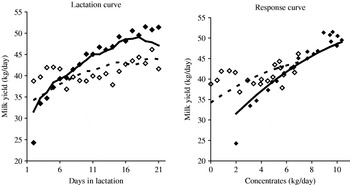
Observations and fitted values for a high- and low-responding multiparous cow at HT are given in Fig. 6, to illustrate the fit of the model. The figure shows the difference in response to concentrate intake. At the beginning of the lactation, there is only a slight difference in production level between these two cows. However, there is a quite large difference in milk yield increase during early lactation indicating a difference in response to linearly increasing concentrate intake. The linear response to concentrate intake for the high-responding cow was  and for the low-responding cow
 .
Lactation curve (left) and response curve (right) for two multiparous cows at HT. High-responding cow: observations (◆) and fitted values (solid line). Low-responding cow: observations (♦) and fitted values (dotted line).

Simulation study
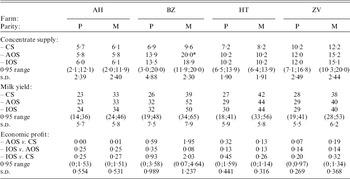
Table 4 contains a comparison of the results of different strategies for the setting of concentrate supply. With CS individual variation in response is not exploited. Results for CS are compared with AOS, based on the global optimum of the mean response curve and compared with the IOS, based on the individual optimum of each individual response curve.
Average concentrate supply (kg/day), milk yield (kg/day) and economic profit (€/day) after 3 weeks in lactation per farm and parity (P, primiparous; M, multiparous), compared using different strategies of concentrate supplementation (CS, AOS and IOS). Including 0·95 range and standard deviation (s.d.) for IOS

* Truncated, the calculated value is 22 kg.
At AH, concentrate supply for CS approximates the supply for AOS and IOS. At the other farms, concentrate supply for CS is below the supply for AOS and IOS, particularly at BZ. The mean concentrate supply differed only slightly between AOS and IOS. For IOS, the 0·95 range and standard deviation for concentrate supply are given to illustrate the potential variation between individuals.
Milk yield means differed slightly between CS, AOS and IOS at AH. At the other farms, the mean milk yield for AOS and IOS was higher than for CS, especially at BZ. For IOS, the 0·95 range and standard deviation for milk yield are given to illustrate the potential variation between individuals.
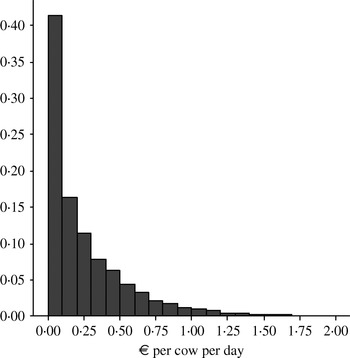
Profit was computed as the difference in gross margins for AOS v. CS, IOS v. AOS and IOS v. CS. At AH, concentrate supply for CS was close to optimal, so the application of AOS did not increase profit. At BZ, concentrate supply for CS was far from optimal, so the application of AOS can increase profit. At all farms, a further gain in gross margin was possible between IOS and AOS. The total gain in gross margin for IOS v. CS ranged from €0·20/cow/day to €2·03/cow/day. For profit in IOS v. CS, the 0·95 range and standard deviation are given to illustrate the potential variation between cows. In Fig. 7, the distribution of simulated gain in profit for IOS v. CS is given for HT multiparous cows. It is demonstrated that in 0·60 of cases, the profit will be greater than €0·10/cow/day and that profit can be as high as €1·10/cow/day in about 0·03 of cases.
Distribution of simulated profit IOS v. CS for HT multiparous cows.

DISCUSSION
In the current study, only data from the first 3 weeks of the lactation were analysed. In early lactation, several factors influence milk production, e.g. concentrate intake, roughage intake and mobilization rate (body weight change). The effects of all these factors and interactions between them were not completely modelled. Modelling of the complete system of feed energy utilization is complex and estimating all partial efficiencies for individuals is not feasible with limited data (Tess & Greer Reference Tess and Greer1990). Moreover, it is unnecessary to use the energy balance equation, because individual response on concentrate intake can be estimated during lactation and optimal concentrate supply can be predicted in combination with the associated time point, given the linear relationship between concentrate supply and days in lactation during the first week in lactation.
Feeding at optimal levels at the beginning of and during peak lactation will reduce negative energy balance and loss of body weight and body tissues in that period (Bines Reference Bines1976). This might also contribute to improved health and reproduction (DeVries et al. Reference DeVries, Beek, van der Kaal-Lansbergen, Ouweltjes and Wilmink1999). Optimal individual concentrate allocation applying IOS was in most cases higher than CS, so IOS seems to be clearly sufficient for milk production and maintenance of body condition. Application of IOS, particularly at BZ, resulted in extremely high optimal settings. At BZ, the period of linear increase of concentrates after calving was short compared to the other farms and this may have led to overestimated response parameters, especially the low curvature. For this reason, the profit estimated at BZ is based on extrapolation and should be viewed with caution.
High levels for concentrate supply are (on average) not normally recommended because of the risk to digestion, such as acute and sub-acute ruminal acidosis (Owens et al. Reference Owens, Secrist, Hill and Gill1998; De Brabander et al. Reference De Brabander, De Boever, Vanacker, Boucqué, Botterman, Garnsworthy and Wiseman1999). But with an individual dynamic approach higher levels for concentrate supply are applicable, as long as milk yield continues to respond to increasing concentrate supply and no digestive problems arise. In an individual dynamic approach, response is continuously evaluated and the optimum is automatically reduced if response decreases.
It is unlikely that milk yield response to concentrate intake remains constant after the first 3 weeks in lactation, because roughage intake, body weight and condition change over time. In addition, factors at farm level that influence individual response might change over time, e.g. silage constitution. For these reasons, the estimated individual response should be updated by recursive estimation during the remaining period of lactation. The individual optimum established after 3 weeks in lactation can be used as cow-specific prior information. Such a dynamic approach (West & Harrison Reference West and Harrison1997) is part of precision dairy farming (Wathes et al. Reference Wathes, Kristensen, Aerts, Berckmans and Cox2005). Prototypes of the dynamic approach to monitoring of response in milk yield to (changes in) concentrate allocation have been developed and tested by Duinkerken et al. (Reference Duinkerken, André and Zom2003) and André et al. (Reference André, Ouweltjes, Zom, Bleumer and Cox2007).
An individual dynamic approach is only useful if there is sufficient variation between individual responses and if the economic prospects are encouraging. The current study demonstrates that individual variation in response exists and could be exploited to improve economic results during early lactation. However, these results have been derived as a first indication of the potential of a dynamic approach and are not intended for extrapolation over the whole lactation. Parameter estimates and economic results concern only the situation after 3 weeks in lactation. Further long-term research is essential to evaluate all the aspects and prospects of a fully individual dynamic approach to concentrate feeding of dairy cows during the whole lactation. In future research, on-farm characteristics, such as milk quota, stocking rate, use of land, roughage acquisition and sale will also be taken into account.
IOS are aimed at maximizing gross margins, but this is only valid if there are no limiting conditions such as milk quota. In the situation where milk quotas limit farm production levels, the strategy should be to minimize feeding costs. However, in the current study, the focus is on data from early lactation and it is not advisable to reduce milk production by limiting energy supply during this period.
Total feeding costs do not consist only of concentrate costs. A more complete approach should also consider substitution of roughage. However, measurement of roughage intake including determination of the substitution rate is not yet common practice, neither at individual level nor at herd level. Ignoring roughage costs will cause a small error in the optimal setting for concentrate supply, if the actual market price of roughage is low and/or the substitution rate is low. In situations where roughage intake is measured individually or at herd level, it is possible to evaluate the substitution of roughage by concentrate intake. Variation between individuals in milk composition, including effects of feeding, is ignored in the current study, but this variation affects the milk price. The model can be extended with an individual milk price to account for differences in milk composition.
Daily milk yield also depends on the length of the milking interval (Ouweltjes Reference Ouweltjes1998). In the current study, during the first week of the lactation, the settings for milking frequency were constant within the cows and by consequence there is not enough variation in interval length to estimate the individual response. Individual variation in response to interval length is studied by André et al. (in press) to show that revenues from automatic milking can be increased by using this variation.
A considerable part of the individual variation in daily milk yield increase during early lactation is related to differences between cows in their response to increasing concentrate intake. It is possible, in practice, to estimate individual response in milk yield to concentrate intake after a few weeks in lactation using real-time process data. This period should last at least 3 weeks to provide proper estimates of the response parameters.
IOS for concentrate supply can be derived using individual response parameters. After 3 weeks in lactation, the averaged potential gain of IOS ranges from €0·20 to €2·03/cow/day.
Individual response parameter estimates can be used to construct cow-specific prior information for response to concentrate intake, for further use in an individual dynamic approach later on in lactation. The model and strategy can be extended to account for other sources of individual variation, such as roughage intake and substitution, milk composition and price, milking interval, etc. Positive effects on health and reproduction are also anticipated.
The authors wish to thank Edwin Bleumer for gathering the data. This project was funded by the Dutch Commodity Board for Dairy Products and the Dutch Ministry of Agriculture, Nature and Food Quality.
APPENDIX 1
REDUCTION OF THE TWO-DIMENSIONAL RESPONSE SURFACE TO A QUADRATIC POLYNOMIAL
If M(t,C)={α0+α1t−α2t 2}+{β1C−β2C 2}+γCt and C=c 0+c 1t then substituting the associating days t=(C−c 0)/c 1 into M(t,C) gives
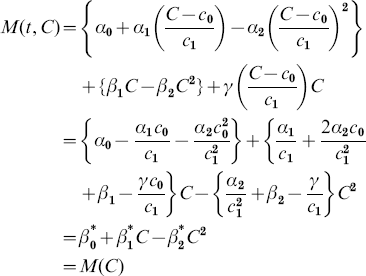
This quadratic function can be used to predict M(C Opt), where the gross margin milk revenues minus concentrate costs is maximal. The associating day in lactation is t=(C Opt−c 0)/c 1.
Milk yield Mt at day t depends on concentrate intake xt at current and previous days t, t−1, …. To account for the delay in response, the following transfer function is used:

We assumed that weights from day (t−3) and before are nearly 0. The remaining weights λ0, λ1 and λ2 were chosen equal (to 1/3). Unless the real, but unknown, weights would markedly differ, the choice of weights is not critical. These results in a moving average for concentrate intake.
APPENDIX 2
COMPARISON BETWEEN TWO INPUT STRATEGIES
The yield S for an input C is assumed to be

where

for a random animal from the herd.
Constant input based on average yield
The expected yield, which is the population average, for a fixed input C is

Here, we assume that μ2<0. Consequently, the expected yield is optimal for
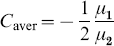
which yields S(C aver) with expected value
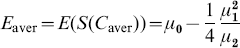
Input based on individual yield
For a random individual from the herd, when γ2<0, an optimal input can be calculated
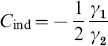
The associated individual optimal yield is
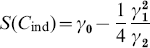
and the expected individual yield is

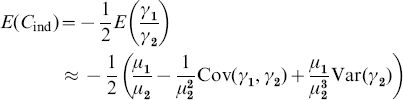
The latter expectation E ind can be approximated by Taylor expansion around the mean, up to and including terms of order 2 (Mood et al. Reference Mood, Graybill and Boes1974):
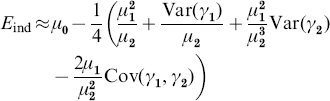
Here, we assume that the distribution of γ2 largely concentrates on negative values. When λ2⩾0, or when C ind is unrealistically high, we might imagine that some standard input value C Max is applied. The value C Max is a sensible upper bound for the input (possibly depending on the individual in a dynamic setting). When C Max>C aver, this would give a higher yield than the strategy based on a constant input.
When variation in γ2 is negligible, the covariance term will be equal to 0 and the result will be exact. The average input for the individual strategy is
The difference between the two input strategies
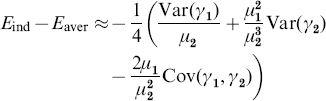
When variation in γ2 is negligible, the result will be exact. While μ2<0 and when Cov(γ1,γ2)<0 but relatively small, the expected yield will be larger under the individual input strategy compared with the constant input strategy.
APPENDIX 3
BOOTSTRAP
Although an analytical solution can be derived, a parametric bootstrap was carried out to investigate the consequences of the different strategies for concentrate allocation. The bootstrap was based on the estimated fixed response parameters  and
 according to primiparous or multiparous cows/farm. The random parameters b (n=10 000) were sampled from a multivariate normal distribution
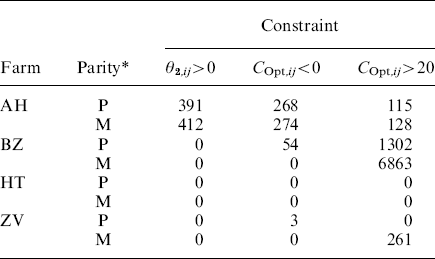
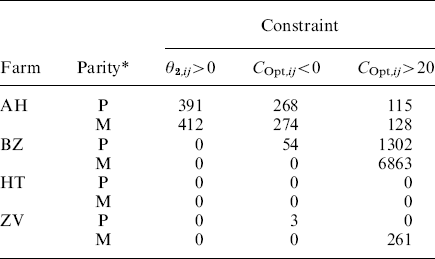
 . The bootstrap comprises the practical constraints θ2,ij<0 and 0⩽COpt,ij⩽20, which is more complicated to include in an analytical derivation. In next table, the number of cases out of 10 000 is given such that the bootstrap is bound by the constraints.
* P=primiparous; M=multiparous.