Introduction
Mesoporous silica (MPS) particles have been widely used in biomedical applications, essentially in biosignal probing, diagnostic imaging, bone repair, and drug delivery [Reference Cheng, Lee, Chen, Souris, Tseng, Yang, Mou, Chen and Lo1, Reference Slowing, Trewyn and Lin2, Reference Shi, Wang, Ren, Zhao, Gong and Wang3, Reference Kim, Kim, Lee, Kim, Kim, Yu, Song, Moon and Hyeon4]. Monodisperse porous silica particles were synthesized using sol–gel method first by Stöber et al. in 1968 [Reference Stöber, Fink and Bohn5]. Later in 1990, the surfactant-templated synthesis of MPS with hundreds of atomic-to-micro scale arranged pores accelerated the MPS research in the biomedical field [Reference Yanagisawa, Shimizu, Kuroda and Kato6]. Controlled delivery of therapeutic molecules by MPS was first reported for ibuprofen—an anti-inflammatory drug—in 2001 [Reference Vallet-Regí, Colilla, Izquierdo-Barba and Manzano7]. Since then, it has been widely investigated to deliver numerous drugs and molecules.
In the last decade, molecular delivery applications of MPS shifted sharply to genes, carrying short oligonucleotide duplexes (DNA and RNA) to patient cells without degradation. In oligo-delivery applications, electrostatically attaching oligonucleotides inside the surface pores of MPS rather than bonding them chemically onto the surface of a material provided several advantages [Reference Zhang and Cai8]. The researchers first synthesized MPS with well-ordered pores (usually <6 nm) and controllable particle size, cationically modified them, then attached oligonucleotides electrostatically to the silanols (Si(OH)n) inside the surface pores (adsorption) [Reference Shin, Hwang and Huh9, Reference Jafari, Derakhshankhah, Alaei, Fattahi, Varnamkhasti and Saboury10]. However, despite its remarkable advantages, clinical use of oligo-loaded MPS posed several challenges. Oligo-loading capacity of the particles was low due to narrow depth of the preprepared aligned pores produced by template-based methods. The shallow pores allowed adsorbed oligonucleotides to contact directly with blood, leading to not only easy oligo-degradation by proteins but also their partial release before reaching the target cells [Reference Xia, Kovochich, Liong, Meng, Kabehie, George, Zink and Nel11, Reference Torney, Trewyn, Lin and Wang12]. Sufficiently large pores could shield oligonucleotides more effectively against protein/enzyme degradation and prerelease in the bloodstream. It was shown that the surface pores on particles ranging from 50 to 300 nm in size must be at least 15--20 nm to overcome glomerular filtration and other body responses [Reference Baeza, Colilla and Vallet-Regí13, Reference Anderson, Muramatsu, Jha, Silverman, Weissman and Kariko14, Reference Li, Hu, Zhang, Ma, Yu, Zhao, Liu, Wang, Wang, Guan, Pan, Gao, Zhang, Liu, Yang, Tang, Li, Liu, Li and Mei15, Reference Na, Kim, Park, Ryoo, Lee, Jeon, Ryoo, Hyeon and Min16]. It was difficult to obtain particles of this size without agglomeration. To overcome this challenge, polyethylene glycol [PEG; (H–(O–CH2–CH2)n–OH)] grafting was suggested in literature. To date, PEG-grafted MPS have been widely used to decrease agglomeration and protein/enzyme degradation tendency of oligo-loaded vectors and pass them through the cellular membrane [Reference He, Zhang, Shi, Zhu, Zhang, Bu, Guo and Chen17, Reference Shehata Draz, Amanda Fang, Zhang, Hu, Gu, Weng, Gray and Frank Chen18]. Moreover, PEG-grafted particles even with sizes >500 nm were reported to have prolonged blood circulation [Reference Li, Hu, Zhang, Ma, Yu, Zhao, Liu, Wang, Wang, Guan, Pan, Gao, Zhang, Liu, Yang, Tang, Li, Liu, Li and Mei15].
But surface attachment route of oligonucleotides together with PEG chains and other moieties (targeting, drugs, etc.) had still limited the use of MPS vectors. Available surface groups were mostly occupied by the oligonucleotides, PEG, and other polymers for further functionalization [Reference Wang, Li, Ma and Gu19]. Overall, synthesis of cell-penetrating MPS particles that can shield oligonucleotides inside large pores while keeping particles small and with surfaces available for bonding has remained a challenge until now [Reference Na, Kim, Park, Ryoo, Lee, Jeon, Ryoo, Hyeon and Min16]. Recently, it was shown that hydrous sol–gel method is a superior method for one-pot processing of oligo- and mononucleotide–encapsulated MPS as it allows for particle formation and oligo-encapsulation simultaneously [Reference Kapusuz and Durucan20, Reference Kapusuz and Durucan21]. Sol–gel method is a room temperature method, which allows for the synthesis of silica monoliths, particles, or coatings practically [Reference Brinker and Scherer22]. By this strategy, other fragile biomolecules could also be encapsulated inside the amorphous network during synthesis, not only on the surface of preprepared MPS [Reference Bhatia, Brinker, Gupta and Singh23, Reference Pierre24, Reference Reátegui, Kasinkas, Kniesz, Lefebvre and Aksan25]. DNA oligo-/mononucleotides could be encapsulated inside sol–gel-derived MPS without denaturation. It was demonstrated that molecularly adsorbed water acts as a shield in the pores around the sol–gel encapsulated oligo- and mononucleotides (2′-deoxyadenosine 5′-monophosphate) [Reference Kapusuz and Durucan20, Reference Kapusuz and Durucan21, Reference Kwon, Vadillo-Rodriguez, Logan and Kubicki26]. Neither the helix conformation nor the base pairing had no role in this interaction. Base pairs were isolated inside the helix and therefore sugar-phosphate groups making up the helix were first to potentially interact with the silanols, unless the helix was disrupted [Reference Fujiwara, Yamamoto, Okamoto, Shiokawa and Nomura27].
In this regard, the motivation of this study was to form a hybrid silica/PEG network and encapsulate oligonucleotides inside this network. One-step, one-pot sol–gel synthesis of a biocompatible DNA-encapsulated silica/PEG network was performed. The material structure was investigated and protein degradation behavior of DNA-encapsulated silica/PEG particles was tested. It can be foreseen based on these results that sol–gel-derived silica/PEG hybrid materials have potential to create an alternative to aid the issues related to loading capacity, efficient shielding, targeting, and co-delivery of various molecules in MPS.
Results and discussion
Structural analysis of xerogels
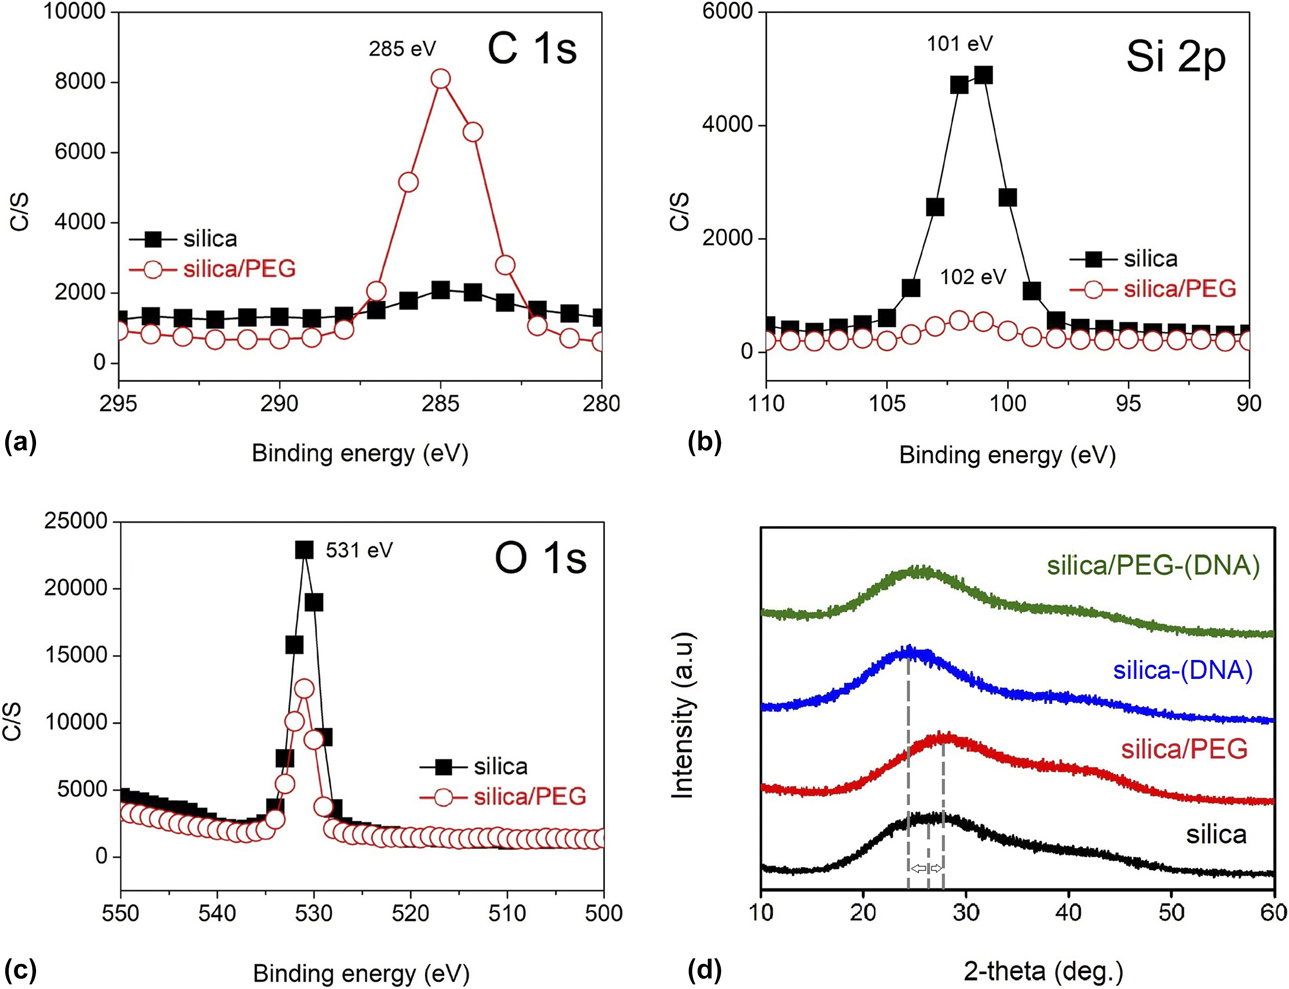
To characterize the structure of PEG-incorporated xerogels, X-ray photoelectron spectroscopy (XPS) and X-ray diffraction (XRD) analyses were performed. As XPS is an efficient tool to detect surface composition of a material, if PEG is bound to silica surface, it would be revealed by performing XPS analysis. In Fig. 1(a), high-resolution (280–295 eV) XPS spectra of silica and silica/PEG are shown. As expected, main C 1s peak was centered at 285 eV [Reference Sharma, Johnson and Desai28]. The intensity of the peak was very low in silica. As sol–to–gel transformation occurs, C2H5 groups in tetraethyl orthosilicate (TEOS) are first replaced by hydroxyls (OH−) during hydrolysis, then by oxygen as condensation proceeds [Reference Brinker and Scherer22]. Therefore, there was no strong C 1s signal in silica. In silica/PEG, however, the intensity of the C–C peak located at 285 eV was remarkable. Because XPS gives information from 5 to 10 nm depth of surfaces, this result shows that PEG chains were bonded to the surface of silica/PEG xerogel particles. Si 2p peak of silica at 101 eV [Reference Gross, Ramm, Sonntag, Unger, Weijers and Adem29, Reference Stephenson and Binkowski30] [Fig. 1(b)] shifted for 1 eV in silica/PEG with decreased intensity. Similarly, O 1s peak (at 531 eV) did not shift, but its intensity decreased by PEG incorporation. These changes in Si 2p and O 1s peaks, as well as C 1s signal, pointed out PEG coverage on the surface.
XPS high-resolution spectra of DNA-free xerogels: (a) C 1s, (b) Si 2p, and (c) O 1s. (d) XRD patterns of DNA-free and DNA-encapsulated xerogels.

In Fig. 1(b), the XRD patterns of DNA-free and DNA-encapsulated xerogels are shown. It was evident that all of them were noncrystalline. Neither PEG nor oligonucleotide incorporation did change the amorphous nature of the sol–gel-derived silica network. Each pattern demonstrated the well-known amorphous hump centered at 26–32° with slight shifting. The shifting was most remarkable when PEG was incorporated to DNA-free silica. Shifting of the maxima after PEG/DNA incorporation was possibly due to distortion in the ≡Si–O–Si≡ bonding.
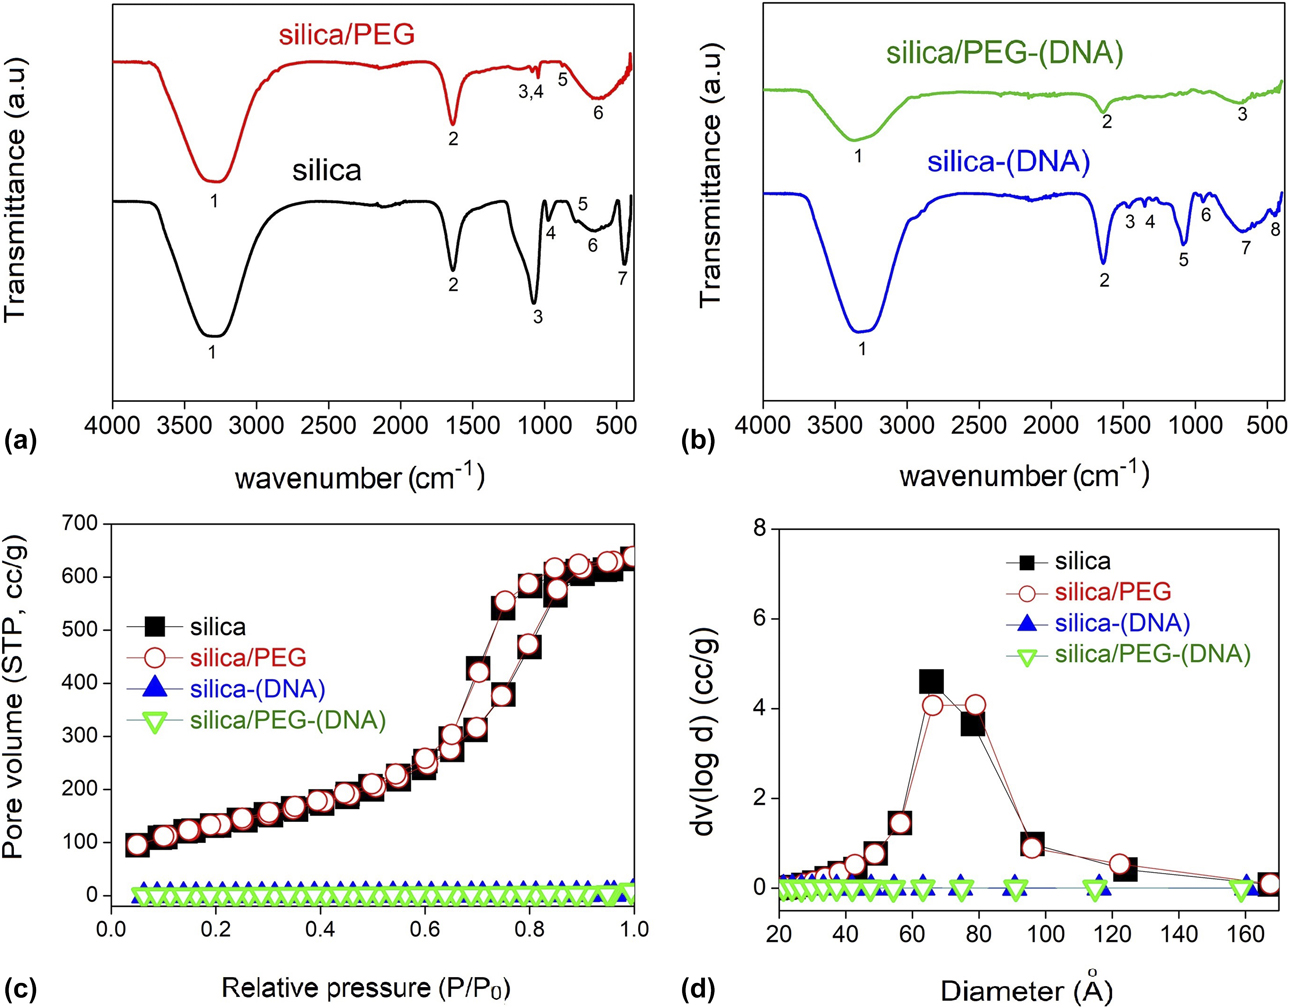
It was clear that PEG chains covered the DNA-free xerogel surface and was not separated as a new crystalline phase. But, further analysis was required to analyze whether PEG chains were hybridized with silica species inside the particles or just on the surface. Upon this aim, a higher depth analysis—Fourier transform infrared (FTIR) spectroscopy—was performed on xerogel particles (shown in Fig. 2) and referenced to those of TEOS, PEG, and EtOH (Fig. SI and Table SI). Based on the reference data in Table SI, assignments to IR absorbance bands of xerogels are tabulated in Table I.
FTIR spectra of (a) silica and silica/PEG and (b) DNA-encapsulated silica [silica-(DNA)] and silica/PEG [silica/PEG-(DNA)] xerogels, and BET analysis results of xerogels based on BJH model approximations: (c) isotherms and (d) pore size distribution.

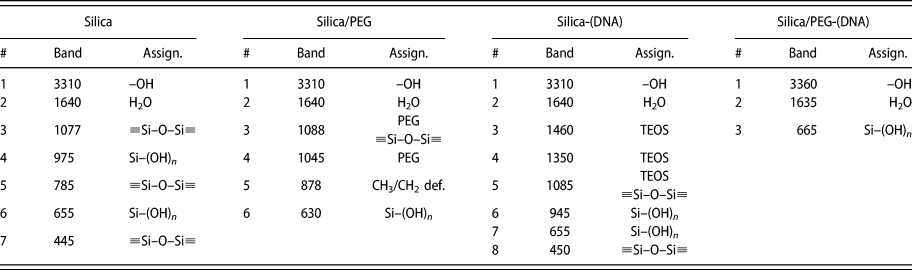
FTIR absorbance band assignments of xerogels.

As shown in Fig. 2 and Table I, the bands centered at 3310 and 1640 cm−1 were commonly observed in each xerogel. The broad band centered at 3310 cm−1 is the stretching vibration of OH− in H-bonded water, alcohol, and/or silanols [Fig. SI(c)]. It is usually cross-checked with the latter corresponding to bending vibration of water, and they are commonly observed in FTIR spectra of sol–gel-derived silica xerogels [Reference Beganskienė, Beganskienė, Sirutkaitis, Kurtinaitienė, Juškėnas and Kareiva31]. They were also observed in the spectra of unreacted PEG and EtOH. In unreacted PEG, OH− band was observed at larger wavenumbers (Table SI; 3450 cm−1). In DNA-free silica/PEG, the band was observed at identical position; however, it shifted to 3360 cm−1 with DNA encapsulation.
The bands observed at 1077, 975, 785, 655, and 445 cm−1 could be ascribed to silica species. In literature, condensation efficiency (≡Si–O–Si≡ bonding) of silica could be determined by three characteristic IR absorbance bands: (i) asymmetric stretching vibration of ≡Si–O–Si≡ at 1075 cm−1, (ii) asymmetric bending of –Si–(OH)n at 975 cm−1, and (iii) symmetric bending of ≡Si–O–Si≡ at 440–460 cm−1 [Reference Matos, Ilharco and Almeida32, Reference Nariyal and Kothari33, Reference Rubio, Rubio and Oteo34]. FTIR analysis showed that silica condensed with silanols, probably on the surface. With PEG incorporation, the bands at 1075, 975, and 445 cm−1 were disappeared and very small, and new bands at 1045 and 1088 cm−1 were formed. The band at 1045 cm−1 could be ascribed to C–H stretching in EtOH, PEG, or TEOS. Since xerogels were completely dried by prolonged aging and grinded manually, EtOH must have been evaporated. Moreover, the most intense bands of TEOS were not observed in the spectrum (Table SI); no unreacted TEOS was present. Therefore, the absorbance at 1045 cm−1 was most probably due to the presence of PEG chains in the network. The band at 1088 cm−1 could be ascribed to presence of either a distorted Si–O–Si≡ bonding or PEG. Then, band centered at 655 cm−1 was observed due to symmetric stretching vibration of silanols and observed in silica/PEG xerogel with shifting to 630 cm−1.
In the DNA-encapsulated silica, similar to PEG incorporation, ≡Si–O–Si≡ condensation was not complete. IR absorbance bands related to C–H bending, which were probably from unreacted TEOS (Si–OC2H5), were observed at low intensity. In DNA-encapsulated silica/PEG, however, these bands were not observed. DNA encapsulation probably attracted molecularly adsorbed water and caused an incomplete condensation [Reference Kapusuz and Durucan21].
The bending vibration (related to bond angle, at 975 cm−1) of silanols disappeared in silica and shifted remarkably in DNA-encapsulated silica; however, stretching bands (related to bond length, at 655 cm−1) were still observable in DNA-free or DNA-encapsulated silica/PEG. Therefore, it can be speculated by the distortion in bonding angle that PEG chains did not affect the hydrolysis but worked as stopping agents for ≡Si–O–Si≡ condensation and also distorted Si–OH/PEG network. The decrease in ≡Si–O–Si≡ condensation was an expected result since previous researchers observed a similar behavior. Akbari et al. [Reference Akbari, Yegani and Pourabbas35] synthesized silica/PEG gels by a similar sol–gel route. At relatively higher PEG concentrations (PEG/TEOS: 1, 4, and 9) and slightly higher processing temperature, they found that PEG chains, by their end OH− groups, prevent condensation of ≡Si–O–Si≡ and thereby particle growth.
Together with XPS, FTIR results imply bonding of PEG chains with the ≡Si–O–Si≡ network, both in the interior and on the surface. The presence of C–C XPS signals but not C–O on the surface, together with FTIR results, indicated a possible reaction between the C–O groups of the PEG chains and the condensing network. The disappearance of TEOS bands in the 2980–2930 and 1485–1170 cm−1 ranges was because of complete hydrolysis of TEOS into silanols during PEG incorporation [Reference Rubio, Rubio and Oteo34]. At HCl-catalyzed conditions, together with water/TEOS ratio higher than 4, TEOS hydrolyzes completely in minutes [Reference Rubio, Rubio and Oteo34, Reference Chu and Clark36]. In the absence of DNA bands in FTIR spectra, it could strongly be speculated that oligonucleotide concentration was so small that no absorbance bands could be observed in the spectra.
Mechanism of DNA-free and DNA-encapsulated silica/PEG network formation
In a typical sol–gel reaction for silica, silicon alkoxide (i.e., TEOS) forms the silica ≡Si–O–Si≡ network when in contact with water and an acid and/or base catalyst. In particular, TEOS (R: C2H5) reacts with water molecules through a hydrolysis reaction forming silanols according to reaction (1).
 $$\equiv {\rm{Si}}–{\rm{OR}} + {{\rm{H}}_{\rm{2}}}{\rm{O}} \to \; \equiv {\rm{Si}}–{\rm{OH}} + R–{\rm{OH}}\quad$$
The extent of the hydrolysis reaction depends mainly on the water/TEOS ratio and pH [Reference Brinker and Scherer22]. At equivalent concentrations of catalysts, if R ratio is higher than 4, TEOS is expected to hydrolyze completely into Si(OH)4 under acidic conditions. Once these silanols are formed, the condensation reaction can take place either with remaining Si–OR or with other silanols according to reactions (2) and (3).
 $$\eqalign{\equiv {\rm{Si}}–{\rm{OH}} + \; \equiv {\rm{Si}}–{\rm{OH}}\; \to \; \equiv {\rm{Si}}–{\rm{O}}–\; \equiv {\rm{Si}} + {{\rm{H}}_2}{\rm{O}}\quad$$
 $$\eqalign{\equiv {\rm{Si}}–{\rm{OH}} + \; \equiv {\rm{Si}}–{\rm{OR}}\; \to \; \equiv {\rm{Si}}–{\rm{O}}–{\rm{Si}} \equiv \; + R–{\rm{OH}}\quad$$
In this work, TEOS was first dissolved in EtOH, then mixed with PEG. PEG, if added directly to the TEOS before hydrolysis, could interact with TEOS and/or water. If it reacts with water through H-bonding, it may decrease the amount of water below which was required for complete hydrolysis of TEOS. If it reacts with ≡Si–OR in TEOS, transesterification occurs (4) [Reference Lesot, Chapuis, Bayle, Rault, Lafontaine, Campero and Judeinstein37].
 $$\!\scale89.9%\eqalign{\equiv {\rm{Si}}–{\rm{OR}} + {\rm{H}}–{\left( {{\rm{O}}–{\rm{C}}{{\rm{H}}_2}–{\rm{C}}{{\rm{H}}_2}} \right)_n}–{\rm{OH}}\; \to \; \equiv {\rm{Si}}–{\rm{O}}{\left( {{{\rm{C}}_{\rm{2}}}{{\rm{H}}_{\rm{4}}}{\rm{O}}} \right)_n}{\rm{H}} + R–{\rm{OH}}\quad$$
Thereby, the interaction of PEG with silanols might change the kinetics of sol-to-gel transformation, leading to variation in the structural development in the gel. If it is added to a mature sol, PEG would probably be coated only on the silica colloid surfaces [Reference Vong, Bazin and Sermon38]. Then, all absorbance bands related to PEG would probably be observed in the spectra. In this case, however, TEOS and PEG were first mixed in EtOH, leading to a competition between transesterification and H-bonding of silanols and PEG chains during sol-to-gel transformation. As water was added to the mixture of TEOS and PEG, TEOS started to hydrolyze and the silanols interacted with PEG and other hydrolysis species simultaneously. In literature, it was stated that hydrolysis species in silica could possibly interact with PEG: (i) through the ether oxygen in (C2H4O) group and (ii) through the OH tail (H–(O–CH2–CH2)n–OH) by transesterification.
For transesterification to occur according to the reaction (4) after hydrolysis, there must be ≡Si–OR left in the system, which is a product of incomplete hydrolysis. As the r ratio was 36—well above the limit—considering analysis results as a whole, there is a small possibility that ≡Si–OR groups were left in the sol and they led to transesterification between ≡Si–OR and PEG chains. If that was the case, absorbance bands related to C–H vibrations in TEOS and EtOH were observed at high intensity in FTIR spectra.
The interaction of PEG chains with silanols through the ether oxygen in (C2H4O)n group is a strong possibility since FTIR directly exhibited the disappearance of silanols (band at 975 cm−1, Fig. 2) as PEG was introduced. Supporting the FTIR results, no C–O bonding was observed in the XPS spectrum of silica/PEG, probably due to breaking of bonds between ether oxygen and carbon [Reference Sharma, Johnson and Desai28]. Therefore, PEG chains probably built H-bonds with silanols through –OH tail and also reacted with ether oxygen. The interaction through silanols was remarkable in the FTIR spectrum from the disappeared silanol bands and decreased intensity and shifting of the ≡Si–O–Si≡ band due to these distortions in the condensing network of DNA encapsulation
Analysis of DNA encapsulation
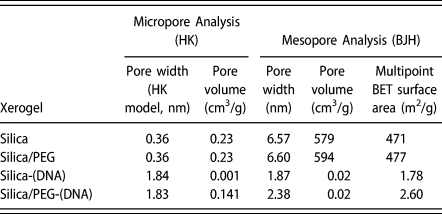
In Table II, the data show the micropore and mesopore analyses of xerogels obtained by BET (Brunauer–Emmett–Teller) method. Horváth–Kawazoe (HK) model indicated that silica and silica/PEG gels were not microporous (pores <2 nm), rather they were mesoporous. The micropore volume was almost zero (0.23 cm3/g). The calculated mesopore volume based on the BJH (Barrett–Joyner–Holenda) model increased from 579 to 594 cm3/g by 10% PEG incorporation. Also, the multipoint BET surface area, which is commonly used to determine the surface area of mesoporous materials, increased from 471 to 477 m2/g. Average pore size of 6.6 nm did not change remarkably with PEG incorporation. The gas adsorption results of DNA-encapsulated xerogels showed completely different behavior. Prior to gas adsorption analysis, both DNA-free and DNA-encapsulated xerogels were degassed at 40 °C for 16 h. Previously, DNA-encapsulated silica xerogels were degassed at 70 °C to empty the pores from by-products, oligonucleotides, etc. [Reference Kapusuz and Durucan20, Reference Kapusuz and Durucan21]. In this work, the reason for choosing a lower temperature (40 °C) was to differentiate DNA presence inside the pores. Since a considerable amount of double-stranded (duplex) DNA starts to melt approximately after 50 °C (depending on G–C base pair content), degassing was performed at this temperature to clean any dirt or volatiles but to keep DNA inside the pores.
Micropore and mesopore analyses of xerogels based on BET method (HK and BJH model approximations).
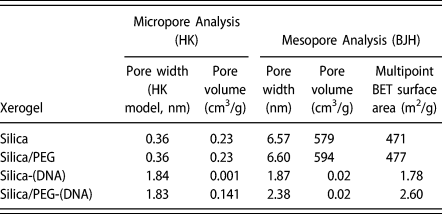
In Figs. 2(c) and 2(d), the gas adsorption hysteresis and pore size distribution of DNA-encapsulated silica and silica/PEG xerogels are compared with their DNA-free counterparts. Silica and silica/PEG xerogels expressed a similar gas adsorption behavior, which is indicated by type V isotherm associated with pore sizes in the 1.5–100 nm range. The difference between gas desorption and adsorption led to the formation of H1 type hysteresis according to the IUPAC classification [Reference Alothman39]. In both xerogels, identical hysteresis was observed, meaning that both of them possessed cylindrical-like mesopores (2–50 nm). The decrease in pore volume with encapsulation of DNA oligonucleotides was evident from the hysteresis loops [Fig. 2(c)] and pore size distribution [Fig. 2(d)]. The decrease in adsorbed pore volume and pore sizes of silica and silica/PEG xerogel with DNA encapsulation was remarkable. Since all sol–gel and gas adsorption processing conditions, such as water/TEOS ratio, catalyst type/amount, and pre-degassing duration/temperature, were identical in DNA-free and DNA-encapsulated xerogels, it can be stated that mesopores were filled with oligonucleotides.
Spectroscopic analysis of the condensing network
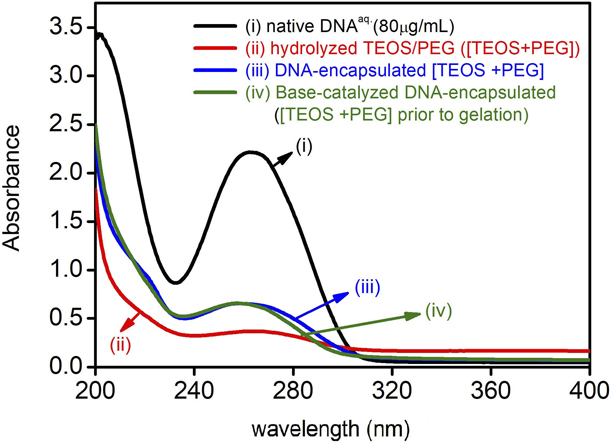
To investigate the optical behavior of DNA-encapsulated silica and silica/PEG gels on sol-to-gel transformation, samples were scanned by ultraviolet–visible (UV-Vis) spectrophotometer starting from sol to gel state. In Fig. 3, the results are compared with that of native DNA solution at 80 µg/mL concentration.
UV-Vis spectra of xerogels in sol and gelling (prior to gelation) states compared with that of native DNA solution (80 µg/mL). [TEOS + PEG]: TEOS and PEG dissolved in EtOH/acidified water mixture, where TEOS was expected to hydrolyze into silanols and condense into ≡Si–O–Si≡ simultaneously [Reference Brinker and Scherer22].
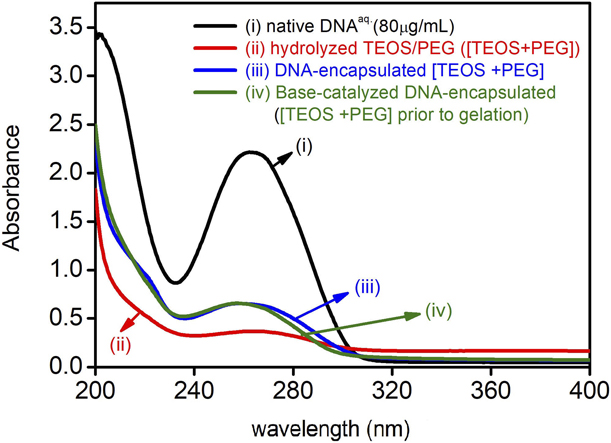
After adding water into TEOS–PEG mixture in EtOH, TEOS was expected to hydrolyze, and this reaction was accelerated by adding the acid catalyst (HClaq). The red curve in the graph represents the hydrolyzed state [TEOS + PEG]. When compared with the UV-Vis curve of native DNA (black), absorbance at 260 nm was neglectable (0.35). DNA solution showed an absorbance value of 2.20 at 80 µg/mL concentration. As DNAaq was added to [TEOS + PEG], the absorbance at 260 nm increased to 0.64 and did not increase further by the addition of the base catalyst and until gelation. As strong UV absorbance at 260 nm is characteristic for duplex DNA, the increase in absorbance at this wavelength lead to the presence of DNA in the network [Reference Saito, Silva, Pungartnik and Brendel40]. Because not every single oligonucleotide was reachable during ≡Si–O–Si≡/PEG condensation, high light scattering caused a much less absorbance than in native state. The UV-Vis spectroscopy analysis basically revealed the presence of DNA oligonucleotides inside the condensing ≡Si–O–Si≡ network, supporting gas adsorption analyses.
Protein adsorption of xerogels
The resistance of MPS to protein degradation constitutes a great importance for biomedical applications, essentially for gene delivery. Because small non-coding nucleic acid fragments (i.e., DNA, siRNA, miRNA, oligonucleotides) are degraded in ≈15 min when injected into the human body, they have to be shielded against protein contact [hemoglobin (HG), albumin, etc.] by the vector material [Reference Darvishi, Farahmand and Majidzadeh-A41]. Therefore, the vector material itself must repel the proteins and shield oligonucleotides against proteins in the bloodstream.
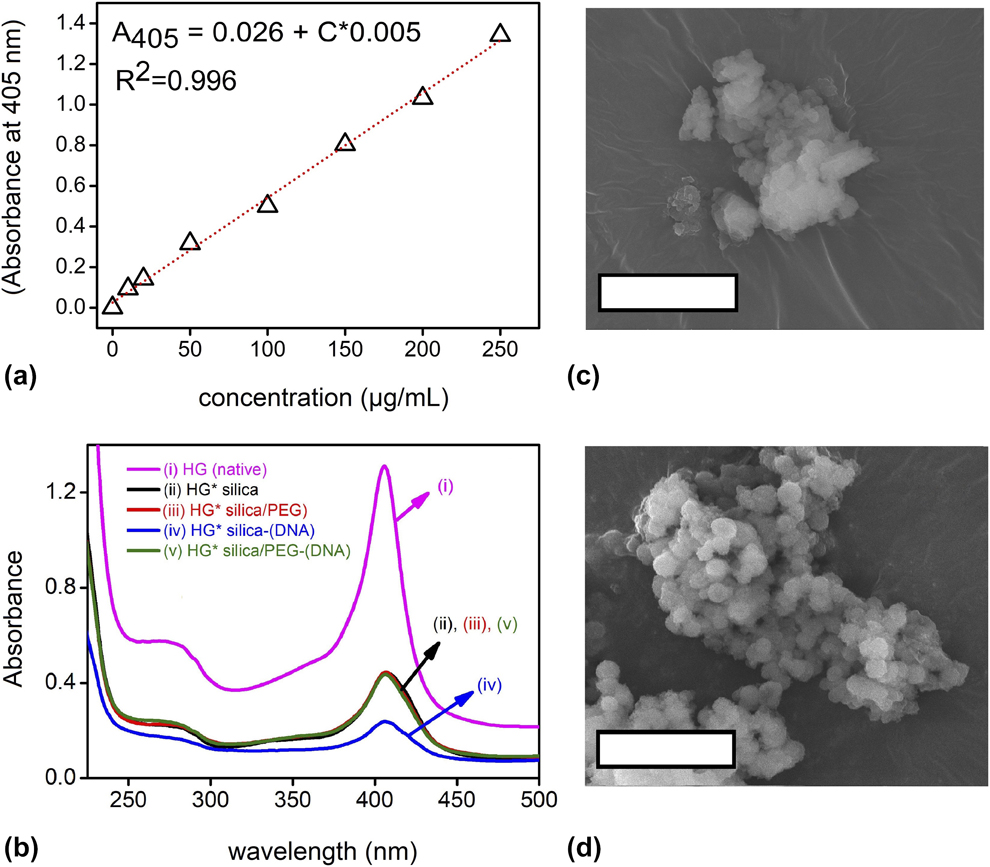
Previous studies showed that proteins are adsorbed on silica, and the adsorbed amount is a function of several parameters, including pH, pore size, and shape [Reference Meissner, Prause, Bharti and Findenegg42]. To test the HG adsorption on xerogels, HG concentration in water was calibrated by scanning various concentrations of HG (Fig. S2). The obtained calibration curve is shown in Fig. 4(a). It could be fit perfectly to the linear equation (adv. R 2: 0.996):
 $${A_{405}} = 0.026 + 0.005 \times C\quad ,$$
where A 405 is the UV absorbance of the HG solution at 405 nm and C is its concentration (µg/mL). The UV-Vis scans of HG solutions before (t = 0, native) and after exposing them to synthesized xerogels for 5 h (HG*) are compared in Fig. 4(b). A 405 of the HG solution used in the study (250 µg/mL) was 1.31. As HG proteins were adsorbed onto xerogels in 5 h, this value decreased. By putting the difference in A 405 into Eq. (5), adsorbed concentrations were calculated. Adsorbed HG concentrations of DNA-free silica and silica/PEG in 5 h were 169 ± 5 and 168 ± 8 µg/mL. With DNA encapsulation, adsorption increased to 208 ± 15 µg/mL for silica but did not increase for silica/PEG. DNA encapsulation increased the protein adsorption of silica but not silica/PEG. Considering that 50 mg of particles was dispersed in 5 mL of HG solution in each test, 16.8 µg HG/mg particle in silica and silica/PEG were adsorbed in 5 h. Adsorption increased to 20.8 µg HG/mg particle with DNA encapsulation in silica but not changed for silica/PEG.
(a) The concentration calibration curve of HG solution (the wavelength versus absorbance graphs for concentrations 0–250 µg/mL can be found in Fig. S2). (b) UV-Vis scans of xerogels compared with that of native HGaq solution (250 µg/mL). SEM images of DNA-encapsulated (c) silica and (d) silica/PEG xerogel particles. Note that scale bars are 5 µm.

Adsorption of proteins onto silica depends mainly on pH and pore size. Previous researchers indicated that silica is negatively charged at pH higher than its isoelectric point (pI) (pH 2) [Reference Lazaro, Vilanova, Barreto Torres, Resoort, Voets and Brouwers43]. Similarly, proteins possess negative charges above their isoelectric point. At pH above 6.8, the surface of HG is predominantly negatively charged. The pH of the HG solution was measured as 6.8 ± 0.2, where silica is negatively charged and HG slightly positive. Therefore, the level of adsorption is essentially determined by the pore size and electrostatic attraction. The size of a single HG molecule is 5 nm [Reference Erickson44], and the average pore size in silica was determined by BET method as 6.8 nm. Therefore HG, as most proteins, are electrostatically attracted to negatively charged silica [Reference Fuertes, Valle-Vigón and Sevilla45], and they were probably adsorbed into the surface pores. The pore structure was identical in silica/PEG xerogel, and a similar HG adsorption behavior was observed. Previous researchers stated that PEG chains could be adsorbed on HG [Reference Conover, Linberg, Shum and L Shorr46, Reference Svergun, Ekströ, Vandegriff, Malavalli, Baker, Nilsson and Winslow47]. It was reported that PEG conjugation led to repulsion between the PEGylated HG molecules caused by the PEG layer that surrounds the protein [Reference Svergun, Ekströ, Vandegriff, Malavalli, Baker, Nilsson and Winslow47]. However, in this case, PEG chains were bound to silica and the pores were empty and available for HG adsorption.
In DNA-encapsulated silica, oligonucleotides were also negatively charged due to their sugar-phosphate backbone [Reference Lipfert, Doniach, Das and Herschlag48]. The increased negativity and less surface area (compared to DNA-free counterpart) caused surface negativity—electrostatic attraction—to dominate and attract more HG proteins to oligonucleotides filling up the pores. The surface of HG molecules is hydrophilic owing to the presence of polar amino acids, whereas the heme groups are nonpolar, making the interior hydrophobic. Then, polar groups on the surface could make H bonds with water [49]. Therefore, the water shield around the encapsulated DNA oligonucleotides could attract more HG to the DNA-encapsulated regions. This caused a remarkable increase in HG adsorption per unit time. In DNA-encapsulated silica/PEG, however, this increase was not observed due to the PEG chains covering up the DNA-encapsulated pores. PEG, a nonionic molecule, could shield oligonucleotides against HG by forming a steric barrier [Reference Shehata Draz, Amanda Fang, Zhang, Hu, Gu, Weng, Gray and Frank Chen18, Reference He, Zhang, Gao, Li and Shi50]. Considering that PEG ratio in the hybrid gels is only 10%, optimizing PEG concentration in the precursors could then lead to remarkably increased protein retention.
The steric barrier formed by PEG on the surface could provide other advantages. In Figs. 4(c) and 4(d), scanning electron microscopy (SEM) images of DNA-encapsulated silica and silica/PEG particles are shown, respectively. As the images show, silica particles were composed of irregular aggregates, and PEG incorporation led to the formation of smaller spherical particles with well-defined edges. By SEM imaging, average particles size was calculated as 557 ± 110 nm for DNA-encapsulated silica/PEG. Due to high level of agglomeration, it was not reliable to measure the particle size of DNA-encapsulated silica particles. The agglomerated chunks, however, were in micro-scale (1–3 µm). The decreased particle size by PEG incorporation was probably because of PEG chains hindering network condensation by Ostwald ripening on the initially formed colloids and decreased agglomeration tendency owing to its steric hindrance.
Conclusion
For the first time in literature, DNA-encapsulated silica/PEG xerogel monoliths were synthesized by sol–gel and the hybrid structure was characterized in detail. The results revealed that it might be a more practical and advantageous strategy to load oligonucleotides in silica/PEG hybrids by encapsulating them inside the pores during sol–gel synthesis. Noting that PEG content must be optimized in future studies for smaller particle size and less protein adsorption, following conclusions can be drawn specifically from this study:
(1) Structural analyses (XPS, XRD, FTIR, and SEM) demonstrated that adding PEG into TEOS (1:10) solution before adding water for hydrolysis succeeded in forming a hybrid silica/PEG network by sol–gel technique. Xerogel monoliths were ground into particles manually, so that PEG chains were found both in the interior and on the surface of the ground particles. The average size of silica/PEG particles were 557 ± 110 nm, and they were spherical with well-defined edges. However, the ground silica xerogels were composed of irregular-shaped chunks. As both silica and PEG were reported as biocompatible for many researchers, particles <400 nm can be obtained by applying optimized grinding procedures and used for gene delivery in the future.
(2) DNA-encapsulated silica and silica/PEG particles were mesoporous, and oligonucleotides were trapped inside the pores as revealed by gas adsorption analysis.
(3) Oligonucleotides were trapped inside the whole network, not just on the surface. No surface modification was required for DNA loading. By applying this strategy, PEG chains could be reduced by stimulating agents for controlled delivery in future studies.
(4) Incorporating PEG led to increased retention against protein degradation owing to its steric hindrance capability.
This work clearly showed that sol–gel derived silica/PEG hybrids are worth investigating further for utilization in gene delivery. This is an open field for development of alternative vectors, which could effectively allow for controlling oligonuc-leotide loading and surface functionalization in RNA interference (RNAi) therapy.
Methodology
The reagents used to synthesize sol–gel silica and silica/PEG xerogels were TEOS [Si(OC2H5)4; Merck 800658, Darmstadt, Germany], PEG (400 g/mol; Alfa Aesar B211992, Karlsruhe, Germany), EtOH (Isolab 920026, Wertheim, Germany), HCl (37 wt%; Merck 100314, Darmstadt, Germany), NH4OH (28 wt%; Sigma-Aldrich 338818, Saint Louis, Missouri), and ultrapure water (Type I, Human Corp., Seoul, Korea). For oligo-encapsulation and protein adsorption experiments, salmon sperm DNA (double stranded, <5% protein impurity; Sigma-Aldrich, St. Louis, Missouri,) and bovine HG (Millipore 08449, Darmstadt, Germany) were received in powder form and used at 80 μg/mL and 250 μg/mL concentrations, by dissolving in ultrapure water, respectively.
DNA-encapsulated silica/PEG xerogel was prepared by sol–gel synthesis at ambient conditions (25 ± 2 °C, 1 atm). First, 2.5 g of TEOS and 1 g of PEG were dissolved in 2.5 mL of EtOH and then stirred for 10 min in separate beakers. PEG/EtOH solution was poured into TEOS/EtOH and stirred for 5 min. Five milliliters of ultra-pure water and 0.25 mL of HClaq (1 M) were added successively. The pH of TEOS/PEG/EtOH was measured as 5.99 ± 0.05. As water was added, the solution turned into a slightly turbid state, in which water molecules caused oil-in-water like appearance. pH did not change significantly with water addition, but it decreased to 3.5 ± 0.1 after HClaq addition. After 5 min of stirring the acid-catalyzed solution, the turbidity disappeared and a homogeneous transparent solution was obtained, indicating that hydrolysis reaction was taking place. Then, 3 mL of DNAaq solution (containing 240 μg of DNA) was added dropwise, and pH was measured as 3.8 ± 0.2 after 5 min of stirring. Then, 1 mL of NH4OHaq (1 M) was added to catalyze the condensation reaction. After stirring additionally for 5 min, pH was 7.5 ± 0.3 and the solution was slightly opaque. At last, the solution was transferred into a borosilicate glass petri dish, sealed with Parafilm® (Sigma-Aldrich P6543, Saint Louis, Missouri) and left for gelation and aging at ambient conditions. Gelation time, which was monitored by visual examination, was recorded as the total time passed until the sol transformed into a rigid state (gel), preserving its shape when tilted 45° angle.
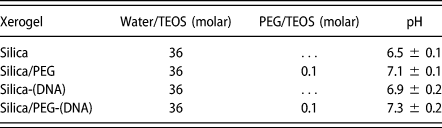
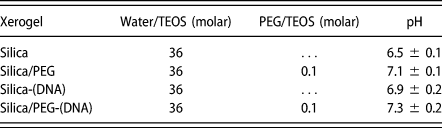
To investigate the effect of PEG incorporation on silica, DNA-free silica and silica/PEG xerogels were prepared. Additionally, to investigate the effect of oligo-encapsulation, DNA-encapsulated silica gel was prepared as control sample. To preserve an identical R ratio, 3 mL of ultrapure water was added to DNA-free silica and silica/PEG gels instead of DNAaq. The water/TEOS, PEG/TEOS ratio, and pH prior to gelation of each sample are displayed in Table III. All samples were gelled in 10 min. The syneresis stage, where the by-product alcohol and/or water expelled out from the gel network and collected on top of the gels, was occurred in 3 days, but all gels were aged at ambient conditions for a week to allow them dry completely.
Water/TEOS, PEG/TEOS ratios, pH (prior to gelation), and gelation time of sol–gel derived monoliths.
After aging, monolithic dry xerogels were gently ground into particles using alumina mortar and pestle. The structural development in xerogel particles was then characterized by XRD, SEM imaging, nitrogen gas adsorption, FTIR, XPS, and UV-Vis spectroscopy techniques. XRD analysis was performed using D/Max-2200 diffractometer (Tokyo, Japan) using Cu Kα radiation in Bragg–Brentano geometry. A constant scan rate of 2°/min was applied in 0.02° intervals. The morphology of grinded xerogel particles was observed by Nova Nano SEM 430 electron microscope (Oregon, USA). Prior to analyses, particles were dispersed in EtOH and sonicated for 15 min for aggregates to break apart and large particles to settle down. Then, a droplet of solution was placed on carbon tape for SEM imaging. Prior to imaging, the samples were coated with a thin layer of gold using Quorum SC7640 high-resolution sputter coater (East Sussex, U.K.). Average particle size was calculated by performing 10 measurements on different regions of the analyzed sample. The size and scale of porosity were investigated using nitrogen Quantachrome Autosorb-1-C/Ms gas adsorption analyzer (Boynton Beach, Florida). Prior to analysis, typically 0.1 ± 0.04 g of particles was degassed with high-purity nitrogen for 16 h at 40 °C. The pore morphology, average (micro/meso) pore size, and surface area were calculated according to the HK model for micropore (<2 nm) and the BJH model approximations for mesopore (2–50 nm) analysis by the system software.
In FTIR and XPS spectroscopy, particles were scanned in 4000–400 cm−1 and 2000–100 ppm ranges, respectively. FTIR analysis was performed with Perkin Elmer Frontier, PIKE 80Spec System (Madison, Wisconsin). XPS analysis was performed with a PerkinElmer PHI 5000 Versa Probe ESCA system (Ulvac-Phi, Inc., Japan). The instrument was equipped with a monochromatic Al Kα X-ray source operating at 14 kV and 200 W. The optical behavior of DNA-encapsulated xerogels from sol to gel state was investigated using Shimadzu 1800 UV-Vis spectrophotometer (Shiga, Japan) by scanning in 200–800 nm range. Starting with TEOS dissolved in EtOH, scanning was repeated after each reagent addition in each sol. During scans, ultrapure water was used as the reference (baseline). In each measurement, 3 mL of fresh sample was used. In a typical protein adsorption test, 50 mg of particles was dispersed in 5 mL of freshly prepared HGaq solution (250 μg/mL, 1 mg in total). The solution was continuously stirred for 5 h at room temperature. After 5 h, 3 mL solution was filtered using syringe filter (0.45 μm) and scanned by UV-Vis spectrophotometer in 200–800 nm range. The amount of adsorbed HG was calculated using the characteristic absorbance of HG at 405 nm. UV-Vis scans of varying HG concentrations (0–250 μg/mL) were used to create a standard curve with concentration plotted in x-axis and absorbance at 405 nm (A 405) in y-axis. This standard curve was then used to calculate the amount of adsorbed HG by the particles by subtracting the A 405 of remaining HG solution at time t = 5 h from that of native HG, at time t = 0. The tests were repeated for three times.
Supplementary material
To view supplementary material for this article, please visit https://doi.org/10.1557/jmr.2019.341.
Acknowledgment
The author acknowledges Gaziantep University for funding the research under the project No. RM. 16.01.