INTRODUCTION
Miombo woodland is a dry forest that is characterized by the dominance of trees in the genera Brachystegia and Julbernardia. This woodland type covers an estimated 2.7 million km2 in southern, central and eastern Africa (White Reference White1983; Frost Reference Frost and Campbell1996). It is important for the production of valuable hardwood timber and supports the economic livelihood of millions of people (Frost Reference Frost and Campbell1996). In Zambia (southern Africa), miombo woodland covers 53% of the country (Chidumayo Reference Chidumayo1997) and is economically important for the supply of timber, poles, firewood and charcoal (Fanshawe Reference Fanshawe1971; Chidumayo Reference Chidumayo1997). Miombo has been maintained by man through a long history of cutting, cultivation and frequent dry season fires over the last 55 000 years (Lawton Reference Lawton1978). The 20th century witnessed the intensification of these land-use activities as a result of increasing human and livestock populations. Because dry tropical forests cover 40% of the tropical forest area and contain considerable carbon stocks (Grainger Reference Grainger1999), deforestation and degradation of dry tropical forests has global significance.
The carbon stored in the aboveground living biomass of trees is the largest pool and most directly impacted by deforestation and forest degradation (Gibbs et al. Reference Gibbs, Brown, Niles and Foley2007). However, soil carbon still represents an important carbon sink. Most soil carbon is derived from roots rather than shoots and leaf litter (Kell Reference Kell2012). Plant root systems are a major carbon sink and influence processes such as soil erosion and carbon cycling (Richardson & Dohna Reference Richardson and Dohna2003), yet knowledge of biomass allocation to roots lags behind that of the aboveground biomass (Cairns et al. Reference Cairns, Brown, Helmer and Baumgardner1997; IPCC [Intergovernmental Panel on Climate Change] 2006) because few studies have quantified total tree biomass, including belowground biomass. The IPCC guidelines for land-use change and forestry ignore the fate of belowground biomass (roots) after forest clearing, but encourage experimental calculations of this biomass by experts (IPCC 2006). In temperate forests, root biomass decreases rapidly after clear-felling, and this is associated with root strength deterioration (Burroughs & Thomas Reference Burroughs and Thomas1977; Ziemer & Swanston Reference Ziemer and Swanston1977). In tropical forests, live fine root biomass is reported to return to pre-disturbance levels after 10 years (Teh et al. Reference Teh, Silver and Scatena2009). However, fine roots account for only 18% of total root biomass (S. Persch, K. Hergoua, Y. Laumonier & L. Verchot, unpublished data 2011).
Root systems of trees are notoriously difficult to measure because of the need to excavate large volumes of soil. Although there are new methods of studying tree root systems, such as ground-penetrating radar techniques (Hruska et al. Reference Hruska, Cermák and Sustek1999; Nadezhdina & Cermak Reference Nadezhdina and Cermak2003), their adoption has been limited. The more common approach has been to generate field data from excavation of coarse tree roots, using the data to parameterize models that describe the relationship between stem diameter and root biomass (Richardson & Dohna Reference Richardson and Dohna2003; Ryan et al. Reference Ryan, Williams and Grace2011). The disadvantage of excavation methods is that they are not only laborious and time consuming, but also very destructive.
The present study contributes to knowledge of belowground biomass in forest types in Africa by destructive sampling to (1) parameterize two commonly-used allometric models of tree aboveground and belowground biomass using stem diameter, (2) develop a model to predict coarse lateral root biomass using lateral root proximal diameter and (3) establish a relationship between stand basal area and lateral root biomass using data obtained from pit samples. The study assesses changes that occur in coarse tree root biomass following clear-cutting old-growth woodland, and the implication of these changes on dynamics of root carbon stocks. This is one of very few studies to address these questions in sub-Saharan Africa. The study was conducted in a miombo woodland landscape in central Zambia, consisting of regrowth woodland of known ages and old-growth woodland, with measurements from 1990 to 2012. Nomenclature of woody plants follows White (Reference White1962).
METHODS
Study area
The study area is located between latitudes 15.217° and 15.283°S and longitudes 29.150° and 29.233°E in Chongwe district (central Zambia), about 110 km east of Lusaka city. The terrain in the area is diverse, with hills and gentle sloping interfluves interspaced by headwater grasslands called dambos. The area is underlain by basement rocks that are granitized and deformed by quartzites, gneisses and schists (Simpson Reference Simpson1967). The interfluves have schist, gneiss and quartzite horizons, and soils tend to be more sandy over quartzites and less so over gneisses and schists. The soils in the study area have been mapped by the Soil Survey Unit of the Zambian Department of Agriculture as a mixture of Alfisols and Ultisols and, according to Bell (Reference Bell, Huntley and Walker1982), soils derived from basement rocks have low soil nutrient status.
The nearest weather station is 85 km away at David Kaunda International Airport (15.310°S, 28.438°E, altitude 1226 m above sea level), where the mean annual rainfall for the period 1967–2009 was 894.7 ± 44.01 mm and mean annual daily minimum, maximum and average temperatures are 13.71 ± 0.074 °C, 27.45 ± 0.129 °C and 20.58 ± 0.095 °C, respectively. However, gridded climatology data (Climatic Research Unit, University of East Anglia, UK, available at www.cru.uea.ac.uk/cru/data) for the study area for the period 1961–1990 gave a mean annual rainfall of 822.9 mm with an average temperature of 21.06 °C. Ninety-four per cent of annual rainfall occurs during the rainy season, November–March.
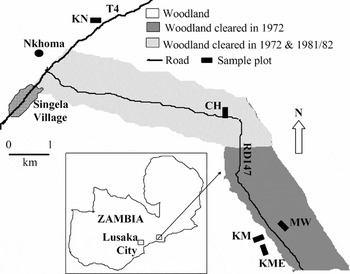
The study area is covered with Brachystegia-Julbernardia-Isoberlinia miombo woodland with Brachystegia boehmii, Julbernardia globiflora, Isoberlinia angolensis and Uapaca species as dominants on interfluves, while Brachystegia manga is a co-dominant on hills. During 1971 and 1972, the government cleared the woodland along the RD147 road to create a c. 1500 m wide swathe for tsetse-fly control; the northern portion of the swathe was cleared again during 1981/1982 (Fig. 1) (Chidumayo Reference Chidumayo1988). Consequently, the area contains tracts of both old-growth and regrowth woodland of known ages. Woodland clearing involved cutting trees at about knee-height (≈30 cm above ground).
Map of location of study area in Zambia (insert) and woodland sample sites: Chabesha (CH), Kamatupa (KM), Kamatupa Extension (KME), Kankumba (KN) and Nkhoma. The two roads are Great East (T4) and Chakwenga (RD147).

During the dry seasons of 1990 and 1991, sample plots were established at five sites (Fig. 1): Kankumba (KN, 15.227°S and 29.177°E), Chabesha (CH, 15.252°S and 29.220°E), Mwambashi (MW, 15.282°S and 29.232°E), Kamatupa (KM, 15.284°S and 29.230°E) and Kamatupa Extension (KME, 15.284°S and 29.231°E). The plots at KN, KM and KME are in old-growth woodland on the edge of the tsetse-fly control swathe while the plots at MW and CH are in regrowth woodland (Fig. 1). Topographically, plots KM, KME and MW are on the interfluve, while KN and CH are on hillsides. At time of establishment in 1990, the regrowth at CH and MW was eight and 18 years old, respectively. Each sample plot was 20 × 100 m, with eight 20 × 10 m subplots and eight 2 × 20 m boundaries between subplots, and one boundary at both ends of each plot. The plot perimeter was marked by pits (1m × 1m × 0.5 m) and/or stones painted by permanent white paint. During plot establishment, all trees (≥3.2 cm diameter at 1.3 m height) were tagged and identified to species level in each subplot. Diameter at breast height (dbh) of each tree was measured and recorded and the point at which dbh was measured was marked with permanent paint for subsequent remeasurements. The dbh of stems originating below 0.3 m aboveground were measured and recorded separately under each such multi-stemmed tree.
Aboveground biomass on harvested subplots
In 1991, aboveground wood biomass was measured on 24 20 × 10 subplots: three within each plot at the five study sites (Fig. 1) and an additional subplot in the vicinity of each plot, except at KN where five additional subplots were sampled. The number of stems harvested per subplot ranged from 24 to 86 (dbh, 2–18 cm) on regrowth sites and 11 to 24 (dbh, 2–37 cm) on old-growth sites. Each stem on each harvested subplot was identified, and dbh measured and recorded before harvesting. All stems on the harvested subplots were cut close to the ground and all the main stem axes and branches (butt diameter of ≥ 5.0 cm) were cut into 1-m long billets that were immediately weighed on spring balances (measurement range, 2–200 kg) and the fresh weight of the billets measured and recorded. Minor branches (butt diameter of < 5.0 cm) and twigs were similarly weighed after removing leaves, which were weighed separately. Samples of logs (≈ 30 cm long) of variable mid-length diameter for the different species on the subplot were weighed at the time of tree cutting and saved for laboratory moisture content analysis at the University of Zambia in Lusaka (see below for details).
On two of the three harvested subplots at each plot, stumps of cut trees were tagged for subsequent monitoring of stump survival. Stump survival was assessed in April 1992, one year after cutting. A stump was considered live if it had resprouted; otherwise it was considered dead. Resprouts were classified by origin on the stump (namely as trunk, base or root sprouts). Censuses of survivors among resprouted trees were also conducted in April 2000 and 2010, and the probable cause of death was recorded as either fire (with charred stump and shoots) or unknown. Annual fire occurrence on the harvested subplots was monitored from 1990 to 2000 (Chidumayo & Kwibisa Reference Chidumayo and Kwibisa2003; Chidumayo Reference Chidumayo2004): fire occurred once every 1.4 years at KM and KME, every 1.8 years at MW and every 2.3 years at CH over the 10-year period.
Aboveground biomass of selected trees
Aboveground fresh tree biomass data were obtained from 101 trees that were cut near plots KN, MW and CH in 1993, 2000 and 2001. The felled trees included 19 species, including typical miombo woodland trees, such as Brachystegia boehmii, B. manga, B. spiciformis, Julbernardia globiflora, Isoberlinia angolensis and Uapaca spp. with a dbh range of 2.0 to 39.0 cm. The procedure for measuring biomass and preparing subsamples for oven-drying was as described above.
Belowground tree biomass in pits
In October 1991 coarse tree roots were sampled in 1 × 1 m pits dug to a depth of 1.5 m or less if the bedrock was encountered before this depth. Twenty pits (four each at CH and MW, and six each at KME and KN) were dug for coarse tree root biomass measurement. More pits were dug in old-growth woodland because of higher spatial variation in tree density than in regrowth woodland. The pits were systematically located at the centre of a 20 × 10 m subplot, and were at least 1.0 m away from the nearest tree. All recognizable live woody plant roots in the pit were weighed separately for each of the three soil depths: 0–50 cm, 51–100 cm and 101–150 cm. The fresh weight of subsamples of roots, after removing soil, were measured immediately and saved for moisture content analysis in the laboratory.
Aboveground and belowground biomass of selected trees
In April 2012, 12 trees at the Nkhoma site (15.233°S and 29.163°E) (see Fig. 1) were selectively cut and coarse roots excavated to measure both aboveground and belowground tree biomass. The number of tree root systems excavated was limited due to environmental protection restrictions, but eight species with a dbh range of 4.0–35.0 cm were considered adequate for the preliminary development of allometric equations for estimating coarse root biomass from dbh data. Aboveground tree biomass was obtained as described above. For each sample tree the taproot and lateral roots, up to a distal diameter of 2.0 cm along the root length or depth (also see Nadezhdina & Cermak Reference Nadezhdina and Cermak2003; Ryan et al. Reference Ryan, Williams and Grace2011; Razakamanarivo et al. Reference Razakamanarivo, Razakavololona, Razafindrakoto, Vieilledent and Albrecht2012), were excavated and cut into 40.0-cm segments, cleaned of any soil and rock material. Tap roots and lateral roots were weighed separately after measuring the proximal diameter of each 40.0-cm root segment. Sub-samples of logs and roots, after removing soil, for the different species were measured immediately and saved for moisture content analysis in the laboratory.
Laboratory biomass moisture content assessment
All biomass subsamples for laboratory moisture content analysis were oven-dried for 72 hours at 80°C and reweighed in order to calculate oven-dry:fresh weight ratios, which were used to convert measured fresh tree mass in the field to dry weight biomass.
Data analysis
I used Statistix 9.0 software (Analytical Software, 1985–2008) for statistical model development and testing. I estimated aboveground and belowground wood biomass for individual trees using allometric equations developed from data obtained from 113 felled and 12 excavated tree root systems. Lateral root biomass in pits was estimated by a regression equation that described the relationship between biomass (kg) per m2 on basal area (BA) at 1.3 m aboveground for trees in the sample subplots in which the pit was located. The BA range in the subplots was 4.0–42.2 cm2 m−2. I used nonlinear regression analysis to describe the relationship between cumulative root biomass along the root length and root segment diameter, and analysis of variance (ANOVA) to compare differences in biomass components between old-growth and regrowth woodland types. The significance of the difference in stump survival between old-growth and regrowth woodland was tested using the two proportions (Z) test.
Evaluation of allometric models
A simple way of evaluating the performance of the regression model is by measuring the deviation of the predicted biomass (Biomasspredict) from measured observed biomass (Biomassmeasured) for each tree or pit. This error (sometimes referred to as bias) is defined as (Chave et al. Reference Chave, Andalo, Brown, Cairns, Chambers, Eamus, Fölster, Fromard, Higuchi, Kira, Lescure, Nelson, Ogawa, Puig, Riéra and Yamakura2005):
 $${\hbox {Error}}= \frac{100({\rm Biomass}_{{\rm predict}} - {\rm Biomass}_{{\rm measured}} )}{{\rm Biomass}_{{\rm measured}}}$$
This means that models should first be tested for accuracy using the observed data before one is selected. This procedure was followed in this study. The mean across 113 sample trees or 12 root systems or 20 pits was the mean error (as a %), and the standard deviation of error among sample trees or root systems or pits was the standard error (also expressed as a %) that represented the overall predictive power (accuracy) of the model. The smaller the mean error, the more accurate the allometric model estimate, and the smaller the standard error of the mean error, the more precise the regression model is in estimating the measured biomass.
Diameter and biomass data for 113 felled trees were used to develop allometric equations for aboveground biomass (on an oven-dry weight basis), while data from the 12 excavated tree root systems were used to develop equations for estimating belowground biomass. I evaluated two model types: (1) logarithmic linear (ln(y) = a + bln(x)) regression models based on natural log transformed tree dbh or basal area and aboveground or belowground biomass data and (2) a power model (y = ax b), where y is biomass, x is dbh or basal area and a and b are regression coefficients. These two model types have been commonly applied to biomass estimation in African dry forests and woodlands (Rutherford Reference Rutherford1979; Guy Reference Guy1981; Stromgaard Reference Stromgaard1985a , Reference Stromgaard b ; Tietema Reference Tietema1993a , Reference Tietema, Pierce and Gumbo b ; Malimbwi & Solberg Reference Malimbwi and Solbrig1994; Oyama Reference Oyama1996; Okello et al. Reference Okello, O'Connor and Young2001; Mugasha & Chamshama Reference Mugasha and Chamshama2002; Cleemput et al. Reference Cleemput, Muys, Kleinn and Janssens2004; Mutakela Reference Mutakela2009; Munishi et al. Reference Munishi, Mringi, Shirima and Linda2010; Sawadogo et al. Reference Sawadogo, Savadogo, Tiveau, Dayamba, Zida, Nouvellet, Oden and Guinko2010; Ryan et al. Reference Ryan, Williams and Grace2011; Shackleton & Scholes Reference Shackleton and Scholes2011).
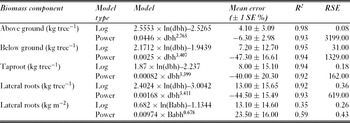
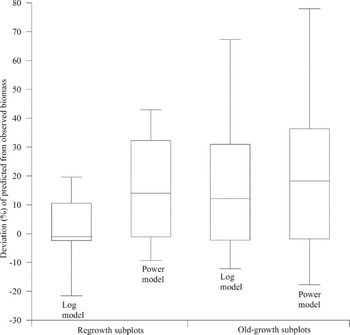
I assessed the performance of the log linear and power models for biomass estimation (Table 1). Clark & Kellner (Reference Clark and Keller2012) proposed the use of harvest test plots to compare measured biomass with model biomass estimates at stand or plot level. The log and power model types were therefore applied to data from harvested subplots and compared with the measured aboveground biomass. Overall, the log model had a mean error of 0.46 ± 7.42%, while the power model had a mean error of 7.74 ± 5.02%; the models for regrowth and old-growth woodland showed a range of error values (Fig. 2). Although it is advisable to be conservative in model selection for biomass estimation, the power model underestimated biomass of individual sample trees but overestimated subplot stand biomass more than the log model, and although the latter may overestimate biomass, it was a better indicator of biomass in this study.
Comparisons between logarithmic linear and power models for estimating aboveground and belowground wood biomasses (kg) in miombo woodland in the study area in Zambia. Babh = tree/stem basal area (cm2 m−2) at 1.3 m aboveground, R2 = coefficient of determination and RSE = residual standard error in ln(kg) for log models and kg for power models.

Comparison of deviations (relative error values) of biomass estimates using the logarithmic and power models from observed aboveground biomass on harvested suplots in 1991 at regrowth and old-growth woodland using box-whisker plots. The box hinges represent the first and third quantiles, the centre horizontal line in the box is the median, and the vertical lines indicate the range of values that are within 1.5 of the hinges.

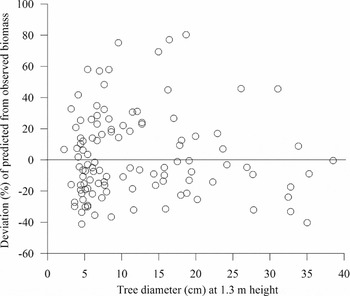
Derived log data were back transformed without application of a correction factor, because Chidumayo (Reference Chidumayo2012) found little difference in the estimates after applying a first-order correction factor (Chave et al. Reference Chave, Andalo, Brown, Cairns, Chambers, Eamus, Fölster, Fromard, Higuchi, Kira, Lescure, Nelson, Ogawa, Puig, Riéra and Yamakura2005). These models were developed using different predictor variable ranges and ideally should be applied to data within these ranges. However, I applied these models to trees with a dbh range of 3.2–54.8 cm, while the models were originally developed for a dbh range of 2.0–39.0 cm. I plotted the deviations of the predicted values from the observed values on dbh, and found that there was no significant dispersion of deviations with increasing dbh (Fig. 3); it was thus reasonable to extend the models to larger tree sizes.
Deviation (error) of model log linear predicted values from observed aboveground wood biomass of felled trees in the study area.

I also undertook a statistical analysis of root biomass data to determine whether the selected cut-off size for coarse roots of 2.0 cm distal diameter was adequate for sampling individual tree root biomasses. Ryan et al. (Reference Ryan, Williams and Grace2011) also used the 2.0 cm cut-off point for coarse roots in their analysis of Mozambican miombo woodland. The root biomasses were measured using 40.0-cm long root segments until a root size of 2.0 cm was reached. The cumulative biomass of each root was then regressed on diameter of root segments until the minimum size was reached. The most robust model that fitted the data was the Farazdaghi-Harris model (Analytical Software 1985–2008):
 $$\begin{eqnarray*}
Y = 1/(a + bX^{c}),\end{eqnarray*}$$
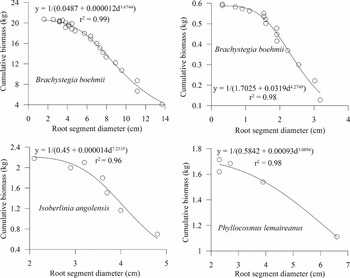
The above model gave a good fit to the observed data, which suggests that this sampling approach was adequate for measuring coarse tree root biomass for most species. In the majority of cases, the cumulative biomass curve started to flatten when the distal diameter of the root approached 2.0 cm (Fig. 4). Nevertheless, this approach is likely to underestimate root biomass due to the exclusion of roots with < 2.0 cm distal diameter and losses of root fragments during cutting (see Niiyama et al. Reference Niiyama, Kajimoto, Matsuura, Yamashita, Matsuo, Yashiro, Ripin, Kassim and Noor2010).
Regression of cumulative biomass on proximal diameter of 40.0-cm root segments from origin (right side of x-axis) towards the distal end (left side of the x-axis). The Farazdaghi-Harris models that best described the nonlinear relationship are given for each sample root for each species.

RESULTS
Aboveground and belowground tree biomass
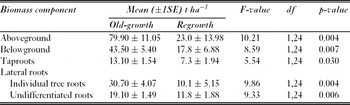
There were significant differences in aboveground and belowground tree biomasses between old-growth and regrowth woodland (Table 2). Aboveground and belowground biomass in regrowth woodland represented, on average, 29% and 41%, respectively, of the biomass in old-growth woodland. Belowground biomass represented 55% of the aboveground biomass in old-growth woodland and 77% in regrowth woodland. This indicates that the root:shoot ratio (R/S) was higher in regrowth than in old-growth woodland. There was no significant difference in belowground biomass estimates derived from the equation for estimating total belowground biomass and the sum of biomass obtained separately from the two equations for estimating taproots and lateral roots (Table 1). However, models based on pit samples underestimated lateral roots biomass in old-growth woodland and overestimated lateral roots biomass in regrowth woodland (Table 2). Because pit samples were located at least 1.0 m from the nearest tree trunk, they did not include taproots. Lateral roots sampled in pits were concentrated in the top 0–50 cm soil depth where 76.7 ± 3.81% of the biomass was recorded compared to 19.7 ± 3.08% and 3.6 ± 0.92% in the 50–100 cm and 100–150 cm soil depths, respectively, with no significant differences between old-growth and regrowth woodland. Lateral roots of excavated trees ranged from 2.0 m to 9.6 m (mean 4.5 ± 0.47 m) in length and there was a significant log linear relationship between proximal lateral root diameter (d, cm) and biomass (kg): ln(y) = 2.1334 × ln(d) – 2.57524; mean error = 16.4 ± 16.0%, MSE = 0.335, r2 = 0.77). This equation can be used to estimate lateral root biomass from proximal diameter data for trees in miombo woodland to avoid the laborious and destructive work of excavating lateral roots. Taproots ranged from 0.5 to 1.7 m (mean = 0.9 ± 0.02 m) in length. In the study area, lateral roots made up nearly 57% and 71% of total belowground biomass in regrowth and old-growth woodland, respectively; taproots, including the stumps, made up the remainder of the belowground biomass. Clearly lateral roots constitute a major component of belowground tree biomass in miombo woodland.
Differences in wood biomass between old-growth and regrowth miombo woodland types in the study area in central Zambia.

Changes in belowground biomass in clear-cut subplots
One year after tree cutting, the survival rate of cut trees of 94.4 ± 4.62% in regrowth subplots was significantly higher than that of 78.1 ± 4.17% in old-growth subplots (Z = 4.98, p < 0.0001). Live stumps had 1.7 ± 0.46 resprout shoots per stump on average. The majority of live stumps (56.8%) resprouted from the stump base (basal resprouts), while a minority (1.7%) produced root resprouts (only recorded in old-growth woodland). The remaining 41.5% produced trunk resprouts. After one year, almost half of the dead stumps (43%) belonged to Uapaca kirkiana and the remainder were distributed among eight other species, with Isoberlinia angolensis, Julbernardia globiflora and Uapaca nitida together accounting for 25%.
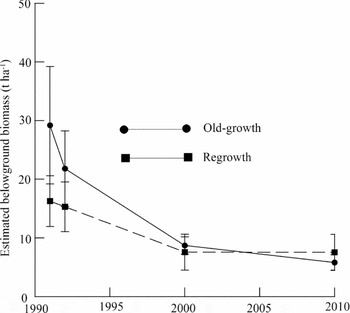
Estimated belowground biomass in clear-cut subplots at the time of tree cutting in 1991 were 16.3 ± 3.63 t ha−1 and 29.2 ± 8.36 t ha−1 in regrowth and old-growth woodland, respectively. Belowground biomass (BGB) in 1992, 2000 and 2010 was estimated using the following formula:
BGBt+1 = (Surviving trees at t+1/trees cut at t0) × BGBt0
where BGBt+1 is biomass in 1992 or 2000 or 2010, and BGBt0 is biomass at time of tree cutting in 1991. After one year, belowground biomass had decreased by 5.7 ± 4.6% in regrowth and 22.0 ± 4.2% in old-growth woodland, and 19 years later, in 2010, only 44.3 ± 6.5% and 26.5 ± 8.4% of the biomass in 1991 was estimated to be alive; in absolute terms, in 2010, the biomass in regrowth and old-growth was almost identical (Fig. 5). The main cause of mortality of resprouted trees after 1992 was fire, which must have led to the subsequent loss of belowground tree biomass. Fires are very frequent in the study sites, either occurring annually or biannually (Chidumayo & Kwibisa Reference Chidumayo and Kwibisa2003; Chidumayo Reference Chidumayo2004).
Changes in estimated belowground wood biomass on subplots following clear-cutting of old-growth and regrowth miombo woodland in 1991. Vertical lines indicate 1 standard error of the mean.

DISCUSSION
Allometric models for estimating tree biomass
Most models for biomass estimation in dry forests and woodlands in sub-Saharan Africa have been selected not on the basis of their accuracy, but on the value of the r2, which is a measure of the explanatory power of the variance in the predicted variable and not necessarily the models’ accuracy as determined by their mean error of prediction. Chidumayo (Reference Chidumayo2012) found no clear relationship between r2 and mean error; higher values of r2 did not necessarily mean a lower mean error or higher model prediction accuracy.
Of the two model types evaluated in this study, the logarithmic model performed better than the power model at both individual tree and harvested stand levels. Ryan et al. (Reference Ryan, Williams and Grace2011) also found that log models performed better in estimating wood biomass in Mozambican miombo woodland. However, application of a particular model to plot or stand data resulted in a mean error that was more than that calculated using individual tree data. This indicates that the accuracy of a model may vary depending on the level at which it is applied (also see Nickless et al. Reference Nickless, Scholes and Archibald2011). The allometric equation used to estimate coarse root biomass in this study was based on a small sample of 12 trees due to environmental protection restrictions, as excavation of entire tree root systems is very destructive. Ryan et al. (Reference Ryan, Williams and Grace2011) developed an allometric equation for estimating coarse root biomass based on a sample of 23 excavated tree root systems in a Mozambican miombo woodland that was very similar to the one developed from the 12 trees in this study. Nevertheless, where legal considerations permit, future studies should consider using larger samples of excavated trees to increase confidence in the allometric equations.
The log models used in this study were developed using stems with a dbh range of 2–39 cm and should ideally be applied to stems within this range. However, the dbh range of sample stems in sample subplots was 2–50 cm. The relationship between error in biomass estimate and dbh in the present study indicated that the models may be applied to larger trees with reasonable accuracy, at least in the miombo woodland, because error did not necessarily increase with increasing stem dbh.
Aboveground and belowground tree biomass
Much work has been done to estimate aboveground tree biomass in dry forests and woodlands of sub-Saharan Africa; however, direct comparisons are hampered by the different models that have been used to derive biomass estimates. A recent study by Ryan et al. (Reference Ryan, Williams and Grace2011) in miombo woodland in Mozambique used a log linear model to estimate tree biomass (stem + root) found values of 6.6 t ha−1 to 184 t ha−1 with a mean of 68.3 t ha−1 (data converted from carbon stocks by multiplying by 2.13). Here, the estimated mean biomass of 123.4 t ha−1 for old-growth woodland is much higher. Estimation of belowground biomass in forests was based on the root:shoot ratio (R/S); Cairns et al. (Reference Cairns, Brown, Helmer and Baumgardner1997) indicated this ratio was 0.2–0.3 (average 0.26), the IPCC (2006) recommended a value of 0.23–0.85 (average 0.47) for deciduous forests, including tropical dry and seasonal moist forests, while Ryan et al. (Reference Ryan, Williams and Grace2011) gave an estimate of 0.27–0.58 (average 0.42) in Mozambican miombo woodland. The R/S ratio of 0.54 found in this study is therefore within the range reported for the miombo woodland in Mozambique and the recommendations of the IPCC guidelines, but was higher than the means. I also found that coarse tree root biomass density based on pit samples underestimated belowground biomass, perhaps because the samples excluded taproots (including stumps) as pits were distant from tree trunks. This is despite estimates based on excavated roots, which showed that lateral roots constituted a major component of coarse tree root biomass in the study area. However, the pit samples confirmed the frequently reported observation that most of the root biomass in dry forests and woodlands in sub-Saharan Africa is concentrated in the top soil, down to 40–50 cm depth (Okali et al. Reference Okali, Hall and Lawson1973; Seghieri Reference Seghieri1995; Mordelet et al. Reference Mordelet, Menaut and Mariotti1997; February & Higgins Reference February and Higgins2010; Kell Reference Kell2012). Even in Neotropical savannah woodlands, more than 70% of the belowground biomass occurs in the upper 30 cm of soil (de Castro & Kauffman Reference de Castro and Kauffman1998).
Different authors have used different cut-off sizes for the classification of coarse tree roots (Mordelet et al. Reference Mordelet, Menaut and Mariotti1997; Richardson & Dohna Reference Richardson and Dohna2003; Niiyama et al. Reference Niiyama, Kajimoto, Matsuura, Yamashita, Matsuo, Yashiro, Ripin, Kassim and Noor2010; Ryan et al. Reference Ryan, Williams and Grace2011; Kuyah et al. Reference Kuyah, Dietz, Muthuri, Jamnadass, Mwangi, Coe and Neufeldt2012). Like Nadezhdina and Cermak (Reference Nadezhdina and Cermak2003), Ryan et al. (Reference Ryan, Williams and Grace2011) and Razakamanarivo et al. (Reference Razakamanarivo, Razakavololona, Razafindrakoto, Vieilledent and Albrecht2012), I used a cut-off size of 2.0 cm distal diameter for the classification of coarse tree roots. Regression analysis of cumulative root biomass on successive proximal diameter of segments along the root length confirmed that nearly all the coarse tree root biomass was measured using this approach (see Fig. 3). This cut-off size is therefore recommended for studying coarse tree roots biomass in miombo woodland.
Changes in belowground biomass after clear-cutting old-growth woodland
Regrowth woodland of eight to 18 years old was responsible for c. 40% of the coarse tree root biomass found in old-growth woodland, suggesting that clear-cutting of miombo woodland results in a significant loss of belowground biomass. Lateral root biomass seems to suffer most severely, with regrowth representing only 33% of the biomass in old-growth woodland in contrast to 52% of taproot biomass, even after several years recovery. The high taproot biomass also resulted from increased tree density owing to sapling recruitment into the tree phase, and suggests that taproot development precedes lateral root development in miombo tree species. The loss of belowground biomass can be a significant source of carbon emissions following miombo woodland clearing. The loss of root biomass occurs due to stump mortality, which in the first year after clearing is higher in old-growth than regrowth woodland, perhaps because of reduced resprouting capacity in older trees, a consequence of bud mortality or thicker bark that might prevent buds breaking through the surface to form new shoots. Fire-related mortality of resprouted trees increased in the years following woodland clearing (Chidumayo Reference Chidumayo2004), and was the major cause of loss of belowground biomass in the study area. Modelling also indicates that biomass in miombo woodland cannot be sustained under annual fires (Ryan & Williams Reference Ryan and Williams2011). In the study sites, annual and biannual fires were most probably responsible for the loss of nearly 60% of root biomass within a 10-year period after woodland clearing. As resprouted trees grow taller, the impact of fire on belowground biomass decreases, such that, nearly 20 years after woodland clearing, root biomass loss was only 65%. Nevertheless, this fire-related loss of root biomass has serious implications for carbon emissions in miombo woodlands following clearing. Low-intensity fires are required to maintain tree populations and biomass in miombo woodland (Ryan & Williams Reference Ryan and Williams2011).
CONCLUSIONS
Aboveground and belowground tree biomass were nearly 80 t ha−1 and 44 t ha−1 in old-growth woodland, respectively; the corresponding biomass in regrowth woodland were 23 t ha−1 and 18 t ha−1. The root:shoot ratio of 0.77 in regrowth woodland was higher than that in old-growth woodland (0.54). The lower belowground biomass in regrowth woodland suggests that there is a loss of root biomass following miombo woodland clearing. The immediate loss of belowground biomass was owing to reduced resprouting of cut trees; subsequent gradual loss of belowground biomass occurs because of fire destruction of resprouted trees. Over a 20-year period, I estimated the loss of belowground biomass in cleared subplots at 9 ± 2 t ha−1 in regrowth stands and 23 ± 8 t ha−1 in old-growth stands. The control of fire in cleared sites can increase the survival and maintenance of belowground biomass, and significantly reduce carbon emissions from tree roots following miombo woodland clearing. Fire control should therefore be the primary goal of forest management for carbon storage and sequestration in the dry miombo forests of southern Africa.
ACKNOWLEDGEMENTS
The establishment and initial inventory of the sample plots was made possible by financial support from the Stockholm Environment Institute, Sweden. Liywalii Kwibisa, Oscar Kalumiana and Gershom Chilukusha conducted the fieldwork during 1990–1993 and in 2000. Nsama Saboi, Joel Lwambo, Cynthia Kambole, Nancy Serenje, Mwale Chishaleshale, Kayo Chipeta, Nozyechi Chidumayo, Phelire Phiri, Tom Chisenga, Fredah Siyanga Tembo, Stanley Simasiku, Mauris Makeche, Kafita Kambikambi and Setwayo Mtonga inventoried sample subplots and collected biomass data from felled and excavated trees, while on attachment to the Makeni Savanna Research Project after graduation from the University of Zambia and Copperbelt University.