Introduction
The need to conserve forest ecosystems has been globally recognised given the high levels of biodiversity they support, and the vital ecosystem services they provide (Gardner et al. Reference Gardner, Barlow, Chazdon, Ewers, Harvey, Peres and Sodhi2009). In developing nations, the socio-economic value of forests is particularly important as the resources they provide comprise a critical component of livelihood strategies for millions of people (Sunderlin et al. Reference Sunderlin, Dewi, Puntodewo, Müller, Angelsen and Epprecht2008). While the value of forest resources in these nations has traditionally been realised through their domestic use, trade incomes derived through the informal commercialisation of certain forest products, such as timber, have become increasingly important (European Commission 2013). Consequently, there is urgent need for forest management strategies in developing nations that integrate timber harvesting with the conservation of forest biodiversity, necessitating an understanding of the ecological implications of this resource use. However, while several studies have examined the ecological impact of commercial timber harvesting in tropical forests, comparatively few studies have aimed at understanding the effect of timber harvesting in temperate forests, particularly in subtropical Africa (LaManna and Martin Reference LaManna and Martin2017).
Disturbance in forests is natural, and one of multiple important factors influencing the distribution and composition of species (von Maltitz et al. Reference Von Maltitz, Mucina, Geldenhuys, Lawes, Eeley, Adie, Vink, Fleming and Bailey2003). The creation of small-scale openings in the canopy (i.e. canopy gaps) through wind falls, or natural tree or limb death, is a key natural disturbance in temperate forests, affecting both the dynamics and abundance of tree species (Ott and Juday Reference Ott and Juday2002) and forest-scale habitat heterogeneity through the creation of a shifting mosaic of habitat patches following a disturbance (Runkle Reference Runkle1981). Thus, a direct effect of canopy gap creation is the loss or modification of microhabitats used by forest organisms (Vitt et al. Reference Vitt, Avila-Pires, Caldwell and Oliveira1998, Fuller Reference Fuller2000). However, given that canopy gap formation is an integral component of the natural disturbance-recovery regimes that drive forest dynamics, forest species have adapted to such habitat disturbances (Pickett and White Reference Pickett and White1985, Laska Reference Laska2001). Consequently, a central guiding principle of sustainable forest management is that harvesting practices should mimic natural disturbance processes as it is thought that these will minimise the ecological impact of human-mediated disturbances (Mori Reference Mori2011). It is thus important to understand how human-mediated canopy disturbances deviate from the type and frequency of natural canopy disturbances, and consequent biodiversity responses.
Canopy gaps result in habitat conditions that are in stark contrast to those in the surrounding intact forest, shown to differ in terms of microclimate (Vitt et al. Reference Vitt, Avila-Pires, Caldwell and Oliveira1998), primary productivity (Phillips and Shure Reference Phillips and Shure1990), habitat structure (Fuller Reference Fuller2000), detritus (Greenberg and Lanham Reference Greenberg and Lanham2001) and plant species composition (Kern et al. Reference Kern, Montgomery, Reich and Strong2014). Given the altered physical and biological characteristics associated with gaps, forest animals, including birds, have been shown to distinguish between gap and intact habitat conditions (Blake and Hoppes Reference Blake and Hoppes1986, Levey Reference Levey1988, Fuller Reference Fuller2000, Greenberg and Lanham Reference Greenberg and Lanham2001, Moorman and Guynn Reference Moorman and Guynn2001). Bird responses to canopy gaps are dependent on multiple variables, including age, size and frequency of canopy gaps (Moorman and Guynn Reference Moorman and Guynn2001, Jobes et al. Reference Jobes, Nol and Voigt2004); season (Bowen et al. Reference Bowen, Moorman and Kilgo2007); latitude and forest type (LaManna and Martin Reference LaManna and Martin2017); and the life history and ecological traits of bird species (Thiollay Reference Thiollay1999, Forsman et al. Reference Forsman, Reunanen, Jokimäki and Mönkkönen2010). Consequently, the spatial distribution and species composition of avifaunal communities has been shown to be affected by canopy gaps, mediated by species’ variable sensitivity to habitat modifications following canopy disturbances (Thiollay Reference Thiollay1999, Greenberg and Lanham Reference Greenberg and Lanham2001, Fuller Reference Fuller2000). Specifically, degree of habitat specialisation, body size, primary diet and nesting strategy have been found to be important determinants of bird responses to canopy gaps (Thiollay Reference Thiollay1999, LaManna and Martin Reference LaManna and Martin2017).
In unmanaged indigenous coastal forests of the Eastern Cape Province of South Africa, canopy gaps are an important component of the natural disturbance regime, caused by strong coastal winds, natural tree-falls or senescence (Obiri and Lawes Reference Obiri and Lawes2004). Currently, informal timber harvesting in these forests is resulting in canopy gaps in addition to those caused by natural disturbance. While Obiri and Lawes (Reference Obiri and Lawes2004) showed that rates of harvest gap creation did not negatively affect tree species richness in this region, the impact of harvest gaps on forest habitat condition, and concomitant responses by forest birds is currently unknown. This represents a critical gap in our knowledge, particularly in light of recent findings by Cooper et al. (Reference Cooper, Wannenburgh and Cherry2017), which showed that over half of South Africa’s forest-dependent birds have suffered range declines in the past 20 years, with declines most prominent in the Eastern Cape, despite increases in forest cover over the same time period. This suggests that habitat degradation may be driving forest bird declines in the region. In the context of widespread informal harvesting in state forests in the Eastern Cape (Leaver and Cherry Reference Leaver and Cherry2020), this study aimed to determine the relative frequency and impact of harvest-created canopy gaps on habitat structure, avifaunal species richness, and community structure in a threatened lowland forest type in the Eastern Cape. Specifically, this study aimed to: i) compare the abundance and characteristics of harvest-created gaps and natural gaps; ii) assess habitat structure across intact forest, harvest gaps and natural gaps; and iii) determine the effect of habitat modification resulting from canopy gap formation on bird community structure.
Materials and methods
Study site
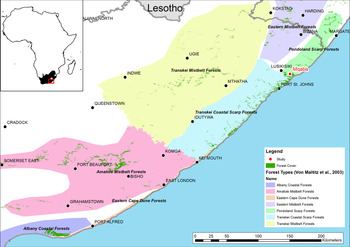
This study was conducted at Mqaba forest (31°26′8.36″S, 29°44′9.36″E), which forms part of the Ntsubane forest complex, located in the north-eastern coastal region of the Eastern Cape Province, South Africa (O.R. Tambo District; Figure 1). The topography of this region is mountainous, with fragmented forest patches within a grassland matrix, and scattered rural settlements (von Maltitz et al. Reference Von Maltitz, Mucina, Geldenhuys, Lawes, Eeley, Adie, Vink, Fleming and Bailey2003). Indigenous forests in this region are classified as Pondoland scarp forests, occurring on south- or east-facing slopes of the coastal scarp ridge (Figure 1B). Mean annual rainfall in the region varies between 660 mm and 1,200 mm, with rainfall occurring predominantly in the summer period, between October and March. Temperatures are mild, with mean annual temperatures ranging from 18 to 20°C.
Location of the Eastern Cape within South Africa, and Mqaba forest within the Eastern Cape.

Socio-economically, this district falls entirely within the former homeland of the Transkei and remains characterised by a weak infrastructure and limited economic opportunities. Consequently, the region has some of the highest rates of poverty (43.5%) and unemployment (35.5%) in the province (Statistics South Africa 2018). The district is the most populous in the Eastern Cape (21% of the total provincial population), with a positive growth rate (1.5% annually). Furthermore, it has the highest youth population (39% between the ages of 15 and 34) and lowest levels of education (17% of people over 20 have no formal education) in the province. The number of households is increasing (annual growth rate of 1.8%) and, unlike other districts in the Province, the majority (55%) of households are traditional dwellings (i.e. constructed largely from natural resources). Given these socio-economic conditions, subsistence and commercial use of forest products represent a critical contribution to rural livelihoods in this district (Obiri Reference Obiri2002).
Mqaba is representative of one of the last remnant patches of Pondoland scarp forest >1,000 ha. This forest thus has high biodiversity value, given its large core area and subsequent reduced edge effects impacts. Furthermore, Pondoland scarp forests are the most plant species- diverse forest type in South Africa, with the highest number of unique and endemic plant species, many of which are red-listed (Berliner Reference Berliner2009). Despite their high biodiversity, Pondoland scarp forests have the lowest level of formal protection and are thus highly vulnerable to biodiversity loss. Effective sustainable management within these biodiversity-rich, unprotected forests is thus a conservation priority. Mqaba is located on a south-easterly slope, spanning an elevational gradient of 40–440 m above sea level, typical of Pondoland scarp forests. Formal logging of high value indigenous trees occurred in Mqaba prior to the ban on indigenous forest logging in 1939, although logging activities of this era were largely focussed on inland forests, such that historical logging levels are likely to have been low in this forest (Obiri Reference Obiri2002). In more recent times, informal timber harvesting has occurred as an important way for rural households to supplement income (Obiri Reference Obiri1997, Reference Obiri2002). Although current forest legislation aims for sustainable resource use and allows for the issue of permits for commercial-scale harvesting, no permits have been issues in the region such that all timber harvesting is currently illegal and unregulated. A number of rural communities occur less than 3 km from the forest boundary, and a road intersects the length of the forest. As with 70% of indigenous forests in the Eastern Cape, Mqaba in managed by the state under the Department of Environment, Forestry and Fisheries (DEFF).
Study design
The study comprised two components: first, straight-line transects were walked to quantify and characterise natural- and harvest-canopy gaps across the forest; second, habitat variables and the bird community were sampled at a subset of natural gap sites, harvest gap sites and intact forest sites (i.e. no major canopy disturbance present) to assess the response of birds to different habitat conditions.
Gap occurrence and characteristics
Gaps were sampled along eight belt transects 20-m wide and a mean of 290-m long (range: 150–240 m). Transects were located from 400 m above sea level to a minimum of 288 m, with individual transects having an average elevational range of 22.88 m (range: 5–63 m) and running along moderate slopes. All transects ran along an east-west axis, except for one, which had a north-south orientation. All canopy gaps or part of a gap falling within the 20-m wide belt were included in the sample. A gap was defined as an opening in the forest canopy, extending to the bases of canopy trees surrounding the canopy opening, and where regeneration height within the gap was <50% of the surrounding canopy height (Runkle Reference Runkle1981). The gap perimeter was identified as the line joining the stems of canopy trees surrounding the canopy gap (after Obiri and Lawes Reference Obiri and Lawes2004) and was walked with a handheld Garmin GPS to map their location and extent. This definition of canopy gaps thus includes the forest area directly and indirectly affected by the canopy opening and can thus be considered the delineation of “expanded gaps” (Runkle Reference Runkle1981). Sampled gaps were defined as natural gaps (due to wind-fall, branch- or bole-snapped trees or naturally dead standing trees) or harvest gaps (due to the selective harvesting of canopy trees). Gap length (defined as the largest distance between gap edges) and width (defined as the largest distance perpendicular to length) were recorded at each gap using a range meter, from which gap area in m2 (defined as πLength*Width/4), and L:W ratio, as a measure of gap shape, were later calculated. The following gap-maker (i.e. the tree that created the canopy gap) variables were also recorded: i) species (where identifiable), ii) diameter at breast height (DBH), iii) estimated height (along the fallen/felled stem), iv) stage of decay (based on a scale of 1–5 from fresh to highly decayed), and v) whether the gap-maker stem was removed from the gap or not. Where gap-maker stems had been removed by harvesters, stem length was estimated based on the distance from the cut stump to the cut end of the portion of the harvested tree left in the forest.
Species traits, and abbreviations used, included in RLQ analysis

Habitat structure across natural gaps, harvest gaps, and intact forest sites
To assess variation in habitat, six harvest-created gaps, six natural gaps, and six intact sites were sampled using circular plots of 0.04 ha (11.3m radius). Harvest gap and natural gap sites sampled represented a subset of those identified during transect walks and were selected such that a minimum distance of 150 m was maintained between all sampled gaps. The centre of harvest gap and natural gap plots was placed at the base of the gap-maker. Canopy gaps sampled thus included a range of gap ages, with 30% and 25% of harvest and natural gaps sampled estimated to have occurred within the past five years respectively, while the majority of gaps of both types were estimated to be older than five years old. Intact sites were identified as sites where the canopy was undisturbed, and where there were no major canopy disturbances within 50 m of the centre of the plot. Intact sites were located in a random outward direction, but within 200 m from either the start or end point of belt transects sampled, while ensuring that a minimum distance of 150m was maintained between all selected intact sites, and natural- and harvest gap sites sampled.
Within circular 0.04 ha plots of intact, harvest gaps and natural gaps the following microhabitat variables were measured: i) estimated percentage cover of canopy, shrub, exotic species, herb, grass, leaf litter, woody debris, liana and bare ground; and ii) the vertical foliage profile was recorded by estimating foliage density at incremental height classes: 0– 0.5 m; 0.5–1 m; 1–2m; 2–5m; 5–10m and >10 m. Foliage density at each height class was estimated using an 8-m long telescopic pole, marked at each height interval. The pole was sequentially set up at eight evenly spaced points along the plot boundary. Visual estimates of foliage density (as a percentage) at each height class were made from the plot centre. A rangefinder was used to assist with estimates of foliage density beyond the 8-m length of the telescopic pole. Foliage density at each height class interval was calculated as the mean percent density from the eight separate estimates. Foliage density scores were later converted into a foliage height diversity index (FHDI) per plot using the Shannon-Weiner Diversity Index (SWDI) formula, as follows:
 $$ H=-\sum \limits_{i-1}^s{p}_i\ln \left({p}_i\right) $$
where pi is the proportion of the total foliage which lies in the ith layer of the chosen horizontal layers (Bibby et al. Reference Bibby, Burgess and Hill2000). This index thus provided a measure of the vertical heterogeneity at each plot. iii) Understorey fruit and flower availability were scored on a scale of 0–3, where 0 = none; 1 = 1–10; 2 = 10–20; and 3 = >20.
Bird surveys
Bird surveys were conducted at selected intact (n = 6), harvest gap (n = 6) and natural gap (n = 6) sites during the summer breeding season in the study region (December 2017). Non-fixed-radius point-counts were conducted to sample birds (Blondel et al. Reference Blondel, Ferry and Frochot1981). All birds calling over a 10-minute period were recorded using a Song Meter SM4 acoustic recorder attached to a tree at a height of 1.5 m near the centre of each plot. Birds seen during the 10-minute period were visually identified by JL in the field, and birds recorded on the Song Meter were audibly identified thereafter through playback of recordings by JCC. Each site was surveyed twice during the morning period (sunrise +3 hours), with repeated surveys conducted on different days. Surveys were conducted in alternating sequence to ensure that repeat surveys at each survey site were done at different times within the 3-hour morning period. Bird surveys were consistently conducted on dry, still days. Any birds seen or heard which could not be confidently identified were not recorded. This represented 2% of all observations, recorded in 3, 4 and 4 harvest gaps, intact sites and natural gaps, respectively, such that omission of these recordings was not thought to affect results. Presence/absence data at each plot were pooled, thereby determining species richness as the cumulative number of species recorded within a plot. Given that the focus of the study was on habitat-scale use by the forest bird assembly, birds observed flying above the forest canopy were not included in analyses. Bird species recorded are listed in Table S1 in the online supplementary materials.
Data analyses
Gap occurrence and characteristics:
The percentage of each straight-line transect intersected by gap conditions was assessed by overlaying mapped gap shape files onto walked transects using Google Earth. Mean percent of transect length intersected by gaps was calculated, as well as the relative contribution of natural gaps and harvest gaps to this overall percentage. Gap and gap-maker characteristics were compared across natural gaps and harvest gaps using Mann-Whitney U Tests where data were non-normally distributed and T-tests for normally distributed data. A chi2 Test was used to compared gap variables measured categorically (i.e. stem decay and stem removal).
Habitat across natural gaps, harvest gaps and intact forest sites:
To assess forest-scale habitat variation across intact sites, natural gaps, and harvest gaps, and the variables driving this, a principal components analysis (PCA) was applied to a matrix of 18 rows (all plots sampled) and 16 columns (measured habitat variables). The PCA thereby created different habitat gradients (i.e. principal components or PCs), and visual assessment of the location of sampled sites along these gradients. PCA was run using the ‘pca’ function (factominer package) in R (R Core Team 2017). Differences in vertical profiles across intact sites, natural gaps and harvest gaps were assessed by comparing foliage density at different height classes using analysis of variance (followed by Tukey’s test for pairwise comparisons) where data were normally distributed, or Kruskal-Wallis test (followed by Dunn’s post-hoc test) where data were non-normally distributed using R. P-values were adjusted based on Bonferroni’s adjustment to account for multiple testing.
Bird species richness and composition across natural gaps, harvest gaps and intact forest sites:
Chao2 non-parametric species richness estimator was used to compare observed species richness to expected values in harvest gaps, intact sites and natural gaps, respectively. Furthermore, species accumulation curves based on the frequency of occurrence of species across sites, derived from incidence-based data, were used to assess whether bird surveys had sufficiently sampled the bird community at each habitat type (harvest gaps, natural gaps and intact forest). This was done using the iNEXT package (Hsieh et al. Reference Hsieh, Ma and Chao2020). Differences in bird species richness and community dissimilarity based on species presence/absence (Jaccard dissimilarity) were compared directly across groups (natural gaps, harvest gaps and intact sites) using analysis of variance (followed by Tukey’s test for pairwise comparisons). To compare community dissimilarity across habitat types, pairwise dissimilarities among each possible pair of samples within each group were first computed such that for each habitat type, n = 15. To test for significant differences in community composition across harvest gaps, natural gaps and intact sites, analysis of similarity (ANOSIM) was used based on species presence/absence (Jaccard dissimilarity). To provide further insight into forest-scale associations between avifaunal community structure and habitat conditions across intact sites, natural gaps and harvest gaps, RLQ analysis (Doledec et al. Reference Doledec, Chessel, Braak and Champely1996) was conducted. This analysis is a three-way ordination that maximises the covariance between species and the sites that they occur in (Table L) based on an array of functional traits (Table Q) and the habitat conditions at the site (Table R). RLQ thus links species traits to habitat conditions through the simultaneous ordination of a table of habitat conditions (Table R), table of species presence/absence (Table L), and table of species traits (Table Q). Consequently, species that occur in sites with similar habitat conditions are positioned close together in ordination. Similarly, sites that have species with similar traits are positioned close together. Traits included in the RLQ analysis were primary diet, foraging strategy, foraging strata and nest type (Table 1), and only bird species recorded in more than 5% of the survey sites overall were included in the RLQ analysis. Habitat variables used in the RLQ analysis, and information regarding their values across sample forests are listed in Table S2, while bird species included in the RLQ and the qualitative traits assigned to them are listed in Table S3. The significance of the relationship between species traits and habitat conditions was tested using a permutation test with 1,000 permutations. Lastly, to complement the exploratory ordination approach of the RLQ, a fourth corner model was used to quantify the nature and strength of environment-trait associations, thereby identifying which particular traits were sensitive to habitat modification (Brown et al. Reference Brown, Warton, Andrew, Binns, Cassis and Gibb2014). Using the ‘trait.glm’ function in the ‘mvabund’ package (Wang et al. Reference Wang, Naumann, Eddelbuettel, Wilshire and Warton2020), a single generalized linear model (GLM) with a binomial distribution and LASSO (least absolute shrinkage and selection operator) penalty was fit in which the presence/absence of all species (L) at all sites simultaneously (as the response variable) was assessed in relation to three types of explanatory variable: the habitat condition measured at each site (R), species traits (Q), and the interaction between habitat variables and functional traits (R:Q). The LASSO approach simplifies interpretation by setting model terms that do not explain any variance to zero. For this analysis, habitat conditions were represented by the principal components (PC1 and PC2) derived from PCA of all measures habitat variables. Analyses were all carried out in the R statistical environment (R Core Team 2017).
Results
Gap occurrence and characteristics
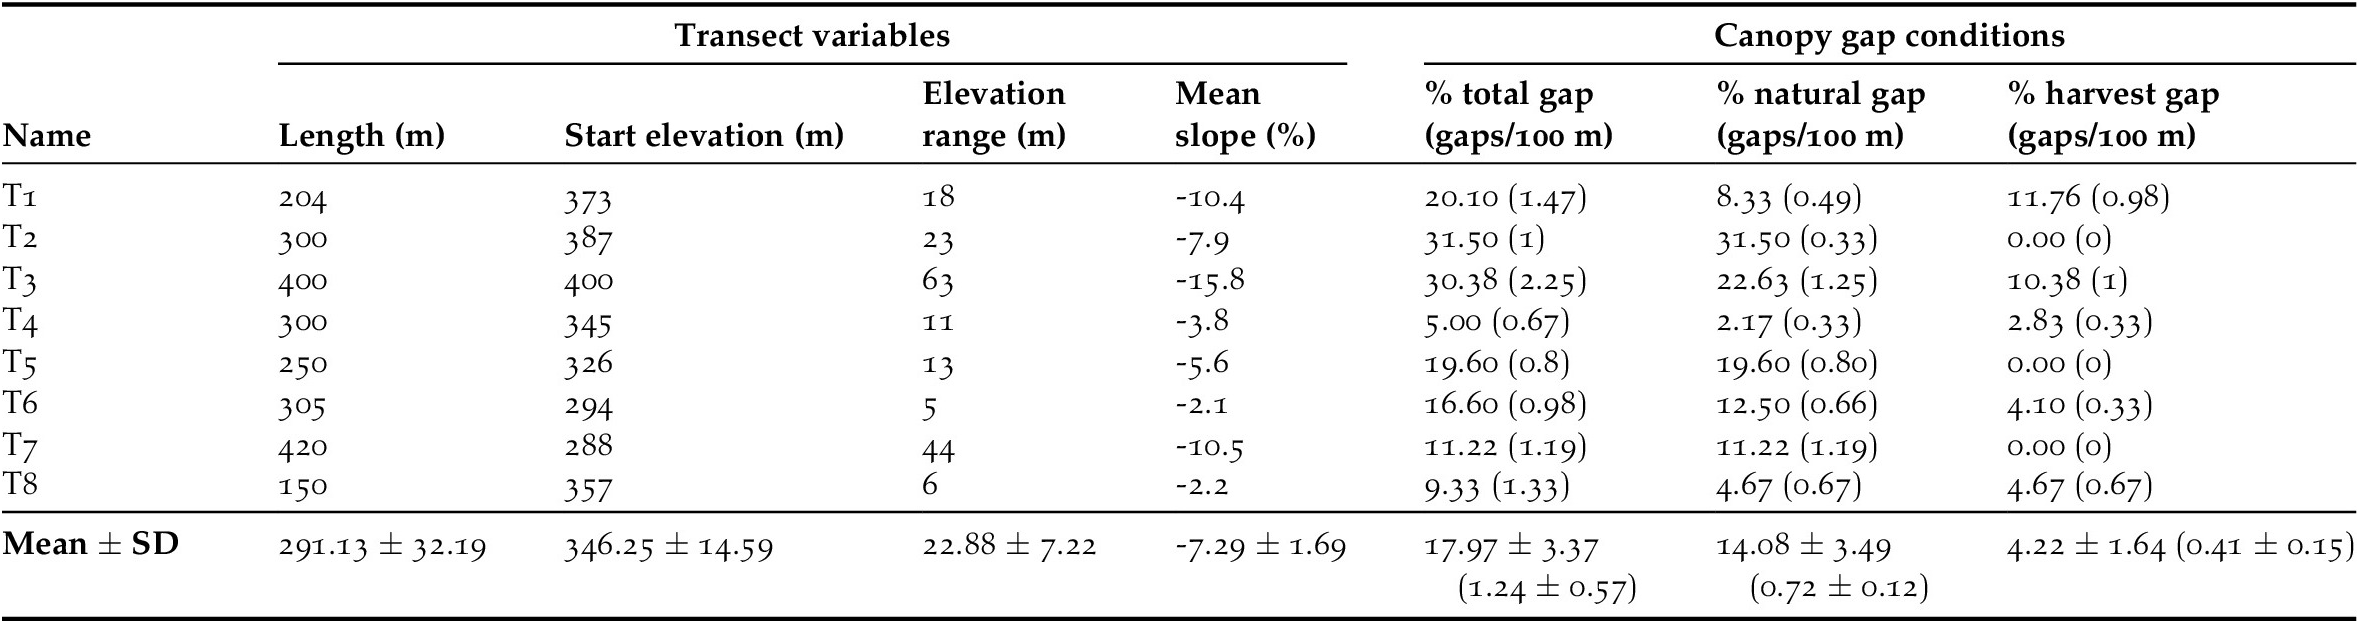
A total of 2,327 m were sampled over eight transects, along which a total of 29 gaps were encountered: 20 natural and 9 harvest-created. Overall, an average of 17.97% (± 3.37) of transect length was under gap conditions, with 14.08% (± 3.49) attributed to natural gaps, and 4.22% (± 1.64) due to harvest-created gaps (Table 2). Harvest-created gaps thus resulted in a 30% increase in the amount of forest under canopy gap conditions. On average, 1.24 (± 0.57) gaps were encountered per 100 m, with natural and harvest gaps encountered at a mean rate of 0.72 (± 0.12) gaps/100 m, and 0.41 (± 0.15) gaps/100 m, respectively.
Transects sampled, showing percent intersected by gap conditions, with respective contribution by natural and harvest-created gaps shown per transect and mean ± SE calculated across all transects.

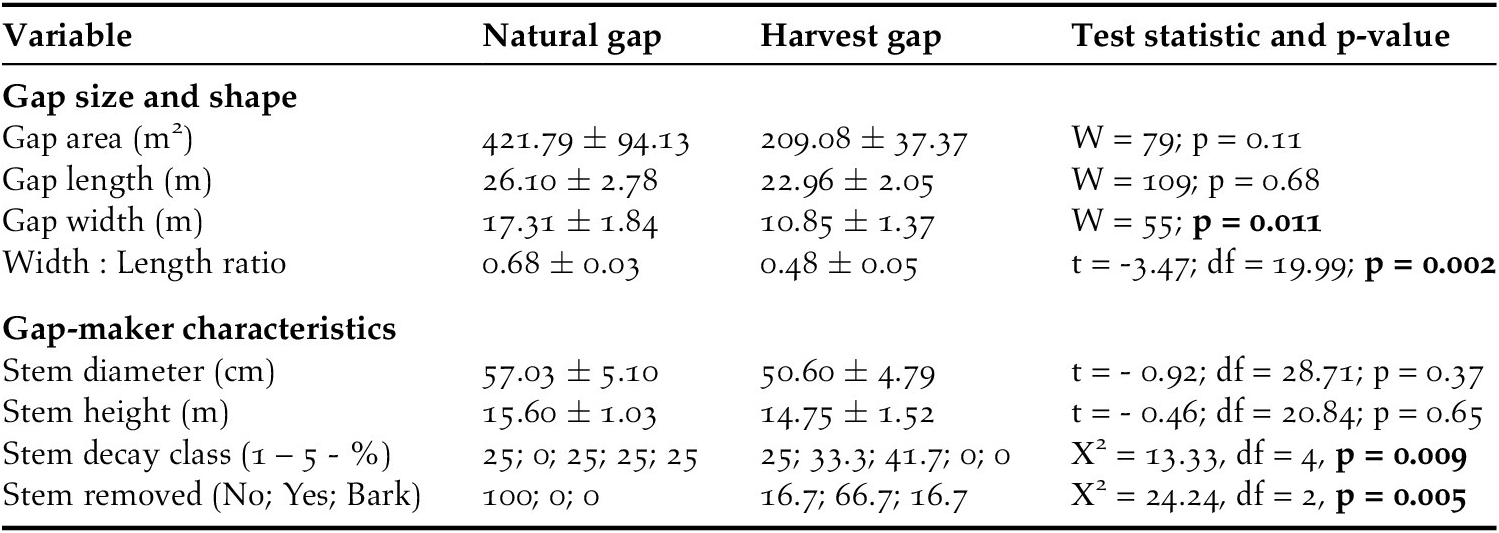
Gap characteristics were compared across harvest (n = 12) and natural (n = 20) gaps, with three harvest-gaps located outside of belt-transects added to increase the harvest-gap sample for this comparison. Natural- and harvest-created gaps did not differ in length or mean area, although natural gaps tended to be larger (Table 3). Gap width differed across gap types, with harvest gaps narrower than natural gaps. Consequently, width:length ratio differed across gap type, with natural gaps having a larger width: length ratio, indicating they were more circular, relative to harvest-gaps which tended to be more elliptical. Stem diameter and length of the gap-maker tree did not differ across gap types. However, there was a difference in the level of stem decay, with gap-maker stems in natural gaps showing a relatively even distribution of decay, while gap-maker stems in harvest-gaps were all classed within the first three stages of decay. Gap-maker stem removal differed across gap types, with no natural gap-maker stems being removed from the gap, while only two harvest-gaps had the full gap-maker stem left in the gap. The majority (n = 8) of harvest-gaps had the gap-maker stem removed, while only bark was removed, with the debarked stem left, in two harvest gaps, i.e. trees were felled to be stripped of medicinal bark, and not for use as timber. In cases where stems were recorded as removed from harvest gaps, it is worth noting that these removals were partial, i.e. while a majority of the main stem was removed, the rest of the felled tree biomass was left in the gap.
Comparison of natural (n = 20) and harvest (n = 12) gap characteristics recorded in Mqaba forest.

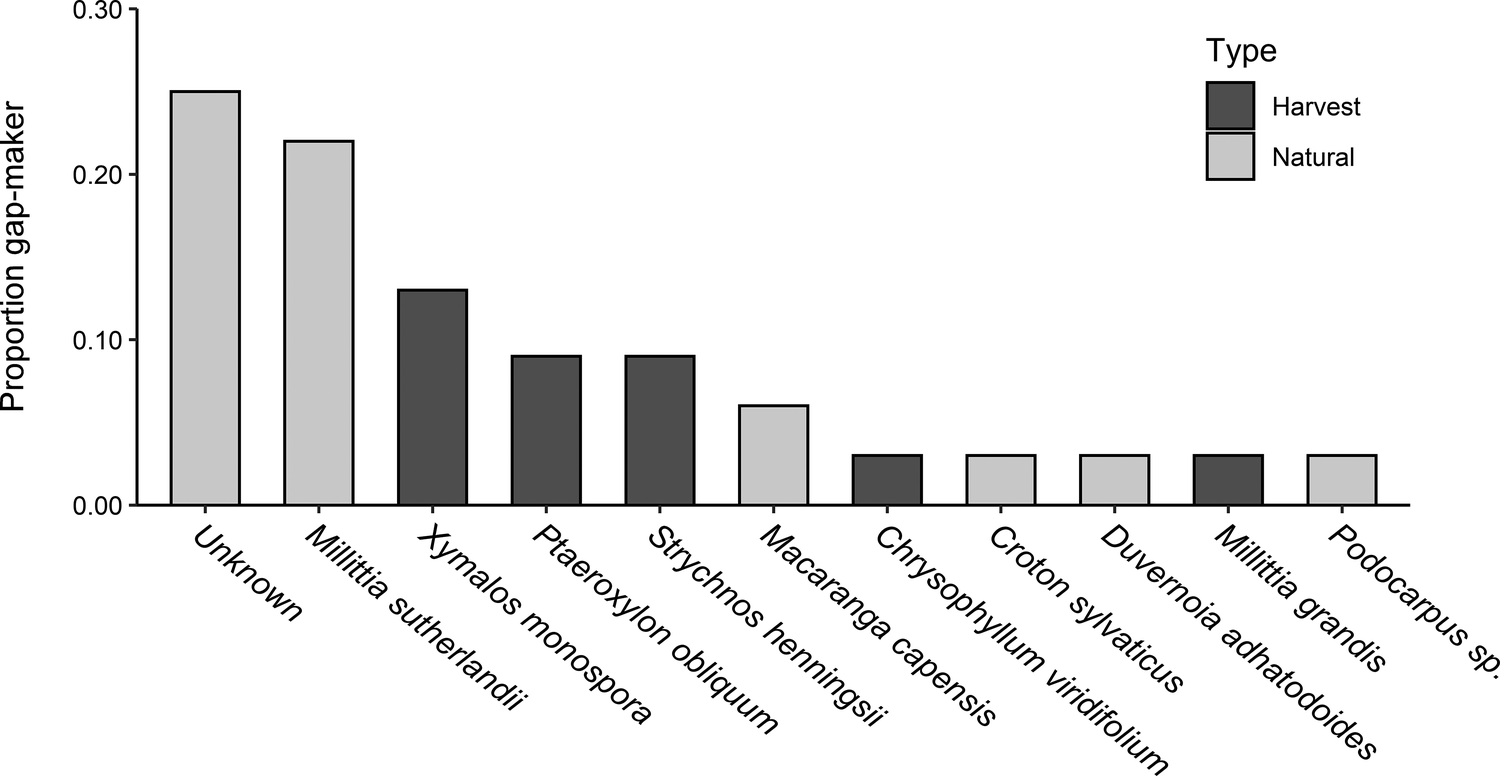
The majority (60%) of natural gap-maker species were identified, while 40% were unidentified due to advanced levels of stem decay, or multiple potential gap-makers being present in the gap. Of stems identified, Millitia sutherlandii was the most frequently observed natural gap-maker species (Figure 2). All harvest gap-maker species were identified, representing five species of which Xymalos monospora, Ptaeroxylon obliquum and Strychnos henningsii were the most frequently recorded. Chrysophyllum viridifolium was recorded once as a harvest gap-maker, with the felled individual stripped of its bark for medicinal use, while the rest of the tree was left in the gap.
Gap-maker species recorded in natural and harvest gaps.

Habitat structure across natural gaps, harvest gaps, and intact forest
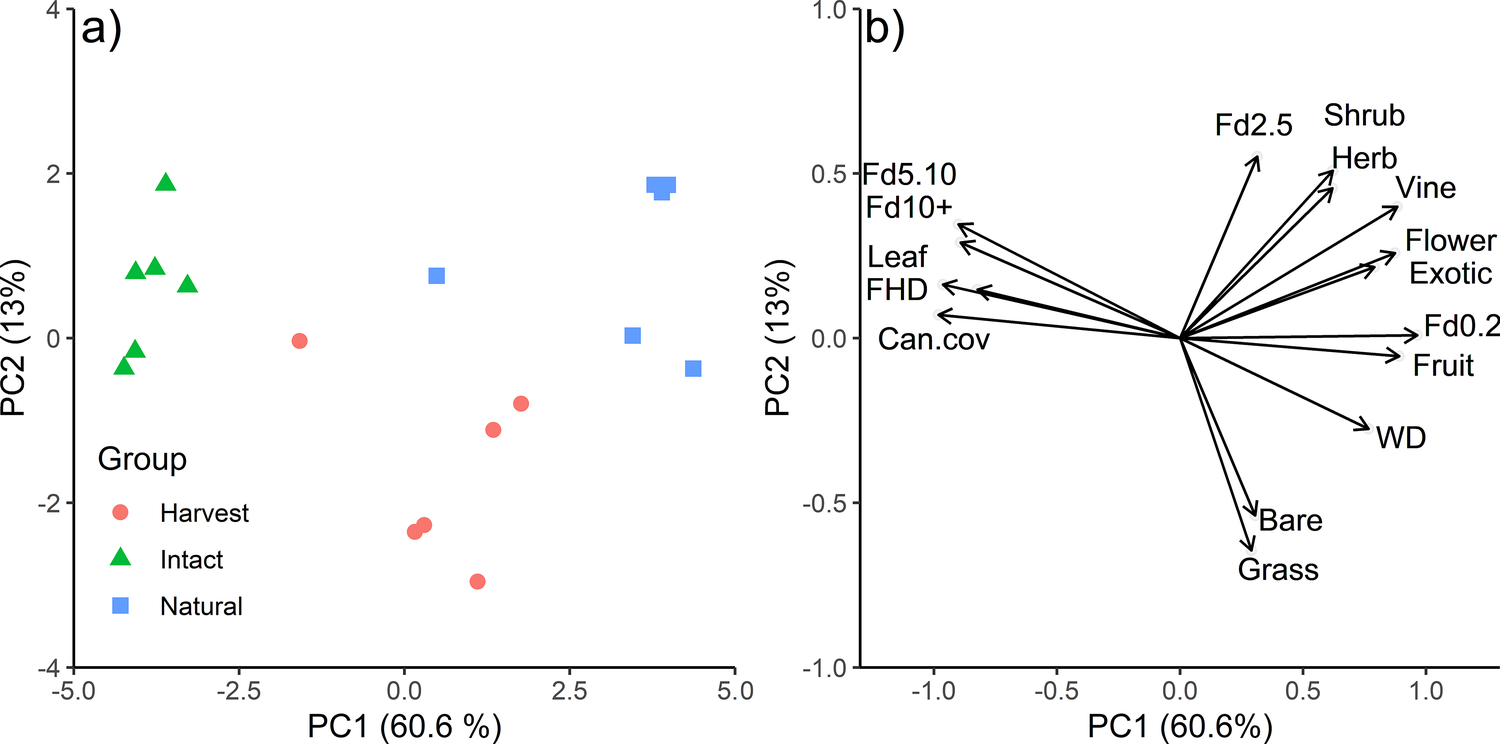
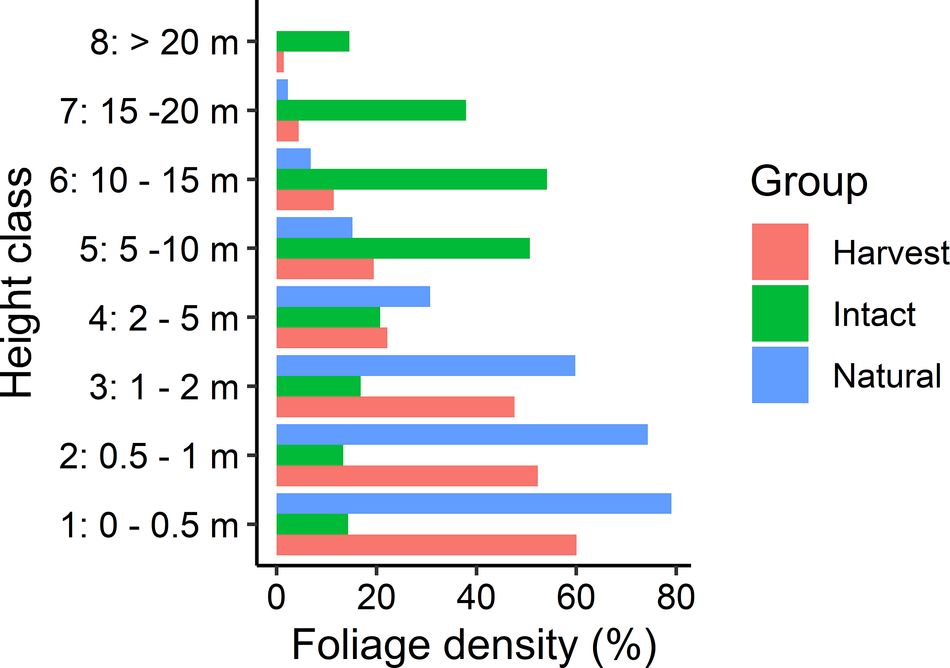
Together PC1–PC3 explained 80.7% of variation in habitat across intact, natural gaps and harvest gap sites. PC1 explained 60.6% of habitat variation and represented a habitat gradient from intact sites, characterised by high canopy cover, sub-canopy (5–10 m) and canopy foliage density (>10 m), leaf litter cover and foliage height diversity (FHD), to natural gap sites with high understory foliage density (0–2 m), understorey fruit and flower availability, vine cover, exotic species cover, woody debris cover, herb cover and shrub cover (Figure 3). PC2 explained 13% of habitat variation and represented a gradient from sites with abundant shrub and mid-story foliage density (2–5 m) to sites with high bare ground cover and grass cover. Intact and natural gap sites occupied non-overlapping ordination space separated along axis 1, while harvest gap sites were located between intact and natural gap sites. This indicated that harvest gaps had a habitat that was intermediate between intact and natural gaps. Specifically, herb, shrub, vine and bare ground cover, and FHDI did not differ across harvest gaps and intact sites (Figure S1). There was, however, a tendency for harvest gap sites to occur on the right of axis 1 (Figure 3), suggesting they had a habitat more closely associated with natural gaps than intact sites. Specifically, harvest gaps, like natural gaps, were characterised by greater woody debris cover, understory flower and fruit availability, exotic species cover, and understorey foliage density compared to intact sites (Figure 3; Figures S1 and S2). Furthermore, the vertical profile of harvest gaps reflected that of natural gaps, differing significantly from the vertical profile of intact sites (Figure 4).
Principal components analysis (PCA) showing a) clustering of sites and b) habitat variables driving this. Habitat abbreviations are: Flower = understory flower availability; Exotic = exotic species cover; Fruit = understory fruit availability; Herb = % herb cover; Vine = % vine cover; Fd0.2 = % foliage density below 2 m; WD = % woody debris cover; Shrub = % shrub cover; Grass = % grass cover; Bare = % bare ground cover; FHD = foliage height diversity index; Can.cov = canopy cover; Leaf = % leaf litter; Fd10+ = % foliage density above 10 m; Fd5.10 = % foliage density 5-10 m; Fd2.5 = % foliage density 2-5 m.

Vertical profile of foliage density compared across natural gaps, harvest gaps and intact forest.

Bird assemblages across natural gaps, harvest gaps and intact forest
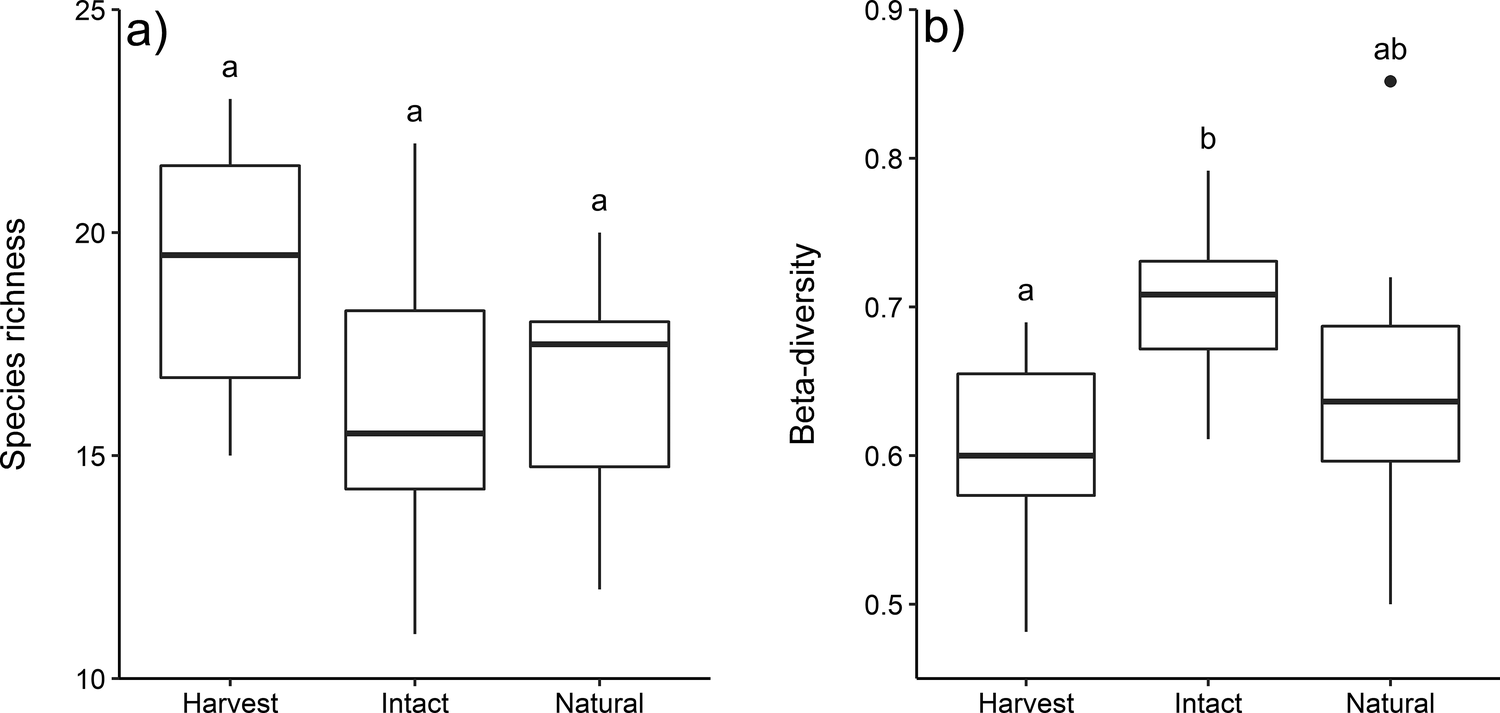
Overall, 48 species were recorded during bird surveys across all plots (17 ± 3 species per survey site; mean ± SD, range 11–23), with 41 species recorded in more than 5% of sites. Forty species were recorded at harvest gap sites (19 ± 3 species per survey site; mean ± SD, range 15–23), 35 species were recorded at natural gap sites (17 ± 3 species per survey site; mean ± SD, range 12–18), and 38 species were recorded at intact sites (16 ± 4 species per survey site; mean ± SD, range 11–22). Based on Chao2 estimator of true species richness, the sampling effort yielded 87%, 86% and 85% of the “true” species present at harvest gaps, natural gaps and intact sites respectively. Furthermore, species accumulation curves based on presence/absence data were largely asymptotic for all habitat groups, indicating that the sampling effort was sufficient to represent species richness present at each (Figure S1).
Variation in species richness across intact forest, harvest gaps and natural gaps was not significant (F-value = 1.44, df = 2, P = 0.27; Figure 5a). Conversely, within-group beta-diversity differed across groups (F-value = 7.94, df = 2, P = 0.001), with communities at intact sites showing higher beta-diversity compared to communities occurring at harvest gap sites, while beta-diversity at natural gap sites did not differ from that observed at intact sites or harvest gap sites (Figure 5b).
Comparison of a) species richness and b) within-group beta-diversity based on species presence/absence across harvest gaps, intact sites and natural gaps.

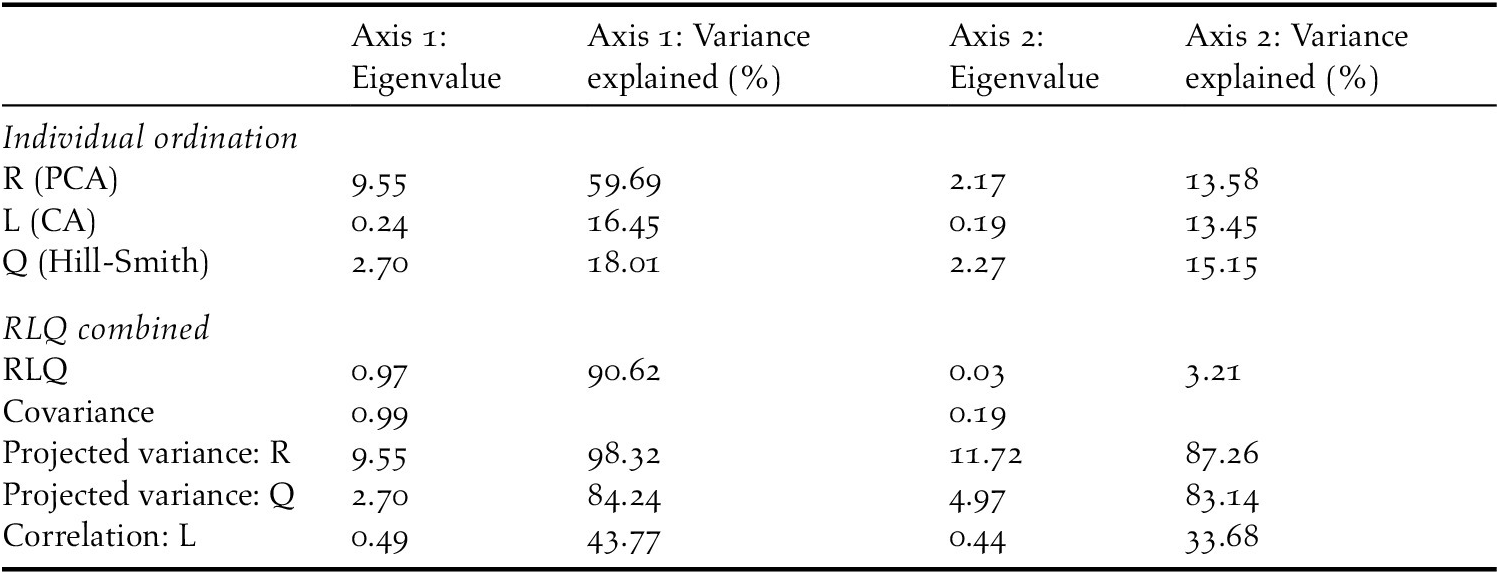
Differences in avian community composition between harvest gaps, natural gaps and intact sites were significant based on presence/absence data, i.e. Jaccard dissimilarity (ANOSIM, R = 0.22, P = 0.01). Furthermore, the RLQ analysis revealed a significant association between species traits and habitat conditions (permutation test P < 0.05), with the first two axes of the RLQ ordination explaining 93.83% of variation (Table 4). This represented 98.32% and 87.26% of the correlation expressed along the first two axes of the principal component analysis of the habitat variables (R); 84.24% and 83.14% of the correlation expressed in the Hill-Smith component analysis of species traits (Q); and 43.77% and 33.68% of the correlation expressed in the correspondence analysis of species presence (L). Thus, variation in species composition across habitats, as shown by the ANOSIM, was driven by variation in species responses to habitat conditions, mediated by their feeding and nesting traits.
Results of the RLQ analysis of correspondence and correlations between survey sites and bird species (L), environmental covariates (R) and the qualitative functional traits (Q) of the bird community.

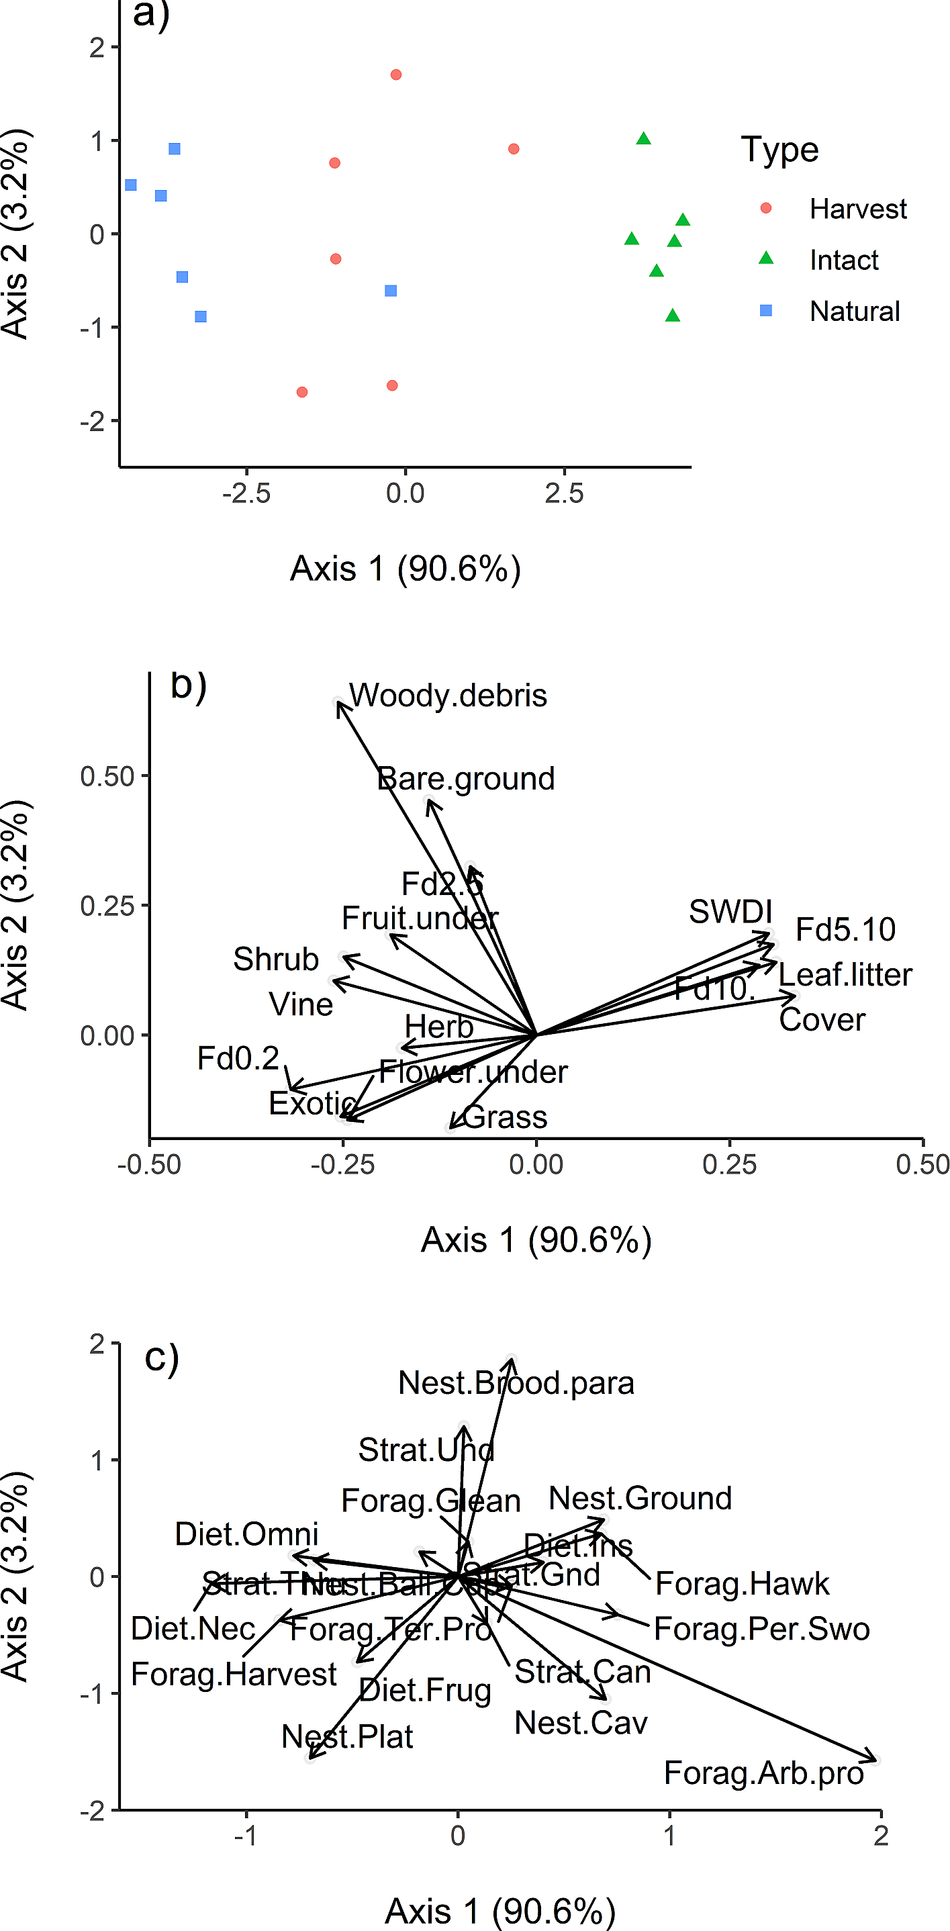
The RLQ analysis revealed a high degree of clustering among survey sites sampled within the same habitat type (i.e. intact, natural gap and harvest gap sites: Figure 6a), indicating that different habitat conditions contained species with similar traits. Specifically, the first RLQ axis, which accounted for 90.6% of variation, represented a gradient from intact sites to natural gap sites, with intact sites and gap sites (natural and harvest) occupying non-overlapping ordination space, while there was some level of overlap between harvest gap and natural gap sites. Again, harvest sites occupied ordination space between natural gaps and intact sites, indicating that they represented an intermediate state between the two, although they were more closely associated with natural gap sites, largely occurring on the left of axis 1, while intact sites clustered together on the right of axis 1. Intact sites were characterised by high canopy cover and foliage density above 5 m, leaf litter cover and high FHD (Figure 6b). Species traits associated with these conditions included cavity- and ground-nesters, insectivorous, species that forage by hawking, perch-and-swoop, arboreal probing and terrestrial probing, and species that forage on the ground and in the canopy (Figure 6c). Gap conditions were characterised by high shrub cover, vine cover, exotic cover, understorey foliage density, understorey fruit and flower availability and woody debris (Figure 6b). These habitat conditions were associated with ball/cup and platform nesters, omnivores, nectarivores and frugivores, and species that forage throughout the forest strata (Figure 6c).
a) Row scores of sites for the first two RLQ axes. Symbols indicate sites from the different habitat conditions sampled. RLQ scores of b) habitat characteristics and, c) species feeding and nesting traits driving the clustering shown in a). Similar positions of sites, habitat characteristics, and species traits relative to the origin in the three plots indicate close associations. Abbreviations for habitat variables are: Flower = understory flower availability; Exotic = exotic species cover; Fruit = understory fruit availability; Herb = % herb cover; Vine = % vine cover; Fd0.2 = % foliage density below 2 m; WD = % woody debris cover; Shrub = % shrub cover; Grass = % grass cover; Bare = % bare ground cover; FHD = foliage height diversity index; Can.cov = canopy cover; Leaf = % leaf litter; Fd10+ = % foliage density above 10 m; Fd5.10 = % foliage density 5-10 m; Fd2.5 = % foliage density 2-5 m. Abbreviations for species traits are shown in Table 1.

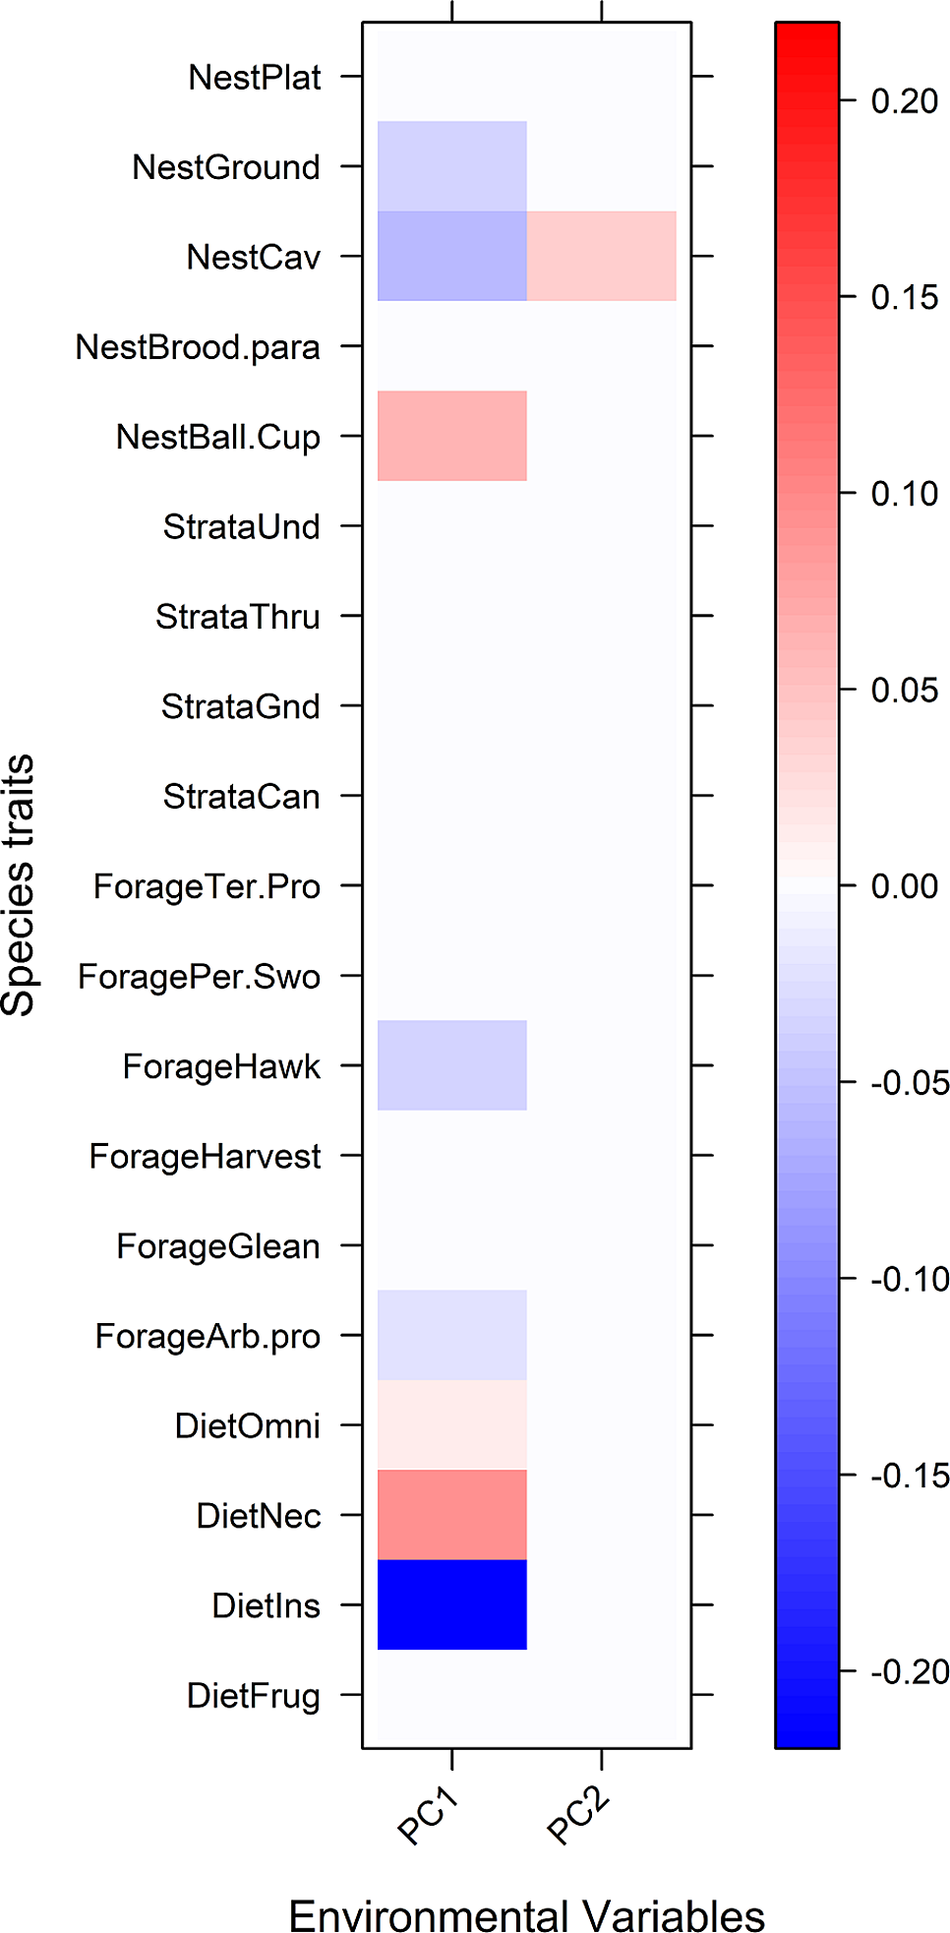
Fourth corner analysis revealed that insectivores, arboreal probers, hawking species, cavity-nesters and ground nesting species were negatively affected by the habitat gradient from intact to natural canopy gap conditions (Figure 7; Table S4). Conversely, nectarivores, omnivores and ball/cup nesters were positively affected by the transition from intact forest conditions to gap conditions.
Outcome of standardized interaction coefficient estimates for interaction term from fourth corner analysis testing the relationship between bird functional traits and habitat characteristics, based on species presence/absence. Traits shaded are those that improved the strength of the top model, with black indicating negative associations and grey indicating positive associations. Strengths of associations varied, with coefficient values presented in Table S4. Habitat variables PC1 and PC2 where derived from PCA of 16 measures habitat variables. PC1 and PC2 represented 60.6% and 13% of variation, respectively. Abbreviations for species traits are shown in Table 1.

Discussion
Findings of this study show that informal timber harvesting in a highly threatened indigenous forest type in South Africa increased the proportion of forest under canopy gap conditions considerably, with concomitant impacts on habitat structure, and bird assemblages at the forest-scale. Findings thus support those from other tropical (Levey Reference Levey1988, Sekercioglu Reference Sekercioglu2002, Wunderle et al. Reference Wunderle, Henriques and Willig2006) and temperate forests (Fuller Reference Fuller2000, Greenberg and Lanham Reference Greenberg and Lanham2001), which show that canopy gaps, whether created by selective harvesting or naturally, present distinct habitat patches within a matrix of intact forest, and that bird species distinguish between these. Importantly, harvest gaps in Mqaba represented an intermediate state between intact forest and natural gaps in terms of habitat and bird community structure, suggesting that timber harvest gaps retained some aspects of intact forest habitat and bird communities, while emulating some aspects of natural gap disturbances.
Nonetheless, harvest activities in Mqaba altered the natural disturbance regime by increasing the frequency of canopy gaps, and the proportion of forest under gap conditions by close to 30%. However, harvest gaps resembled natural gaps in terms of gap area. Similarly, Obiri (Reference Obiri2002) found no difference in gap size between canopy gaps created my informal timber harvesting and natural gaps in Pondoland scarp forests sampled in the Umzimvubu District of the Eastern Cape. By comparison, harvest gaps formed by legal commercial logging activities in forests of the southern Cape were found to be larger than natural gaps (Geldenhuys and Maliepaard Reference Geldenhuys and Maliepaard1983). This inconsistency across forest types is likely due to the variable nature of natural gap formation: in southern Cape forests natural gaps are predominantly the result of standing dead trees (i.e. snags), and are thus relatively small (Midgley et al. Reference Midgley, Cameron and Bond1995), compared to natural gaps in coastal scarp forests, which are caused predominantly by canopy tree windfalls due to strong coastal winds, and thus tend to be larger (Obiri and Lawes Reference Obiri and Lawes2004). Consequently, the nature of informal timber harvesting in Mqaba, i.e. single-tree selective harvesting, largely emulated the small-scale gap phase disturbances associated with natural gap dynamics in these forests (Obiri and Lawes Reference Obiri and Lawes2004). Given that gap area has been shown to be an important determinant of variation in plant (Shure et al. Reference Shure, Phillips and Bostick2006, Kern et al. Reference Kern, Montgomery, Reich and Strong2014) and bird responses (Jobes et al. Reference Jobes, Nol and Voigt2004, Forsman et al. Reference Forsman, Reunanen, Jokimäki and Mönkkönen2010) to canopy gaps, the lack of a significant difference in gap size across harvest and natural gaps in Mqaba may contribute to the observed close associations between natural gaps and harvest gaps in terms of habitat and bird community structure.
The dominance of a single species in driving natural gap formation has been reported by studies examining forest canopy gap dynamics globally (Clinton et al. Reference Clinton, Boring and Swank1993, Midgley et al. Reference Midgley, Cameron and Bond1995, Kneeshaw and Bergeron Reference Kneeshaw and Bergeron1998, Ott and Juday Reference Ott and Juday2002). In agreement with Obiri and Lawes (Reference Obiri and Lawes2004), Millettia sutherlandii was the most commonly identified gap-maker species in natural gaps in Mqaba, likely due to the high abundance of this species in Pondoland scarp forests (Obiri Reference Obiri2002). Unlike M. sutherlandii, which is a soft-wooded species, Xymalos monospora, Ptearoxylon obliquum, Strychnos henningsii and Millettia grandis were prevalent gap-makers of harvest gaps, selected by harvesters due their high quality, durable timber used for fence posts, building and crafts. Sustainable timber use practices in this region should thus focus on these species, some of which (e.g. M. grandis and S. henningsii) have already been exploited to the point where large, straight-stemmed individuals are rare (S. Tsini, pers. comm. May 2017).
The important contribution of natural canopy gap formation to the creation of a habitat mosaic in forests, and thus the maintenance of forest-scale habitat heterogeneity has been well documented in forests globally (Runkle Reference Runkle1981, Brokaw Reference Brokaw1985, Greenberg and Lanham Reference Greenberg and Lanham2001). Findings of this study show that canopy gaps formed by informal selective harvesting further contribute to forest-scale habitat heterogeneity by creating unique habitat conditions representative of an intermediate state between intact forest and natural gaps. Consequently, a habitat gradient was identified in Mqaba, ranging from intact forest characterised by closed-canopy conditions, to natural gaps characterised by open-canopy conditions, with harvest gaps occurring between the two. Consistent with findings from other tropical (Levey Reference Levey1988, Wunderle et al. Reference Wunderle, Henriques and Willig2006) and temperate forests (Blake and Hoppes Reference Blake and Hoppes1986, Martin and Karr Reference Martin and Karr1986), the abundance and distribution of food resources, in terms of understorey fruit and flower availability, was affected by canopy gap formation in Mqaba. Increased availability of fruit and flowers in canopy gaps has been attributed to increased primary productivity due to higher light levels (Shure et al. Reference Shure, Phillips and Bostick2006), and the colonisation of gaps by pioneer trees, shrubs, and herbs (Fimbel et al. Reference Fimbel, Grajal and Robinson2001). Specifically, the higher fruit availability in canopy gaps in Mqaba was largely driven by a greater abundance of two fruiting exotic species, Solanum mauritianum and Rubus flagellaris, frequently observed to colonise canopy gaps.
Variable habitat conditions in turn resulted in bird species with different feeding and nesting traits being associated with intact forest, harvest gaps and natural gaps, respectively. The influence of canopy gaps on bird communities has been largely attributed to increases in fruit, flower, and invertebrate food availability in gaps relative to surrounding intact forest (Blake and Hoppes Reference Blake and Hoppes1986, Martin and Karr Reference Martin and Karr1986, Wunderle et al. Reference Wunderle, Henriques and Willig2006). Alternatively, it has been proposed that modified habitat structure in canopy gaps may be a more important determinant of bird use of gaps than food availability (Bowen et al. Reference Bowen, Moorman and Kilgo2007). For example, dense understorey foliage in gaps may provide cover from predators, and increased opportunity for understorey-nesting species (Fimbel et al. Reference Fimbel, Grajal and Robinson2001). Findings of the current study indicate that habitat modification associated with the formation of canopy gaps affected traits relating to primary diet, foraging strategy and strata, and nesting, suggesting that bird responses to canopy gaps were mediated by changes in food availability and habitat structure. Specifically, the association between nectarivores, omnivores and frugivores with canopy gap conditions was likely driven by the increase in fruit and flower abundance in canopy gaps, favoured by several nectarivorous species, e.g. Greater Double-collared Sunbird Cinnyris afer, Southern Double-collared Sunbird C. chalybeus and Collared Sunbird Hedydipna collaris, and frugivorous species, e.g. Knysna Turaco Tauraco corythaix, African Olive Pigeon Columba arquatrix and African Green Pigeon Treron calvus. This is in agreement with several studies which have shown increases in nectarivorous, frugivorous and omnivorous species in response to timber harvesting, attributed to these species’ ability to take advantage of post-harvest increases in food availability (Johns Reference Johns1988, Thiollay Reference Thiollay1999, Wunderle et al. Reference Wunderle, Henriques and Willig2006, Cleary et al. Reference Cleary, Boyle, Setyawati, Anggraeni, Van Loon and Menken2007, Leaver et al. Reference Leaver, Mulvaney, Ehlers Smith, Ehler Smith and Cherry2019). On the other hand, the association between ball/cup nesting species and canopy gaps may be related to increases in understory foliage density in gaps, which may provide increased opportunity for nesting of this nature.
Conversely, insectivores were associated with intact forest sites, and negatively affected by the habitat gradient from intact to canopy gap conditions. While it is unclear whether this was related to changes in food availability or habitat structure, results suggest that it was more likely the latter, wherein habitat structure in canopy gaps presents unfavourable foraging conditions for many insectivorous species. This notion is supported by the fact that, first, increases in dead wood and understorey foliage density, particularly of saplings and shrubs, as observed in canopy gaps in Mqaba, has been shown to result in increased arthropod abundance (Harmon et al. Reference Harmon, Franklin, Swanson, Sollins, Gregory, Lattin, Anderson, Cline, Aumen, Sedell, Lienkaemper, Cromack and Cummins1986, Jokimäki et al. Reference Jokimäki, Huhta, Itämies and Rahko1998, Richards and Windsor Reference Richards and Windsor2007). Second, the association between intact forest sites and several foraging traits, namely, ground- and canopy-foraging, hawking, and terrestrial and arboreal probing, indicates that species with these feeding strategies require intact canopy conditions, and are thus likely hindered by the loss of canopy cover, and concurrent thickening of ground and understorey foliage in gaps, as shown by previous studies (Levey Reference Levey1988, Thiollay Reference Thiollay1999, Cleary et al. Reference Cleary, Boyle, Setyawati, Anggraeni, Van Loon and Menken2007). Conversely, understorey and gleaning species were found to be less sensitive to canopy gap conditions, suggesting that these species were better able to exploit potential increases in arthropod abundance, despite habitat modifications following canopy disturbance. The observed sensitivity of insectivores (particularly those that forage on the ground or in the canopy), ground-nesters, and cavity-nesters to canopy disturbance is in agreement several studies (Thiollay Reference Thiollay1999, Cleary et al. Reference Cleary, Boyle, Setyawati, Anggraeni, Van Loon and Menken2007, Politi et al. Reference Politi, Hunter and Rivera2012, Arcilla et al. Reference Arcilla, Holbech and O’Donnell2015, Leaver et al. Reference Leaver, Mulvaney, Ehlers Smith, Ehler Smith and Cherry2019), and indicates that species with these traits are at particular risk from habitat modification caused by unregulated timber harvesting activities in Mqaba. These include several endemic forest-specialists, such as Brown Scrub-robin Cercotrichas signata, Chorister Robin-chat Cossypha dichroa, and Knysna woodpecker Campethera notata, as well as species of conservation concern, such as the nationally endangered Spotted Ground-thrush Zoothera guttata.
While legislation in South Africa aims to develop indigenous forests for their sustainable use, and thus allows for timber harvesting permits to be applied for under the National Forest Act (1998), none have been issued in the region. Nonetheless, an informal market transporting locally harvested timber across the country’s border exists, with implications for forest biodiversity. The Department of Environment, Forestry and Fisheries (DEFF) is thus urged to develop and implement sustainable harvesting practices through the legislated approach of Participatory Forestry Management, such that local communities may benefit from forest resources without compromising forest biodiversity (NFA 1998). In this regard, findings of this study make an important contribution. Specifically, findings show that while the single-tree selection method currently used by informal harvesters largely mimics processes of natural canopy gap formation, and is thus likely to be the most sustainable method of harvesting, the frequency of canopy gap creation through harvesting needs to be regulated for two reasons: first, given that timber harvesting is species-specific, unregulated use may result in over-exploitation of certain species; second, habitat modification due to timber harvesting affects bird community structure based on species’ ecological traits, and is thus likely to negatively affect ecosystem functioning (Mason et al. Reference Mason, Mouillot, Lee and Wilson2005). Although this study lacks adequate replication, plots sampled were representative of the nature of informal timber harvesting currently occurring in the study region, and we thus expect that observed bird responses are representative of what would occur in other Pondoland scarp forests. Furthermore, although this study examined only bird responses to timber harvesting activities, birds are widely recognised as ecological indicators (Gregory and van Strien Reference Gregory and Strien2010), and it is thus likely that a measurable effect on birds, indicates that other taxa are affected. Lastly, the study lacked a temporal aspect with regards to the age of canopy gaps sampled, which has been shown to be an important determinant of bird responses (Jobes et al. Reference Jobes, Nol and Voigt2004). Further research is thus needed to gain insight into the recovery process, and length of effect time in terms of impacts of harvest gaps on forest habitat and bird communities. Despite these limitations, this study is, to the authors’ knowledge, the first to report on the implications of informal timber harvesting on forest habitat and bird communities in a nationally threatened, highly biodiverse forest type.
Supplementary Materials
To view supplementary material for this article, please visit http://dx.doi.org/10.1017/S0959270920000362.
Acknowledgements
The authors wish to thank Welile Kedama of the former Department of Agriculture, Forestry and Fisheries for granting permission to conduct research within state forests of the Eastern Cape, and to all Forestry personnel that assisted with fieldwork. C.J. Geldenhuys is thanked for meaningful discussion that helped guide this study. We are grateful to A. Wannenburgh for creating the study site map. This work was supported by the National Research Foundation (NRF), South Africa (FBIP 98871). The funders had no role in study design, data collection and analysis, decision to publish or preparation of the manuscript. Permission to conduct this study in state forests was approved by the former Department of Agriculture, Forestry and Fisheries (Licence no.: WIFM 04-2016) under section 23(1)(K) of the National Forest Act, 1998.