


Introduction
Increasingly negative glacier mass balances around the world have contributed significantly to global sea-level rise in recent decades (Reference Kaser, Cogley, Dyurgerov, Meier and OhmuraKaser and others, 2006; Reference Radic and HockRadic and Hock, 2011). Glaciers and ice caps in the Arctic play a major role in this process due to their large surface area (Reference GardnerGardner and others, 2011; Reference Jacob, Wahr, Pfeffer and SwensonJacob and others, 2012). Hence, glacier mass-balance records in this region are important for estimates of future global sea-level evolution.
Glaciers on Svalbard cover 34 560 km2 (Reference Moholdt, Nuth, Hagen and KohlerMoholdt and others, 2010a). In spite of this large ice-covered area, longterm mass-balance records from Svalbard are scarce and limited to a few small glaciers. The mass balance of Austre Br0ggerbreen and Midre Lovenbreen, both ∼-5-6km2 in size and located in the Ny-Alesund area, have been measured since 1967 and 1968, respectively (Reference Lefauconnier, Hagen, Orbask, Melvold and IsakssonLefauconnier and others, 1999). Shorter records exist for Kongsvegen (102 km2) in the Ny-Alesund area (Reference Lefauconnier, Hagen, Orbask, Melvold and IsakssonLefauconnier and others, 1999) since 1987 and Hansbreen (57km2) in the Hornsund area (Reference Jania, Mochnacki and GadekJania and others, 1996) since 1988. Reference Rasmussen and KohlerRasmussen and Kohler (2007) made a mass-balance reconstruction back to 1948 for Austre Br0ggerbreen, Midre Lovenbreen and Kongsvegen, and thus extended the mass-balance records of these glaciers by two decades. Reference Rye, Arnold, Willis and KohlerRye and others (2010) presented a reconstruction for Midre Lovenbreen that goes back to 1958. For the larger ice masses of the archipelago, however, neither measured nor reconstructed long-term mass-balance time series exist. A regularly maintained stake network for in situ measurements was installed on Austfonna ice cap in 2004 (Reference Moholdt, Hagen and Eiken Tand SchulerMoholdt and others, 2010b).
The aim of this study is to present a reconstructed, monthly, reference-surface climatic mass balance (CMB) time series for Vestfonna ice cap for the period 1979/80-2010/11. The employed mass-balance calculation scheme is based on the model presented by Reference MollerMoller and others (2011a). Daily ERA-Interim (European Centre for Medium-Range Weather Forecasts Interim Re-analysis) 2 m air-temperature data, total precipitation and total cloud cover are used as model input. Accumulation is calculated according to a surface-elevation-dependent scheme calibrated from extensive, in situ snow water equivalent (SWE) measurements (Reference MollerMoller and others, 2011b). Ablation modelling is done using a temperature-index model that includes net shortwave radiation (Reference Pellicciotti, Brock, Strasser, Burlando, Funk and CorripioPellicciotti and others, 2005). The calculation of glacier-wide net radiation differs from the original model. Reference MollerMoller and others (2011a) employed daily updated Terra MODIS (Moderate Resolution Imaging Spec-troradiometer) data for retrieval of surface albedo and cloud-cover fields. This study calculates mean monthly surface-albedo fields according to a statistical approach presented by Reference MollerMoller (2012). Cloud-cover forcing is included as a spatially constant daily value provided by the ERA-Interim dataset.
Study Area
The polythermal ice cap Vestfonna covers an area of 2340 km2 (Reference Braun Braun and others, 2011) of the island Nordaust-landet (northernmost Svalbard archipelago) at around 80° N (Fig. 1) extending between sea level and ∼630 m a.s.l. Along with the much larger neighbouring Austfonna and Icelandic VatnaJökull, it is among the largest ice masses of the European Arctic. The smoothly shaped, dome-like ice body features a main east-west oriented ridge with its highest point, Ahlmann Summit, located almost in the centre. Another main ridge extends northward from a secondary peak located in the eastern part of the ice cap.
Overview map of Vestfonna. Coordinates correspond to Universal Transverse Mercator (UTM) zone 34N. Contour spacing is 100m. The black circle marks the location of the AWS that is used as an in situ reference. Stake transects used for calibration and validation are indicated by dashed lines. The inset shows an overview map of the Svalbard archipelago. The black circle marks the ERA-Interim gridpoint.

Vestfonna is drained by several outlet glaciers, some of which are suggested to be surge-type (Reference Dowdeswell and CollinDowdeswell and Collin, 1990). The majority of the ice body drains to the south into Wahlenbergfjorden, forming five large (>5 km) calving fronts (Reference Strozzi, Kouraev, Wiesmann, Wegmuller, Sharov and WernerStrozzi and others, 2008), while a few smaller outlet glaciers drain to the northeast. The largest outlet glacier, however, is Franklinbreen whose two tongues calve into Lady Franklinfjorden, which is located on the northwestern side of the ice cap. Besides Franklinbreen, which shows signs of a surge, almost all other outlet glaciers show continuous retreat of the ice fronts, although rates are small in relation to the size of the glaciers (Reference Braun Braun and others, 2011).
Climate conditions around Svalbard are characterized by the counteracting influences of cold and warm air masses and ocean waters. The archipelago lies at the intersection of warm and humid air coming from the northern Atlantic Ocean and cold and dry Arctic air masses originating in even more northerly regions (Reference SvendsenSvendsen and others, 2002). The West Spitsbergen Current that forms the northernmost end of the North Atlantic Current transports comparably warm waters to the western coast of Svalbard (Reference Walczowski and PiechuraWalczowski and Piechura, 2011). The eastern parts of the archipelago are, in contrast, influenced by cold Arctic ocean currents (Reference LoengLoeng, 1991).
The resulting, maritime climate setting throughout the study area is characterized by a pronounced annual cycle of air temperatures and a fairly homogeneous seasonal precipitation distribution (Fig. 2). Mean monthly air temperatures at an automatic weather station (AWS) at 370 ma.s.l. on Vestfonna (Fig. 1) vary in the range —28 to +4°C. Daily variability is distinctly higher in winter than in summer, and short-term, warm periods with air temperatures above the melting point may even occur outside the summer season. Prevailing melting conditions generally occur in the period June to August (Reference MollerMoller and others, 2011a) and often extend over large parts of the ice cap (Reference Rotschky, Schuler, Haarpaintner, Kohler and IsakssonRotschky and others, 2011). Easterly weather systems coming from the Barents Sea region provide the major moisture source for precipitation (Reference Forland, Hanssen-Bauer and NordliForland and others, 1997). Precipitation sums on Vestfonna are thus expected to be smaller than on the larger and higher Austfonna, due to the leeside location of the ice cap (Reference PinglotPinglot and others, 1999). However, there is also evidence for a strong northwesterly influence on precipitation on Vestfonna (Reference Kasmacher and SchneiderKasmacher and Schneider, 2011). Temporal (i.e. inter-annual) variability of precipitation on Vestfonna was found to be high by Reference BeaudonBeaudon and others (2011) while spatial variability across the ice cap is mainly governed by surface elevation (Reference MollerMoller and others, 2011b). The mass-balance year of the ice cap generally lasts from September to August and features a 9 month accumulation and a 3 month ablation period (Reference MollerMoller and others, 2011a).
Time series of meteorological data for the mass-balance years 1979/80–2010/11. (a) The downscaled ERA-Interim air temperatures. (b) Rainfall and snowfall based on scaled ERA-Interim data. (c) The fraction of clear sky, representing the negative of ERA-Interim total cloud cover, displayed for clarity. All values are related to the terrain elevation of the AWS (370 m a.s.l.; Fig. 1) and are shown at daily resolution. Major ticks on the x-axis mark the beginning of each mass-balance year, i.e. 1 September. Minor ticks mark the beginning of each calendar year.

Data
The mass-balance reconstruction model requires terrain elevation and areal extent data of Vestfonna as a basis for all calculations. Daily air temperature, precipitation and cloud cover from the period September 1979 to August 2009 are used as input for running the mass-balance model. They are provided by ERA-Interim data (Reference DeeDee and others, 2011) for the gridpoint at 79.5° N, 19.5°E, which is located just south of the ice cap (Fig. 1). The albedo model requires additional, derived data of cumulative positive degree-days (PDD), cumulative snowfall and rain/snow ratio. Records from an AWS on the ice cap (Fig. 1) serve as an in situ reference during data preparation.
Surface data
The areal extent of Vestfonna was obtained by manually digitizing the glacier outline on a Terra ASTER (Advanced Spaceborne Thermal Emission and Reflection Radiometer) scene acquired on 17 August 2000 (EOS Data Gateway Granule ID: SC:ASTL1B 00-08-12:36:0010269001). Surface elevations with 250 m spatial resolution were derived on the basis of the ASTER global digital elevation model (GDEM). Isolated elevation outliers and small areas of data voids in the upper parts of the ice cap were replaced by interpolated values.
Air temperature
The original ERA-Interim air-temperature data were statistically downscaled using the variance-inflation method (Reference Karl, Wang, Schlesinger, Knight and PortmanKarl and others, 1990; Reference HuthHuth, 1999) to fit local conditions at the ice cap, following Reference MollerMoller and others (2011a). Variance inflation is a suitable tool for adjusting both annual cycle and daily variance of gridded air temperatures to local conditions (Reference Huth, Kysely and DubrovskyHuth and others, 2001). By applying this method we implicitly assume that air-temperature variability at Vestfonna is exclusively controlled by the synoptic situation (Reference Von Storchvon Storch, 1999). In situ reference for the downscaling was provided by a 2 year air-temperature record from the AWS (Fig. 1), covering the period May 2008 to April 2010. In order to account for the high intra-annual variability of air-temperature variance (Fig. 2), downscaling was done separately for each month, i ( i = 1,2, … , 12), according to a two-step approach, described by Reference Von Storchvon Storch (1999). In the first step, the original ERA-Interim data, TERA, i, were adjusted to local conditions at the ice cap according to the linear scaling function

Coefficients a1_12 and b1_12 (Table 1) were determined by Reference MollerMoller and others (2011a) using linear regression analysis between the original ERA-Interim data and the AWS records. In the second step of the downscaling procedure, the variance of  was increased to the one evident at the AWS site according to

Overview of coefficients used in data preparation and mass-balance modelling. All values except for e and f are taken from Reference MollerMoller and others (2011a)
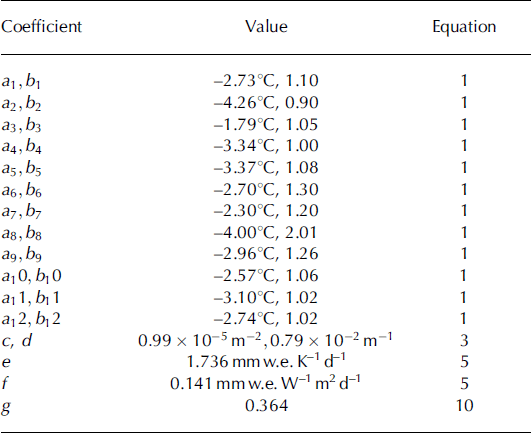
The monthly mean air temperature,  , was subtracted b out before increasing the variance and re-added afterwards. This procedure differs from the one outlined by Reference Von Storchvon Storch (1999). It was used in order to avoid the introduction of a bias for months with a nonzero mean air temperature. By doing this we deviate from the approach used by Reference MollerMoller and others (2011a) and were able to increase the accuracy of downscaled air temperatures. While Reference MollerMoller and others (2011a) achieved root-mean-square errors (rmse) of 0.7 K (June-August) and 1.2 K (September-May) compared to AWS records, here the rmse could be distinctly reduced to 0.4 K (June-August) and 0.3 K (September-May). To allow for the variability of air temperature with surface elevation, a constant linear lapse rate of —7.0 Kkmr1 is used (Reference MollerMoller and others, 2011a).
Precipitation
The original ERA-Interim precipitation data are distributed over the ice cap by quadratic scaling according to terrain elevation. The associated function of terrain elevation, z, was derived from an analysis of SWE measurements carried out across the ice cap in the years 2007-10 (Reference MollerMoller and others, 2011b) and given by Reference MollerMoller and others (2011a):

This scaling relationship assumes that precipitation is equal to the original ERA-Interim value at sea level and increases by up to more than nine times to the uppermost parts of the ice cap. Coefficients c and d are given in Table 1.
Derived meteorological quantities
For modelling of surface albedo three derived meteorological variables are needed (Reference MollerMoller, 2012), i.e. cumulative snowfall, cumulative PDD and the rain/snow ratio. They are incorporated at a monthly resolution and distributed over the icecap according to terrain elevation. Snowfall and PDD at a specific terrain elevation are summed over the course of each mass-balance year, starting in September, to yield the two variables cumulative snowfall and cumulative PDD.
The third variable, rain/snow ratio, is calculated as the ratio of the monthly sums of rain and snowfall at a specific surface elevation. However, the transition between rain and snow in the albedo model differs from the one in the mass-balance model. As the albedo model is designed as a minimal model, a fixed threshold of 0°C is used in order to avoid complex threshold calculations (Reference MollerMoller, 2012).
Model Description
The mass-balance reconstruction model calculates the CMB, i.e. the sum of surface accumulation, surface ablation and refreezing (Reference CogleyCogley and others, 2011), of Vestfonna for the period September 1979 to August 2009 at a daily resolution. Results are presented and discussed for monthly as well as annual resolution.
The modelling architecture is based on that of Reference MollerMoller and others (2011a) with several modifications. Accumulation is calculated from the scaled ERA-Interim precipitation data. Ablation is calculated using a temperature-index model that includes net shortwave radiation. Statistically downscaled ERA-Interim air-temperature data and modelled net shortwave radiation serve as input to the ablation model. Net shortwave radiation modelling requires surface albedo information that is provided by modelled albedo fields. Refreezing is incorporated using the Pmax approach (Reference ReehReeh, 1991).
Accumulation
The surface accumulation at terrain elevation z is calculated from the proportion of snowfall of the scaled ERA-Interim precipitation data (P(z), Eqn (3)). This proportion is calculated according to air temperature, TðzÞ, using a hyperbolic function suggested by Reference Moller, Schneider and KilianMoller and others (2007):

The function describes a continuous transition between snowfall and rain over the range 0-2°C.
Refreezing
Refreezing of meltwater within the snow- or firn pack of the glacier is accounted for using the Pmax approach introduced by Reference ReehReeh (1991). In contrast to the original model formulation of Reference MollerMoller and others (2011a) we set Pmax = 0.9 (instead of 0.6), according to the findings of a recent energy-partitioning study at Austfonna (Reference Ostby, Schuler, Hagen, Reijmer and HockØstby and others, 2013). This means that a maximum of 90% of winter accumulation can be retained by refreezing processes during the following ablation season. After this fraction is reached, any further meltwater production is assumed to result in runoff.
Ablation
The surface ablation at terrain elevation z is calculated using a temperature-index approach that includes net shortwave radiation (Reference Pellicciotti, Brock, Strasser, Burlando, Funk and CorripioPellicciotti and others, 2005):

Ablation occurs if air temperature is above 0°C. The parameters e and f (Table 1) were not adopted from the original model of Reference MollerMoller and others (2011a), but were recalibrated based on in situ stake measurements (Calibration and validation subsection below) in order to account for the updated refreezing formulation. RG is global radiation. Calculation of ablation requires the computation of glacier-wide fields of surface albedo a and global radiation.
Surface albedo
The surface-albedo fields of Vestfonna are modelled on a monthly basis. A daily updated calculation is not feasible, as frequent snowdrift disturbs local surface characteristics. Modelling is done using a statistical approach, especially designed and calibrated to cope with the conditions at Vestfonna (Reference MollerMoller, 2012). It calculates the mean altitudinal profile of monthly surface albedo according to

In this equation, Ө(z) is a sigmoid function of rain/snow ratio and ^(z) a linear function of cumulative snowfall and cumulative PDD. Ө(z) is calculated as

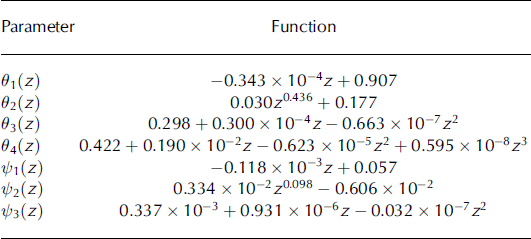
with Фrsr(z) being the rain/snow ratio at terrain elevation z. θ1−4 are empirical parameter functions that express variability of the parameters with terrain elevation, z (Table 2) ^(z) is calculated as

with Фcsf(z) and Фc_spdd(z) being cumulative snowfall and cumulative PDD. The empirical parameter functions, 1—3, also vary with terrain elevation, z (Table 2).
Parameter functions of the albedo model (Eqns (7) and (8)), according to Reference MollerMoller (2012)
Global radiation
Spatially distributed global radiation at the glacier surface is calculated as the sum of cloud-cover-reduced direct solar radiation, R S, and multiple scattering and reflection between glacier surface and cloud cover, RM (outlined in detail in Reference MollerMoller and others, 2011a). Direct solar radiation, RD, is calculated according to standard solar-geometry algorithms (Reference Bernhardt and PhilippsBernhardt and Philipps, 1958; Reference IqbalIqbal, 1984; Reference CorripioCorripio, 2003). The reduction due to cloud cover is achieved by using the Savinov-Angstrom formula (e.g. Reference KondratyevKondratyev, 1969):

ERA-Interim total cloud-cover data, CCERA, is taken as a spatially invariant quantity. The empirical coefficient, η′, is taken to be 0.58 which equals the value at 80° N (Reference Budyko and MillerBudyko and Miller, 1974). This means that a complete cloud cover reduces RD by 42%.
Multiple scattering and reflection is calculated as a fraction of R S according to an empirical relation that was calibrated for conditions at Vestfonna by Reference MollerMoller and others (2011a):

Coefficient g is given in Table 1, α is the surface-albedo field, SV is the spatially distributed sky-view factor and SVAWS (0.88) is the value of the sky-view factor at the AWS.
Calibration and validation
Model calibration was based on a set of 29 multi-year, repeat measurements at a mass-balance stake network in the northwestern part of Vestfonna (Fig. 1) that was also used by Reference MollerMoller and others (2011a). Calibration was done by running the entire CMB model with iterative changes of parameters e and f until a minimum rmse was reached.
The model is validated using three independent mass-balance datasets. A firn-core analysis of Reference BeaudonBeaudon and others (2011) provides a time series of annual mass balances for Ahlmann Summit that covers the period 1992-2009. Repeat stake measurements along the transect at the AWS (Fig. 1) that cover the period summer 2009 to summer 2011 and that were not included in the calibration procedure provide 14 seasonal and annual point balances from the ablation area. A comparison with modelling results of Reference GreuellGreuell and others (2007) is also used for model validation. Greuell and others calculated surface mass-balance anomalies for several glaciers on the Svalbard archipelago for the mass-balance years 1999/2000-2004/05 using a newly presented method based on MODIS albedo data. Among these glaciers is Frazerbreen, a southern outlet glacier of Vestfonna (Fig. 1). To facilitate the comparison, we also calculated anomalies of surface mass balance, i.e. CMB without accounting for refreezing, of Frazerbreen for this period from the model results of this study.
Validation results (Fig. 3) suggest a good model performance. The model reproduces the 38 independent mass-balance values of the three validation datasets reasonably well. Overall, an rmse of 0.18mw.e.a∼1 is obtained when weighting the individual deviations according to measurement-period lengths. Modelled balances account for 8 1 % of the variance of the mass balances used for validation. No apparent systematic over- or underestimations are noticeable (Fig. 3). Hence, the model proved able to provide an adequate reproduction of both the spatial and temporal variability of mass balance at the ice cap. The obtained rmse of the model validation is used as an error range when reporting annual balances in this study.
Modelling performance of the reconstruction model during calibration and validation. Calibration is based on stake measurements of Reference MollerMoller and others (2011a). Independent model validation is performed using firn-core data from Ahlmann Summit for the period 1992–2009 (Reference BeaudonBeaudon and others, 2011), new stake measurements that were not considered by Reference MollerMoller and others (2011a) and a comparison between anomalies of modelled annual surface mass balances of the years 1999/2000–2004/05 of Frazerbreen (Fig. 1) and balance anomalies obtained by Reference GreuellGreuell and others (2007).

Results
Results are presented and analysed by referring to the period 1979/80-2010/11 (32 years) and two shorter subsets of this period, i.e. 1989/99-2010/11 (22 years) and 1999/20002010/11 (12 years). This is done in order to obtain a better picture of both absolute mass-balance values and their temporal trends. The significance of these trends is calculated using the Mann-Kendall trend test (Reference Kendall and GibbonsKendall and Gibbons, 1990), that is based on an evaluation of the significance level of Kendall’s rank correlation coefficient, τ.
Reference MollerMoller and others (2011a) found September to be the start of the mass-balance year at Vestfonna and identified a characteristic duration of the ablation season from June to August. This finding also holds for the 32 year time series presented in this study (Fig. 4). Ablation indeed mostly lasts until September, but amounts in this month are small enough that accumulation predominates and the CMB becomes positive. Sporadically, minor ablation is still present in October. In December 2002 a small amount of melting even occurred in midwinter. Peak melting is regularly found either in July or sometimes in August. Accordingly, in this study we also calculate the winter balances over the period September-May and the summer balances over the period June-August.
Annual climatic mass-balance quantities for the period 1979/80-2010/11. The symbols show seasonal balances. The error bars represent the ±0.18 mw.e. modelling error derived from model validation. The bar chart shows annual accumulation, ablation and refreezing. Each mass-balance year lasts from 1 September to 31 August, winter balances cover September-May and summer balances June-August.

Results indicate a positive mean CMB rate of +0.09 ± 0.15 mw.e. a∼1 (mean ± one standard deviation) for Vestfonna over the period 1979/80-2010/11 (Fig. 4; Table 3). The mean winter balance rate amounts to +0.30 ± 0.08 m w.e. a∼1 while the summer balance rate shows a mean of —0.21 ± 0.12 mw.e.a-1. The high inter-annual fluctuations present within the time series of annual balances are governed by varying intensities of both ablation and accumulation seasons. While the influence of ablation becomes weaker over the study period, the influence of accumulation increases. The correlation of annual balance with annual ablation decreases over the three considered periods from r = 0.64 (1979/80-2010/11) to 0.59 (1989/992010/11 and 1999/2000-2010/11). The correlation with annual accumulation, in contrast, shows an increase with time from r = 0.63 (1979/80-2010/11) to 0.68 (1989/992010/11) and 0.70 (1999/2000-2010/11).
Characteristic mass-balance values at Vestfonna and their trends over three different periods. The 12 mass-balance quantities are given in m w.e., the climatic mass-balance gradient in m w.e. (100 m)–1 and the equilibrium-line altitude (ELA) in m a.s.l. All mean values are given with a ±1 standard deviation range. Trends are given per decade. Bold values indicate significance at the 90% level, underlined bold values significance at the 95% level
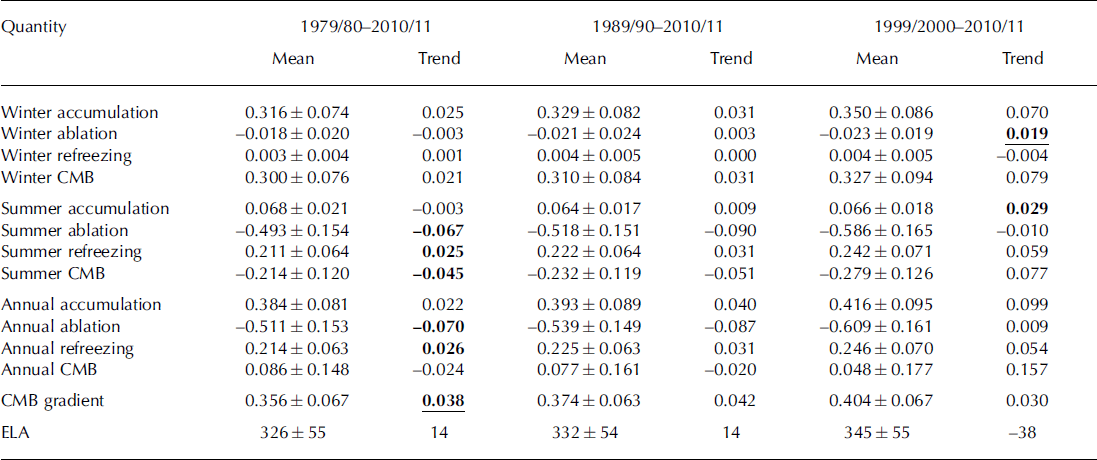
Refreezing is found to play a major role in mass conservation across the ice cap (Table 3). According to our estimates, ∼ 4 3% of the annual ablation (+0.21 ± 0.06 m w.e.) refreezes within the snow- or firn pack. However, as refreezing is controlled by an interplay of both winter accumulation and summer ablation, high interannual variability is present, and a range of +0.11 to +0.36 m w.e. is observed for individual mass-balance years.
The most positive mass-balance year is 1999/2000 (+0.34 ± 0.18 m w.e.; Fig. 4). It mainly results from a combination of very low annual ablation (—0.34 mw.e.) and above-average annual accumulation (+0.47 m w.e.). A very high refreezing fraction (62% of annual ablation) further boosts this positive coincidence. The most negative mass-balance year (2002/03, —0.25 ± 0.18 m w.e.; Fig. 4), in contrast, is the product of very low annual accumulation (+0.24mw.e.), well above-average annual ablation (—0.62 mw.e.) and the lowest refreezing fraction of the study period ( 2 1% of annual ablation).
Overall, the climatic mass-balance time series of Vest-fonna is predominantly characterized by positive annual balances; only the period 2001/02-2006/07 differs from this general picture and shows a considerably negative mean (Fig. 4). Accordingly, the mean annual CMB rate decreases towards less positive values when related to the later periods 1989/99-2010/11 and 1999/2000-2010/11 (Table 3). Despite this apparent decrease, no significant trends are evident for the considered periods.
The annual exchange shows an increase with time (Fig. 4). On one hand, this development is based on increasing winter accumulation and thus winter balance (Fig. 5; Table 3). On the other hand, the significant negative trends of annual and summer ablation, and thus summer balance over the study period, (Table 3) further contribute to this development.
Evolution of trends of the different mass-balance quantities over the period 1979/80–2010/11. Rows show accumulation, ablation, refreezing and CMB (from top to bottom). Columns show winter balance, summer balance and annual balance (from left to right). Each graph shows the mass-balance quantity (m w.e.; grey curve) and its running decadal trend (black curve). Each mass-balance year lasts from 1 September to 31 August, winter is from September until May and summer from June until August.

The increasing annual exchange results directly in an increased importance of refreezing. Potential refreezing increases with winter accumulation, and the more ablation occurs in the summer season the higher becomes the actual amount. Annual refreezing sums therefore exhibit a significant positive trend over the study period (Table 3).
The fact that summer melting significantly increases over the study period (Table 3; Fig. 5) suggests an associated extension of the characteristic 3 month ablation period. This is further supported by the slight but significant decrease in summer accumulation over the study period and the concurrent significant increase in winter ablation (Fig. 5; Table 3). Accordingly, the number of melt days at the AWS outside the ablation season increased from 2.1 ± 3 . 5 days per mass-balance year during the first half of the study period (1979/80-1994/95) to 3.0 ± 3.1 days during the second half of the study period (1995/96-2010/11). The high standard deviations indicate that this development is mainly based on isolated mass-balance years with large numbers of melt days outside the ablation seasons. However, the frequency of years where melt days outside the ablation season are present also increased from 9 to 14 from the first to the second half of the study period. This also indicates a slight lengthening of the ablation period in recent years.
The mean equilibrium-line altitude (ELA) at Vestfonna for the period 1979/80-2010/11 is calculated as 326 ± 55 m a.s.l. (mean ± one standard deviation; Table 3; Fig. 6). During this period, it shows a slight but significant increase with time. In the period 1989/90-2010/11 the mean is 6 m higher than for the entire study period, and the mean ELA for the mass-balance years after 1999/2000 is 19m higher (Table 3). However, the interannual variability of the ELA is very high (Fig. 6) and the observed changes lie within one standard deviation of the mean (±55 m). A reliable statement regarding the long-term trend of the ELA at Vestfonna can thus not be given.
Mean climatic mass-balance gradients and ELAsofthe mass-balance years 1979/80–2010/11 (black curves). Running decadal trends are shown as grey curves. Each mass-balance year lasts from 1 September to 31 August.
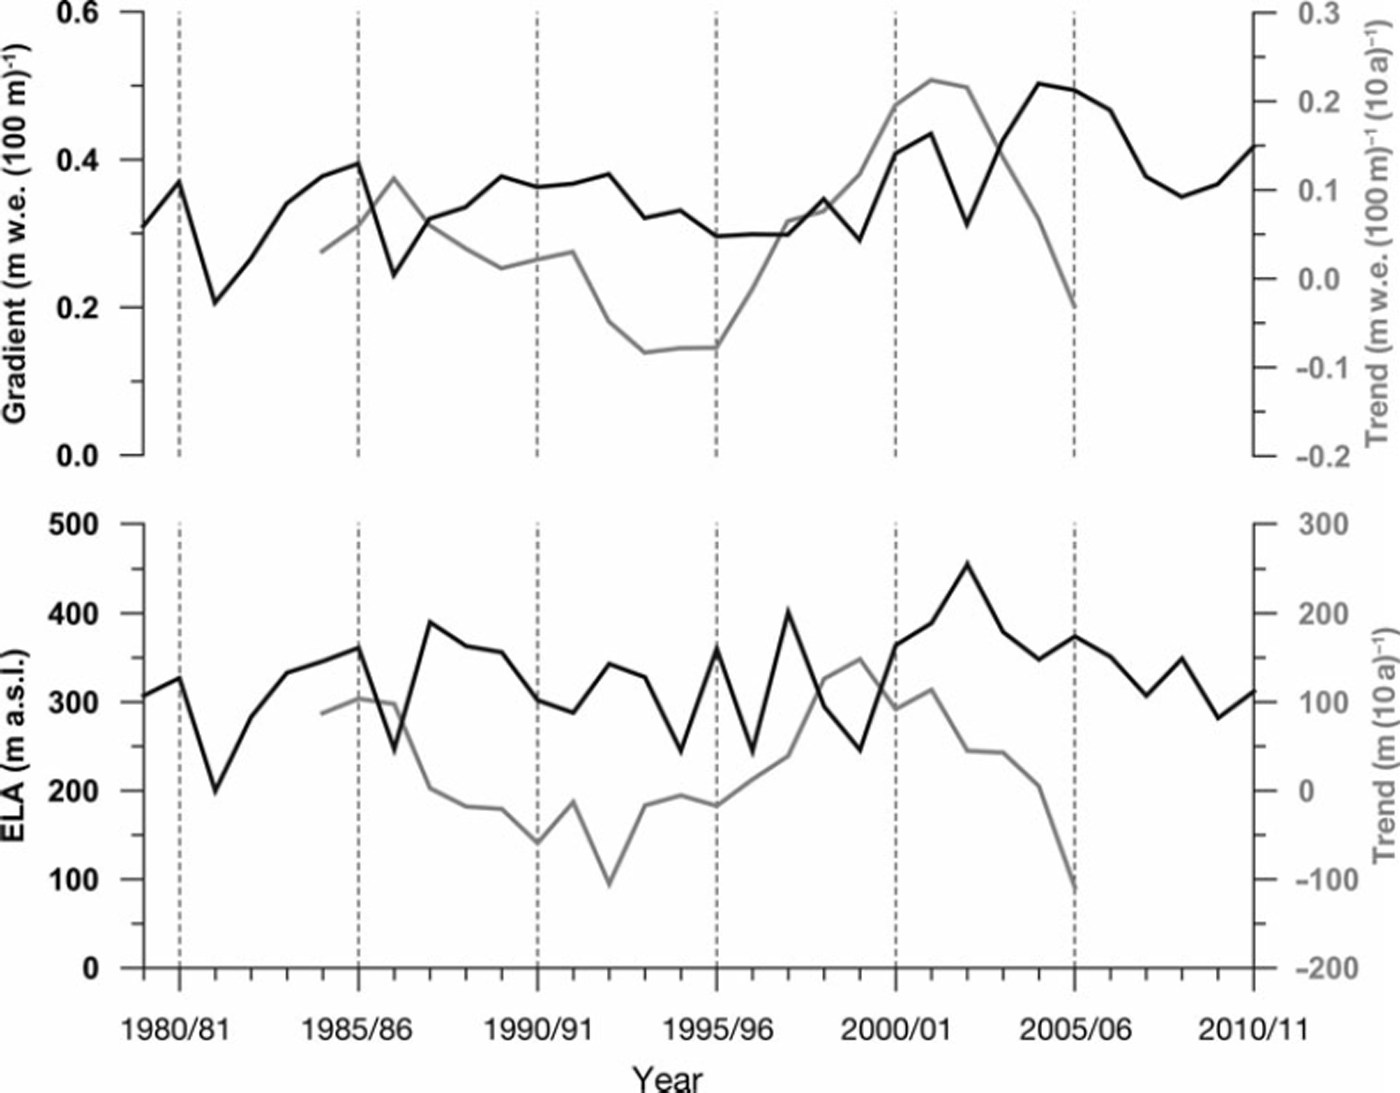
The annual climatic mass-balance gradients at Vestfonna for the period 1979/80-2010/11 show a mean of +0.36 ± 0.07 m w.e. (100 m)∼1 (Table 3) and increase significantly with time (Fig. 6; Table 3). The mean gradients increase to+0.37 ± 0.06 and +0.40 ± 0.07 m w.e. (100m)∼1 when referring to the periods 1989/90-2010/11 and 1999/ 2000-2010/11, respectively. Despite the inhomogeneous development of the trend over the study period (Fig. 6), these findings indicate a substantial steepening of the climatic mass-balance gradient at Vestfonna. This is also supported by the increasing annual exchange outlined above.
Discussion
The modelled CMB rates correspond well with the findings of other Vestfonna-related studies. Reference Nuth, Moholdt, Kohler, Hagen and KaabNuth and others (2010) calculated a mean geodetic mass-balance (GMB) rate for the ice cap of +0.05 ± 0.15 m w.e. a∼1 for the period 19902005 from a comparison of historical maps and Ice, Cloud and land Elevation Satellite (ICESat) data. The modelled annual CMB rates for this period show a mean of +0.07 ± 0.17 m w.e. a - 1 and are thus of similar magnitude. This consistency also holds for a more recent period studied by Reference Moholdt, Nuth, Hagen and KohlerMoholdt and others (2010a). They obtain mean winter and summer GMB rates for the periods 2004-08 and 200307 from repeat ICESat data (+0.30 ± 0.13 and —0.55+ 0.17m w.e. a - 1 ) . Our modelling reveals comparable mean winter and summer CMB rates of +0.38 ± 0.07 and —0.39 ± 0.06 m w.e. a - 1 for these periods. The frequent positive bias of CMB can be explained by the fact that GMB includes calving-flux-induced mass losses and is thus generally more negative. The larger bias observed in summer is consistent with this, as a seasonal speed-up of outlet glaciers is expected. Reference Dunse, Schuler, Hagen and ReijmerDunse and others (2012) documented such behaviour for two basins of neighbouring Austfonna.
This picture becomes less consistent when findings on recent area changes of Vestfonna (Reference Braun Braun and others, 2011) are included. Since 1976 the ice cap has shown a continuous retreat at most of its calving fronts, despite the apparently positive CMB. Long-term comparisons of modelled CMB to firn-core-derived balance rates also reveal discrepancies. Modelling results fit well with mass-balance rates derived from the Reference BeaudonBeaudon and others (2011) 19922009 firn core from Ahlmann Summit (+0.62 ± 0.16 compared to +0.52 ± 0.15 m w.e. a - 1 ; Fig. 3). However, a comparison with rates obtained from firn cores drilled at the eastern summit of the ice cap reveal a substantial but varying positive bias of modelled CMB rates. The firn core drilled by Reference BeaudonBeaudon and others (2011) in 2007 indicates a mean mass-balance rate of +0.25 ± 0.08 m w.e. a∼1 for the period 1993-2005, and a firn core drilled in 1995 at almost the same location indicates a rate of +0.41 ± 0.05 m w.e. a∼1 for the period 1986-94 (Reference PinglotPinglot and others, 1999). The modelled CMB rates for these periods amount to +0.62 ± 0.16 and +0.61 ± 0.09 m w.e. a - 1 , respectively.
This reveals a distinctly lower accumulation rate at the eastern summit of Vestfonna that is not reproduced by the model. Presumably this is because modelled accumulation depends on elevation only. Extensive snow-profile analysis from all over the ice cap, in contrast, revealed no significant zonal or meridional accumulation variability (Reference MollerMoller and others, 2011b). Taken together, this suggests that the accumulation-rate decline is largely limited to the area around the intersection of the two main ridges of Vestfonna. This, nevertheless, introduces an unquantifiable error into modelled CMB. However, this error can be assumed to be of minor magnitude, as the affected area around the eastern summit is small when compared to the entire extent of the ice cap.
The bias between modelled CMB rates and firn-core-derived mass-balance rates at the eastern summit, moreover, shows a variation with time. It increases from +0.20 m w.e. in the period 1986-94 to +0.37 m w.e. in the period 19932005. This substantial difference suggests a change in the accumulation pattern of Vestfonna in the early 1990s that is not reproduced by the model. Hence, the unquantifiable error of modelled CMB in the area around the eastern summit of the ice cap has to be assumed to show considerable variability with time.
When comparing our results for Vestfonna to contemporaneous Austfonna balances, distinct similarities arise. For the winter season 1998/99 Reference Pinglot, Hagen, Melvold, Eiken and VincentPinglot and others (2001) obtained specific mass balances of up to about +0.7 m w.e. for Austfonna, while the profile of winter CMB at Vestfonna shows values of up to about +0.4 m w.e. during this season. Considering the generally lower precipitation on Vestfonna (Reference PinglotPinglot and others, 1999) this can be seen as a reasonable agreement. The Etonbreen/Winsnesbreen basin in the western part of Austfonna shows increasing annual mass balances over the period spring 2004 to spring 2008 (Reference Moholdt, Hagen and Eiken Tand SchulerMoholdt and others, 2010b). This overall pattern is also found in the modelled CMB time series of Vestfonna (Fig. 4). The substantial decrease of the ELA that was monitored at Austfonna during this period (Reference Moholdt, Hagen and Eiken Tand SchulerMoholdt and others, 2010b) also appears at Vestfonna (Fig. 6). Correspondingly, the measured mean annual balance rate of the Etonbreen/Winsnesbreen basin (+0.02 m w.e. a- 1 ) agrees well with the modelled mean annual CMB rate of Vestfonna (+0.04 m w.e. a∼1).
In contrast to this, remarkable differences appear when comparing the mass-balance evolution of Vestfonna with available time series for other glaciers on Svalbard. Reference Rasmussen and KohlerRasmussen and Kohler (2007) presented reconstructed mass-balance time series for Austre Br0ggerbreen, Midre Lovenbreen and Kongsvegen. Their results reveal a distinctly higher annual exchange for these glaciers at the western coast of Spitsbergen. Vestfonna experiences only half of this. Moreover, the winter balance of these three glaciers shows a clear tendency towards less positive balances since the mid-1980s, i.e. a development in the opposite direction to that found for Vestfonna. The pattern of interannual winter-balance variability is also distinctly different at Vestfonna than at the glaciers in the Ny-Alesund area. The tendency towards more negative summer balances, however, is in line with our findings for Vestfonna. The interannual summer-balance pattern also shows considerable similarities with the one obtained for Vestfonna.
The results of this study compare well with the results of the CMB modelling study of Reference MollerMoller and others (2011a), despite the improved air-temperature downscaling and the increased Pmax value. However, as we recalibrated the model after changing its formulation, substantially different CMB values could only occur above the ELA during summer. The mean glacier-wide annual, summer and winter CMB rates that are obtained over the period studied by Reference MollerMoller and others (2011a), i.e. 2000/01-2008/09, are thus comparable in both studies. However, the mean CMB gradient calculated here for this period (+0.42m w.e. (100m)∼1) is distinctly steeper than the one calculated by Reference MollerMoller and others (2011a) (+0.31m w.e. (100 m)∼1). This reflects the interacting influences of increased refreezing amounts throughout the upper parts of the ice cap during summer and the increased ablation sums that occur as a result of the higher melt factors of the recalibrated CMB model.
Conclusions
The climatic mass balance of Vestfonna was reconstructed for the period 1979/80-2010/11. A positive mean CMB rate (+0.09 ± 0 .15 m w.e. a∼1) was obtained for the study period. It shows a slight but insignificant trend towards less positive values. In line with this, the mean ELA (326 ± 55 ma.s.l.) also shows a slight but insignificant increase over the study period. Annual ablation was found to be the main governing factor for the variability of annual balances in the beginning of the study period, while annual accumulation takes over towards the end. Moreover, there are indications of an extension of the characteristic 3 month ablation period.
Refreezing was found to be a major contributor to mass conservation. Using the Pmax approach it was estimated that, on average, ∼ 4 3% of annual ablation (+0.21 ± 0.06 m w.e.) refreezes within the snow or firnpack. The refreezing is approximately one-third of the mean annual accumulation, i.e. annual surface accumulation plus refreezing, of the ice cap, and despite its high interannual variability it shows a significant positive trend over the study period.
A tendency towards increased annual exchange was observed. This development results from a combination of the slight tendency towards more positive winter balances and the significant negative trend of summer balances that were revealed for Vestfonna. It can also be seen as the reason for the increasing refreezing sums and for the significant positive trend and thus the steepening of the climatic mass-balance gradient that is evident at the ice cap over the study period.
The mass-balance evolution at Vestfonna shows similarities to neighbouring Austfonna. Compared to glaciers in the Ny-Alesund area, similarities arise when looking at interannual variability or the tendency towards more negative summer balances during recent decades. However, regarding the evolution of winter balances, a development in the opposite direction is evident.
Acknowledgements
This study was funded by grant Nos. BR 2105/6-1, SCHE 750/ 3-1, SCHN 680/2-1 and SCHN680/2-2 of the German Research Foundation (DFG). Additional funding was provided by grant Nos. 03 F0623Aand 03 F0623B of the German Federal Ministry of Education and Research (BMBF). The ERA-Interim data used in this study are provided by the European Centre for Medium-Range Weather Forecasts (ECMWF). Comments by Thorben Dunse, Tomas Jóhannesson and an anonymous reviewer helped to improve the manuscript and are gratefully acknowledged. We thank Emilie Beaudon for providing annual-resolution firn-core data, and Veijo A. Pohjola for providing parts of the stake data.



