

Introduction
Given the widespread anthropogenic alteration of tropical biota, e.g., through fragmentation, selective logging, clear-cutting, wildfires and clearing for agriculture (Harris and Johnson, Reference Harris and Johnson2004; FAO, 2007; Morris, Reference Morris2010), understanding whether communities in human-modified sites can withstand habitat changes, i.e., remain unchanged (resistance) or recover to an approximation of a primary forest status (resilience), is a critical issue (Holling, Reference Holling1973; Isaac et al., Reference Isaac, Vanderwal, Johnson and Williams2009; Kohv et al., Reference Kohv, Zobel and Liira2013). Understanding resilience and resistance of biotic communities to habitat alteration is important for sustainable forest ecosystem management (Summerville, Reference Summerville2013), and these factors have been widely studied in arthropods from boreal and temperate systems (e.g., Dynesius et al., Reference Dynesius, Hylander and Nilsson2009; Summerville, Reference Summerville2013). Empirical data from tropical forests are scarce, especially for endophytic herbivorous insects.
Endophytic herbivores, e.g., gall-forming and leaf-mining insects, constitute important links in terrestrial food webs (Nyman et al., Reference Nyman, Bokma and Kopelke2007; Paniagua et al., Reference Paniagua, Medianero and Lewis2009), and thus their recovery is an indicator of ecosystem stability and function (Fernandes et al., Reference Fernandes, Almada and Carneiro2010). Information on the responses of tropical galling insects to habitat modification is very limited (but see Oyama et al. (Reference Oyama, Pérez-Pérez, Cuevas-Reyes and Luna-Reyes2003); Julião et al. (Reference Julião, Amaral, Fernandes and Oliveira2004); de Araújo et al. (Reference de Araújo, Julião, Ribeiro, Abraham Silva and Dos Santos2011); de Araújo and do Espírito-Santo Filho (Reference de Araújo and do Espírito-Santo Filho2012)). Because of their extreme specificity to their host plants (Cuevas-Reyes et al., Reference Cuevas-Reyes, Quesada, Hanson and Oyama2007), galling insects are highly sensitive to forest fragmentation (Oyama et al., Reference Oyama, Pérez-Pérez, Cuevas-Reyes and Luna-Reyes2003; Malinga et al., in press). The responses of different species to the same or different kinds and scales of habitat modification can vary widely depending on dispersal ability and degree of habitat specialization (Watt, Reference Watt1998; Ewers and Didham, Reference Ewers and Didham2006). Tropical galling insects may exhibit resilience to moderate modification of their habitats by rapidly colonizing regenerating sites (Oyama et al., Reference Oyama, Pérez-Pérez, Cuevas-Reyes and Luna-Reyes2003), especially when the recolonization source populations are close by. For example, in the Brazilian tropical savannah, galling insects have been found to rapidly colonize newly sprouted host plants in burned areas adjacent to unburned areas (Vieira et al., Reference Vieira, Andrade and Price1996).
Two approaches to measure resistance or resilience include the following: (i) evaluating the changes in species density and abundance, community structure or guild diversity of the same habitats over different time periods (Rydgren et al., Reference Rydgren, Økland and Hestmark2004; Summerville, Reference Summerville2013) and (ii) comparing different aged habitats (successional forests) with nearby primary forest sites (Dynesius et al., Reference Dynesius, Hylander and Nilsson2009). The latter approach assumes that the ecological conditions in the modified habitats are similar to those in the reference primary forests prior to the modification. Herein, we address the resilience of specialist galling insect communities associated with Neoboutonia macrocalyx trees to selective and clear-cut logging in Kibale National Park (KNP), Uganda. We use the term resilience (and not resistance) because most of the Neoboutonia trees were removed during harvesting. To test for evidence of resilience in communities of galling insects to habitat modification, we compared the species density, abundance and community structure (i.e., the relative proportion of gallers (Magurran, Reference Magurran2004)) of nine aged compartments with those in nearby primary forests as a reference state. We also examined whether the possible patterns in galler density were associated with plant vigour, measured as the mean leaf size (Santos et al., Reference Santos, Tavares and Almeida-Cortez2011; Malinga et al., Reference Malinga, Valtonen, Nyeko and Roininen2014a , Reference Malinga, Valtonen, Nyeko, Vesterinen and Roininen b ), resource availability, measured as the mean tree height (Neves et al., Reference Neves, Silva, Espírito-Santo and Fernandes2014), or density of host plant at the landscape level, measured as the distance to the nearest neighbouring host tree. We chose these factors because changes in resource quality have been used to explain ontogenic succession of galls (Fonseca et al., Reference Fonseca, Fleck and Fernandes2006). To our knowledge, this is the first study on the resilience of galling insect communities to logging in a tropical rainforest.
Specifically, we addressed the following questions: (i) Do species density, overall density and community structure of galling insects vary among forest successional stages and are there seasonal variations? (ii) Is there a directional successional trend for communities of gallers along the recovery gradient? (iii) Do the possible patterns in overall density of gallers correlate with the mean leaf size (vigour), mean tree height (resource availability) or density of host plants across the landscape? We considered resilience as a recovery in terms of species richness, abundance and community structure to primary forest status (Dynesius et al., Reference Dynesius, Hylander and Nilsson2009; Montúfar et al., Reference Montúfar, Anthelme, Pintaud and Balslev2011).
Methods
Study area
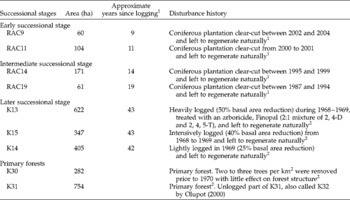
The study was carried out in a medium-altitude moist evergreen tropical forest of KNP, western Uganda (0°13′ to 0°41′N and 30°19′ to 30°32′E). KNP covers approximately 795 km2 and receives an average annual rainfall of 1698 mm (Chapman et al., Reference Chapman, Chapman, Jacob, Rothman, Omeja, Reyna-Hurtado, Hartter and Lawes2010), which predominantly falls during March–May and September–December (Chapman et al., Reference Chapman, Chapman, Struhsaker, Zanne, Clark and Poulsen2005). Dry season months are from June to August. The study sites were located in nine aged compartments (Fig. 1 and Table 1), representing a gradient of forest recovery as different successional stages, namely four regenerating aged forests of a former clear-cut of coniferous plantations (hereafter referred to as ‘regenerating age classes’, RAC9, RAC11, RAC14 and RAC19, name indicating the approximate years since clear-cut (Nyafwono et al., Reference Nyafwono, Valtonen, Nyeko and Roininen2014); three natural forest compartments selectively logged at different intensities between 1967 and 1969 (K13, K14 and K15); and two primary forest compartments (K30 and K31).
Location of study sites in Kibale National Park, Uganda. K30 and K31, natural intact primary forests; K14, natural forest lightly logged in 1969; K15, natural forest heavily logged between 1968 and 1969; K13, natural forest heavily logged and treated with arboricide between 1968 and 1969; and RAC9, RAC11, RAC14 and RAC19, regenerating former clear-cuts of coniferous plantation named following the approximate years since clear-cut (Nyafwono et al., Reference Nyafwono, Valtonen, Nyeko and Roininen2014). MUBFS (Makerere University Biological Field Station).

Characteristics of the nine forest successional stages studied at Kibale National Park

1 Data from Nyafwono et al. (Reference Nyafwono, Valtonen, Nyeko and Roininen2014).
2 Adapted from Kasenene (Reference Kasenene1987), Struhsaker (Reference Struhsaker1997) and Kasenene (Reference Kasenene2007).
Study system
Neoboutonia macrocalyx Pax (Euphorbiaceae) is a pioneer deciduous indigenous tree species growing in light gaps of swamps and valley bottoms in forest edges, regrowths, and partially logged, primary and secondary forests (Chapman et al., Reference Chapman, Chapman, Kaufman and Zanne1999) from 600 to 2500 m above sea level (Lovett, Reference Lovett1991; Fischer and Killmann, Reference Fischer and Killmann2008). Trees are 10–25-m tall (Lovett et al., Reference Lovett, Ruffo, Gereau and Taplin2006) with an open crown and a canopy width of 7–12 m (Hamilton, Reference Hamilton1991). Leaves are continuously produced year round (Kasenene and Roininen, Reference Kasenene and Roininen1999). Based on DNA barcoding identification, N. macrocalyx trees are attacked by five undescribed multivoltine galling insect species (four gall midges, Diptera: Cecidomyiidae; and one galling psyllid, Homoptera), which we named cecidomyiid leaf galler, cecidomyiid hairy stone galler, cecidomyiid shoot galler, cecidomyiid flower stalk galler and psyllid leaf galler (Skippari et al., Reference Skippari, Veteli, Kasenene, Niemelä and Roininen2009; Heimonen et al., Reference Heimonen, Lwanga, Mutanen, Nyman and Roininen2013; Malinga et al., Reference Malinga, Valtonen, Nyeko and Roininen2014a , Reference Malinga, Valtonen, Nyeko, Vesterinen and Roininen b , Reference Malinga, Valtonen, Vesterinen, Nyeko and Roininen c ). To our knowledge, these galler species are highly specialized and have been recorded only from N. macrocalyx trees (Skippari et al., Reference Skippari, Veteli, Kasenene, Niemelä and Roininen2009; Heimonen et al., Reference Heimonen, Lwanga, Mutanen, Nyman and Roininen2013; Malinga et al., Reference Malinga, Valtonen, Nyeko and Roininen2014a , Reference Malinga, Valtonen, Nyeko, Vesterinen and Roininen b ).
Sampling
A total of 10 Neoboutonia trees were randomly sampled in each successional stage. Six apical branches were randomly cut from each tree using a tree pruner. The branches were cut from the middle canopy, 6–14 m high. The total number of leaves, mid-rib lengths and number of different galler species per leaf were recorded in the branch samples. In the laboratory, all galls were dissected under a stereomicroscope to justify the species morphological identifications. All the N. macrocalyx trees in each compartment were also mapped, and using the latitude and longitude of each tree, the Euclidean distance between trees for each sampled tree was calculated, as an approximate indication of host density (or tree isolation) at a landscape scale.
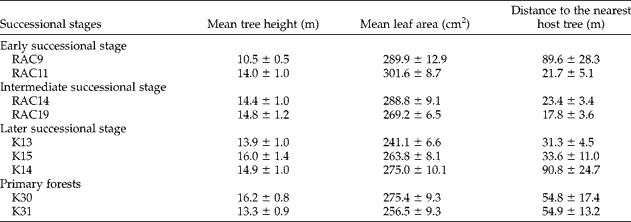
In addition, the stem diameter at breast height (DBH) and the height (m) of each sampled tree, using a 1-m marked pole, were estimated (Table 2). Estimates of mean tree height and host tree density were used as indicators of resource availability (Neves et al., Reference Neves, Silva, Espírito-Santo and Fernandes2014). Sampling was done twice during the wet season (December 2011 and March 2012) and thrice during the dry season (June, July and August 2012). The same trees were studied in all samplings, and each sampling lasted 2–3 weeks with successional stages visited in random order.
Mean tree height (as a measure of resource availability), mean leaf area (as a measure of resource quality) and the distance to the nearest host tree (as a measure of the density of host trees) in successional stages studied at Kibale National Park, Uganda+

+ Values are means ± SE.
Statistical analysis
The effects of successional stage, month (seasonality), and their interactions on the species density (Gotelli and Colwell, Reference Gotelli, Colwell, Magurran and McGill2011) and overall density of gallers in each sampled tree were determined using generalized linear model (GLM) with a negative binomial error distribution and a log link function (in IBM SPSS 19; IBM, Armonk, NY, USA). To take into account the variation due to host tree size, DBH was included as a covariate in each model (Cuevas-Reyes et al., Reference Cuevas-Reyes, Quesada and Oyama2006), but the effect of covariate was not significant in either model (P>0.05 in both cases). In case of significant GLM results, multiple pairwise contrasts were performed with sequential Bonferroni adjustments. Species density was measured as the number of species per tree (six branches pooled to tree level) and density of gallers as the total number of individuals per leaf area. Neoboutonia macrocalyx leaf area (Y) is dependent on the mid-rib length (x), and it was calculated with a regression model, Y= 5.03x+0.83x 2, R 2= 0.99, N= 159, P< 0.01 (according to Savilaakso et al., Reference Savilaakso, Koivisto, Veteli and Roininen2009).
To test for a directional pattern in the species density and overall density of gallers along the successional gradient, Spearman's rank correlations between the average values of either variable and the ‘order’ of the successional gradient were calculated (in IBM SPSS statistics, version 19). The following order of succession was used in the correlation analysis: RAC9 = 1, RAC11 = 2, RAC14 = 3, RAC19 = 4, K13 = 5, K15 = 6, K14 = 7, K30 and K31 = 8. The successional order was based on time since disturbance and also the seriousness of disturbance (Nyafwono et al., Reference Nyafwono, Valtonen, Nyeko and Roininen2014).
To assess differences in the community structure of galling insects among the successional stages, months or their interactions, permutational multivariate analysis of variance (PERMANOVA) run by PERMANOVA+ package for PRIMER-E, version 6 (Plymouth, UK) (Anderson et al., Reference Anderson, Gorley and Clarke2008), based on Bray–Curtis similarity, was used. P values were calculated from 999 permutations of residuals under a reduced model and type III sums of squares.
Similarities in the community structure of galling insects among the successional stages and months were illustrated using a non-metric multi-dimensional scaling (NMDS). NMDS was generated with the program PRIMER-E, version 6 (Clarke and Gorley, Reference Clarke and Gorley2006), from square-root transformed abundance data and a zero-adjusted Bray–Curtis similarity matrix between samples. For clarity, distances among the centroids of successional stages and months are shown. The full NMDS graph showing all the samples is shown in Supplementary material 1 (available online).
To test for a directional pattern in the community structure of galling insects along the successional gradient, a distance-based linear model (DISTLM, conducted with PRIMER-E, version 6) was fitted, where Bray–Curtis similarity matrix (response variable) was modelled with the ‘order’ of successional stages (RAC9 = 1, RAC11 = 2, RAC14 = 3, RAC19 = 4, K13 = 5, K15 = 6, K14 = 7, K30 and K31 = 8) as the predictor variable.
Finally, the associations between the mean leaf area (plant vigour), mean tree height and host tree density (resource availability) and the overall density of gallers of each successional stage were tested using Spearman's correlation tests.
Results
A total of 7219 individuals belonging to five galler species were recorded (see online Supplementary material 2). The most dominant species was the cecidomyiid leaf galler (58.4% of total counts), followed by the psyllid leaf galler (26.5%), and the least dominant species was the cecidomyiid shoot galler (0.2%).
Species density and abundance of gallers
The species density of gallers did not differ significantly among the successional stages (GLM: χ2= 3.3, P= 0.91, degrees of freedom (df) = 8, n= 450), but differed significantly among the months (χ2= 26.3, P< 0.001, df = 4, n= 450). The species density of gallers was significantly higher in December than in all other months (sequential Bonferroni tests: P< 0.05 for all months, except March, P= 0.11). The successional stage × month interaction had no significant effect on the species density of gallers (χ2= 10.3, P= 1.00, df = 32, n= 450).
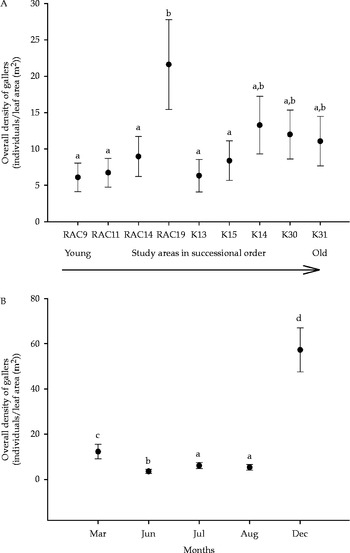
The overall density of gallers differed significantly among the successional stages (GLM: χ2= 71.1, P< 0.001, df = 8, n= 450). All regenerating forests had galler density similar to that in the primary forests (sequential Bonferroni tests: P>0.05; Fig. 2A). The oldest clear-cut forest (RAC19) had a significantly higher overall density of gallers than the two selectively logged forests (K13 and K15) and the younger clear-cut forests (RAC9, RAC11 and RAC14) (sequential Bonferroni tests: P< 0.05 for all tests; Fig. 2A). The overall density of gallers also differed significantly among the months (χ2= 482.8, P< 0.001, df = 4, n= 450), and all months differed significantly from each other with regard to the overall density of gallers (sequential Bonferroni tests: P< 0.05, for all multiple pairs for months), except July and August (P= 0.41; Fig. 2B). The successional stage × month interaction was not significant (χ2= 37.6, P= 0.23, df = 32, n= 450). There were no significant directional patterns in either species density or overall density of gallers along the successional gradient (Spearman's correlations: species density: r= − 0.49, P= 0.18; overall density: r= 0.56, P= 0.12).
Marginal means ( ± 95% confidence limits) of overall density (individuals/leaf area (m2)) of gallers per tree on Neoboutonia trees sampled from the nine forest successional stages (A) and the five study months (B). Different letters denote significant differences in means among the successional stages or months.

Community structure of gallers
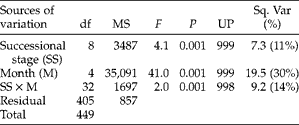
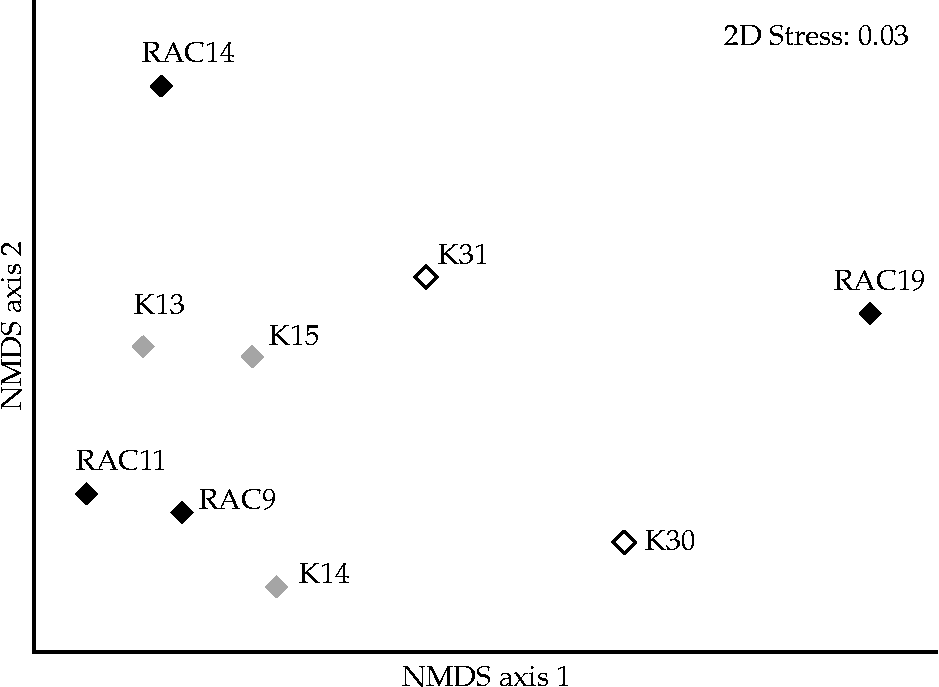
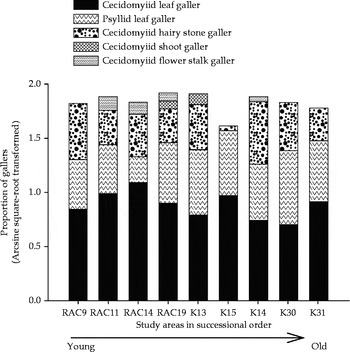
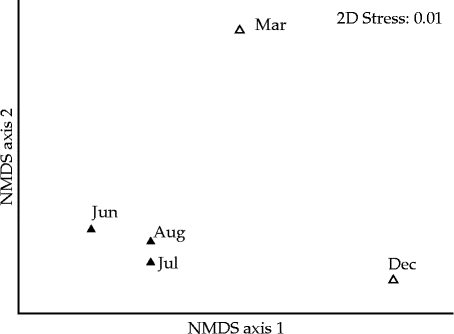
The community structure of gallers differed significantly among the nine forest successional stages and months (PERMANOVA; Table 3). In addition, there was a significant successional stage × month interaction, indicating that the patterns of differences in the successional stages differed in different months. Successional stage explained 11%, month 30% and their interaction 14% of the variations in the community structure of gallers (Table 3). There was no significant directional pattern in galler community structure along the successional gradient (DISTLM: pseudo-F= 2.64, P= 0.08). The NMDS ordination for successional stages revealed no clear directional trend of recovery in the community structure of gallers (Fig. 3). The variations in the proportions of galler species in different successional stages are shown in Fig. 4. The NMDS ordination on centroids for months (Fig. 5) showed a distinct seasonal grouping of months. All dry season months (June, July and August) grouped together, whereas the two wettest months were clearly separated from all dry season months and from each other.
Results of PERMANOVA for the effects of forest successional stage, month and their interactions on the community structure of gallers

df, degrees of freedom; MS, mean-squares; F, pseudo-F value; P, permutational P value; UP, unique permutations of the test statistic obtained under 999 permutations; Sq. Var, square-root of the component of variation (percentage of the total variation explained).
Non-metric multi-dimensional scaling (NMDS) ordination on centroids for similarities in the community structure of gallers among the successional stages: primary forests ( ), selectively logged forests (
 ) and regenerating former clear-cuts of coniferous forests (
 ).

Proportion of each galler species (arcsine square-root transformed) for each successional stage.

Non-metric multi-dimensional scaling (NMDS) ordination on centroids for similarities in the community structure of gallers among the months: dry season ( ) and wet season (
 ).

Influence of leaf size, mean tree height and host density on gallers
There was a significant positive correlation between the mean tree height and overall density of gallers (Spearman's correlation: r= 0.82, n= 9, P= 0.007). Neither the mean leaf area (r= − 0.18, n= 9, P= 0.64) nor the host tree density (r= − 0.05, n= 9, P= 0.90) correlated significantly with the overall density of gallers.
Discussion
Our results show that the species density and abundance of galling insects were highly resilient to habitat modification. No significant differences were found in the species density and overall density of gallers between the regenerating and primary forests 9–19 and 42–43 years after clear-cutting and selective logging, respectively. These findings corroborate those of a previous study carried out by Oyama et al. (Reference Oyama, Pérez-Pérez, Cuevas-Reyes and Luna-Reyes2003) indicating that pioneer host plants recolonizing disturbed tropical forest habitats are rapidly colonized by galling insect species. There might be several reasons for the high resilience of galling insects to forest harvesting in KNP. First, the presence of primary forests (source populations) at a comparatively short distance from the regenerating forests allowed for dispersion and recolonization to take place as soon as the host trees re-established (Bengtsson, Reference Bengtsson2002). Second, N. macrocalyx is an early successional tree that has a patchy spatial distribution (G.M. Malinga, personal observation). This ephemeral and unpredictable existence of the host tree may have caused efficient colonization of host-specific gallers on Neoboutonia trees. The good colonization ability of tropical insects during tropical forest regeneration has also been indicated in other groups (e.g., Quintero and Roslin, Reference Quintero and Roslin2005). Quintero and Roslin (Reference Quintero and Roslin2005) found that the abundance of Amazonian dung beetle assemblages recovered to a near original state following clear-cut, fragmentation and regrowth of secondary vegetation within 15 years. In contrast, a study on the same host plant system in Kibale forest found that the abundance of lepidopteran species in selectively logged areas was still significantly different from that in primary forests (Savilaakso et al., Reference Savilaakso, Koivisto, Veteli and Roininen2009). Thus, different insect taxa exhibit different resilience to habitat disturbances, indicating that they can have different colonization abilities, preference or performance on their host plants in different habitats.
Despite the high resilience of galler species to habitat modification, there was no predictable directional trend of recovery in the patterns of galler community structure along the successional gradient or no existence of ‘climax’ galler community (Fig. 3). These patterns might be explained by the following: (i) the stochastic processes of recolonization and extinction of successional stages (see Wool (Reference Wool2012)) due to the patchiness of Neoboutonia trees, (ii) differences in the species-specific traits, e.g., recolonization efficiency of individual species, which is strongly affected by dispersal abilities and the matrix vegetation, and (iii) differences in the degree of past disturbances among the successional stages. We confirm earlier results reported by Dunn (Reference Dunn2004) suggesting that whereas species richness of tropical fauna recovers relatively faster, a substantially longer period is required for the complete recovery of community composition.
Resource availability (mean tree height) was positively associated with the density of gallers. Many previous studies have found a significant relationship between host plant height and galling insect abundance (Caballero and Lorini, Reference Caballero and Lorini2000; de Araújo and Dos Santos, Reference de Araújo and Dos Santos2009; Neves et al., Reference Neves, Silva, Espírito-Santo and Fernandes2014). Taller host plants provide abundant resources (e.g., apical meristems) and are more evident in space to herbivorous insects (Neves et al., Reference Neves, Silva, Espírito-Santo and Fernandes2014). The lack of a positive correlation between mean leaf size and density of galling insects suggests that galling insects may be less responsive to the quality (vigour) of host plants at the landscape level. In our earlier study (Malinga et al., Reference Malinga, Valtonen, Nyeko, Vesterinen and Roininen2014b ), we found that within colonized host trees, cecidomyiid leaf gallers select vigorously growing modules (larger sized leaves) as predicted by the plant vigour hypothesis (Price, Reference Price1991). Also, the lack of correlation between galler density and host tree density is surprising. Previous studies (Caballero and Lorini, Reference Caballero and Lorini2000; Cuevas-Reyes et al., Reference Cuevas-Reyes, Quesada, Hanson, Dirzo and Oyama2004) and our earlier study (Malinga et al., Reference Malinga, Valtonen, Nyeko, Vesterinen and Roininen2014b ) have revealed that increasing host plant density increases the abundance or frequency of galling insects as predicted by the resource concentration hypothesis (sensu Root, Reference Root1973). The contrasting result of this study might be attributed to the presence of many non-host trees in the matrix vegetation that interfere either physically or chemically with how insect herbivores locate their host plants (associational resistance; Sholes (Reference Sholes2008)). Associational resistance has been shown to confound the effects of host density on insect herbivore abundance in previous studies (reviewed in Barbosa et al. (Reference Barbosa, Hines, Kaplan, Martinson, Szczepaniec and Szendrei2009)).
Lastly, remarkable seasonal variation was found in the species density, overall density and community structure of galling insects in all successional stages, with peak abundance being found in the wettest months. Our findings are consistent with those of several previous studies conducted in tropical forests on galling insects (Cuevas-Reyes et al., Reference Cuevas-Reyes, Quesada and Oyama2006; de Araújo and Dos Santos, Reference de Araújo and Dos Santos2009) and other tropical insect groups, e.g., butterflies and moths (Kasenene and Roininen, Reference Kasenene and Roininen1999; Skippari et al., Reference Skippari, Veteli, Kasenene, Niemelä and Roininen2009), butterflies (Valtonen et al., Reference Valtonen, Molleman, Chapman, Carey, Ayres and Roininen2013; Nyafwono et al., Reference Nyafwono, Valtonen, Nyeko and Roininen2014) and dung beetles (Nyeko, Reference Nyeko2009). The peak in galler abundance during the wet season might be related to synchronization with the period of host tree production of young leaves, which are less toxic, softer and highly nutritious (Coley, Reference Coley1983; Neves et al., Reference Neves, Silva, Espírito-Santo and Fernandes2014) and onto which females lay eggs. However, this is less likely given that N. macrocalyx trees produce leaves continuously throughout the year (Kasenene and Roininen, Reference Kasenene and Roininen1999). Another possible reason might be related to the seasonality of rainfall as found for other herbivores (Wolda, Reference Wolda1988; Kasenene and Roininen, Reference Kasenene and Roininen1999; Valtonen et al., Reference Valtonen, Molleman, Chapman, Carey, Ayres and Roininen2013), which influences the nutritional quality and quantity of resources (de Araújo and Dos Santos, Reference de Araújo and Dos Santos2009).
The results of the present study indicate that specialist galling insects on pioneer host plants are resilient to habitat disturbance due to logging, provided that primary or secondary forests with an established Neoboutonia population (source populations) are sufficiently close by. The results also indicate that seasonal variations strongly affect galler communities, with peak abundance in the wettest months. These findings highlight the need to include recovering tropical forests into galling insect biodiversity management and conservation priority plans.
Supplementary material
To view supplementary material for this article, please visit http://dx.doi.org/10.1017/S1742758414000460
Acknowledgements
The authors thank the Finnish Academy of Sciences (SA 138899 to HR) for funding this research. Research permission was granted by the Office of the Ugandan President, the Uganda National Council of Science and Technology, and the Uganda Wildlife Authority. They also thank J. Koojo, L. Balyega and I. Mwesigwe for their assistance in data collection.