Introduction
Due to widespread, decades-long reliance on glyphosate for weed control, 47 weed species, including goosegrass [Eleusine indica (L.) Gaertn.], have evolved resistance (Heap Reference Heap2019). Clarifying the mechanism of resistance in glyphosate-resistant (GR) weeds is important for selecting strategies to manage them (Heap and Duke Reference Heap and Duke2018). Glyphosate is a nonselective herbicide that is used worldwide (Duke and Powles Reference Duke and Powles2008). This herbicide competitively inhibits the enzyme 5-enolpyruvylshikimate-3-phosphate synthase (EPSPS; E.C. 2.5.1.19) in the shikimate pathway, leading to plant death due to prevention of formation of the aromatic amino acids tyrosine, phenoalanine, and tryptophan (Steinrücken and Amrhein Reference Steinrücken and Amrhein1980). There are two types of glyphosate-resistance mechanisms reported in weed species, target and non–target site based. The amino acid mutations in the conserved domains of EPSPS or amplification of the EPSPS gene are the common target-site mechanisms conferring glyphosate resistance in weeds (Baerson et al. Reference Baerson, Rodriguez, Tran, Feng, Biest and Dill2002; Gaines et al. Reference Gaines, Zhang, Wang, Bukun, Chisholm, Shaner, Nissen, Patzoldt, Tranel and Culpepper2010; Li et al. Reference Li, Peng, Han, Nyporko, Kulynych, Yu and Powles2018; Ngo et al. Reference Ngo, Malone, Boutsalis, Gill and Preston2018; Perotti et al. Reference Perotti, Larran, Palmieri, Martinatto, Alvarez, Tuesca and Permingeat2019; Yu et al. Reference Yu, Jalaludin, Han, Chen, Sammons and Powles2015). Most frequently, GR E. indica is reported to contain target-site mutations at amino acid residues 102 or 106 (Chen et al. Reference Chen, Huang, Zhang, Wei, Huang, Chen and Wang2015b; Takano et al. Reference Takano, Mendes, Scoz, Ovejero, Constantin, Gaines, Westra, Dayan and Oliveira2019). The first double mutation identified in EPSPS was in a E. indica population from Malaysia (Yu et al. Reference Yu, Jalaludin, Han, Chen, Sammons and Powles2015). Transposable elements are reportedly related to EPSPS amplification in Palmer amaranth (Amaranthus palmeri S. Watson) (Gaines et al. Reference Gaines, Wright, Molin, Lorentz, Riggins, Tranel, Beffa, Westra and Powles2013). In addition, EPSPS amplification via unequal crossover was observed in GR kochia [Bassia scoparia (L.) A. J. Scott] (Jugulam et al. Reference Jugulam, Niehues, Godar, Koo, Danilova, Friebe, Sehgal, Varanasi, Wiersma and Westra2014). Furthermore, some studies found that amplified copies of EPSPS in the GR A. palmeri are present in the form of extrachromosomal circular DNA molecules with different conformations that possess the ability to transmit to the next generation (Koo et al. Reference Koo, Molin, Saski, Jiang, Putta, Jugulam, Friebe and Gill2018). Another kind of glyphosate-resistance mechanism that has gained increased interest in recent years is non–target site based, conferred by increased metabolism, reduced translocation or uptake, or enhanced vacuolar sequestration of glyphosate (Heap and Duke Reference Heap and Duke2018; Moretti et al. Reference Moretti, Van Horn, Robertson, Segobye, Weller, Young, Johnson, Douglas Sammons, Wang and Ge2018; Van Horn et al. Reference Van Horn, Moretti, Robertson, Segobye, Weller, Young, Johnson, Schulz, Green and Jeffery2018).
Eleusine indica is an annual grass that is widespread in temperate and tropical regions and that has been recorded as one of the world’s most troublesome weeds (Holm et al. Reference Holm, Plucknett, Pancho and Herberger1977). In China, this weed is widely distributed in orchards, vegetable gardens, and some general field crops such as corn (Zea mays L.), soybean [Glycine max (L.) Merr.], and cotton (Gossypium hirsutum L.) (Yang et al. Reference Yang, Tian, Feng and Yue2012; Zhang Reference Zhang2003). The strong competitive and reproductive ability of this weed could lead to yield reduction (20% to 50%) in the affected crops (Holm et al. Reference Holm, Plucknett, Pancho and Herberger1977; Ma et al. Reference Ma, Wu, Jiang and Ma2015). Herbicide application has made control of E. indica more effective and efficient. However, evolved herbicide resistance has occurred in E. indica from China, especially in response to the herbicide glyphosate (Zhu et al. Reference Zhu, Wang, DiTommaso, Zhang, Zheng, Liang, Islam, Yang, Chen and Zhou2018). Many studies have reported that GR E. indica populations exist in orchards and have spread around the south of China (Chen et al. Reference Chen, Huang, Wei, Zhang and Huang2015a; Zhang et al. Reference Zhang, Feng, He, Yang, Chen and Tian2015). In addition, some populations have evolved multiple resistance to paraquat, glyphosate, and glufosinate (Hu et al. Reference Hu, Dong, Shen, Liu, Wei and Chen2018).
Single or double mutations in EPSPS at positions 102 and 106 and EPSPS amplification are common mechanisms for increasing E. indica in China (Chen et al. Reference Chen, Huang, Zhang, Wei, Huang, Chen and Wang2015b; Zhang et al. Reference Zhang, Feng, He, Yang, Chen and Tian2015). In previous research, a target site mutation–based resistance mechanism was confirmed when Escherichia coli containing the mutated EPSPS gene was shown to be tolerant to glyphosate (Chen et al. Reference Chen, Huang, Zhang, Wei, Huang, Chen and Wang2015b). In addition, the overexpression of the EPSPS gene in E. indica has been confirmed (Chen et al. Reference Chen, Huang, Zhang, Wei, Huang, Chen and Wang2015b). In this study, we examined glyphosate-resistance levels in E. indica populations collected from cotton fields in China. Potential mechanisms of resistance were also investigated. In addition, differences in the distribution of EPSPS genes in the chromosome between the GR and glyphosate-susceptible (GS) plants were determined.
Materials and Methods
Detection of Glyphosate-Resistance Levels
Seeds of five putative GR E. indica populations (HBQZ, 36°47.043′N, 115°0.105′E; HBWX, 36°58.993′N, 115°17.628′E; HNXX, 35°12.52′N, 113°48.942′E; AHCZ, 30°27.095′N, 117°1.185′E; AHAQ, 30°7.168′N, 116°47.345′E) were collected from cotton fields in Hebei, Henan, and Anhui provinces during 2015. Glyphosate was selected to control weeds in these cotton fields before the cotton was sown or tall enough and was used for this crop in these fields for at least 5 yr. The seeds of two known susceptible populations (SDQZ, 36°40.505′N, 118°24.273′E; HNTX, 34°30.128′N, 114°27.738′E) were obtained from a field that had never received glyphosate applications and were near the putative GR populations. The seeds of all seven populations were cultured in plastic pots (7 cm by 7 cm) and kept in a greenhouse (Beijing, China) under the same conditions as in our previous study (Chen et al. Reference Chen, Huang, Wei, Zhang and Huang2015a). Plants of all populations were thinned to 8 plants per pot around the 2-leaf stage, and plants were watered as needed. Different doses (0, 105, 210, 420, 840, and 1,680 g ae ha−1 for GS populations; 0, 210, 420, 840, 1,680, 3,360, 6,720, and 13,440 g ha−1 for suspected GR populations) of glyphosate (Roundup Weathermax®, isopropylamine salt of glyphosate, 410 g ae L−1, Bayer Crop Science, St Louis, MO 63167; typical recommended rate is 840 g ha−1) were applied to 4- to 6-leaf-stage plants from all seven populations, and at least three replicates were performed for each treatment. Glyphosate was applied using a cabinet spray chamber with a moving TeeJet® XR8002 flat-fan nozzle under a pressure of 0.275 MPa (Compressed Air Cabinet Sprayer 3WPSH-500D, Beijing Research Center for Information Technology in Agriculture, Beijing, China) (Wang et al. Reference Wang, LI, Li, Han, Zheng, Yu and Cui2018). Dry weights of the shoots (dried at 80°C for 48 h) in each pot were measured at 14 d after treatment (DAT), and this experiment was performed twice.
Shikimate Accumulation Assay
Plants were cultured as described earlier. Four- to six-leaf-stage plants from all populations were treated with glyphosate at the recommended dose (840 g ae ha−1) using the same method described earlier. Leaf tissue samples were collected every 2 d after glyphosate treatment and stored at −80°C until use. Shikimate was extracted, and accumulation was determined based on a standard curve established during our previous study (Chen et al. Reference Chen, Huang, Wei, Zhang and Huang2015a). The optical density at 380 nm was measured using a Tecan Infinite 200 Pro (Tecan Group, Männedorf, Switzerland), and results are expressed in milligrams of shikimate per gram of fresh tissue.
Mutation Detection for EPSPS Gene
Plants were cultured as described earlier. Young leaf tissue were collected from 10 individuals randomly selected from each population and stored at −80°C. DNA was extracted using the Plant Genomic DNA Kit (Tiangen Biotech Beijing, Beijing, China) following the manufacturer’s instructions (Chen et al. Reference Chen, Huang, Zhang, Wei, Huang, Chen and Wang2015b), and the quality and quantity of the exacted DNA samples were checked using a Tecan Infinite 200 Pro microplate reader (Tecan Group). Primer pairs for the EPSPS gene clone, designed using DNAMAN software (Lynnon BioSoft, San Ramon, CA, USA), were 5′-AGATAAGAAGCAGCCGCCTT-3′ and 5′-GCACTCCATCAAGCACATAACT-3′. A 25-µl PCR mixture containing 1 µl of DNA, 1 µl of both forward and reverse primers (10 µM), 12.5 µl of Taq 2× Master Mix (Tiangen Biotech Beijing), and 9.5 µl of nuclease-free water was created. Amplification was performed under standard PCR conditions (Chen et al. Reference Chen, Jiang, Huang, Wei, Huang, Wang, Zhao and Zhang2017b), and the annealing temperature was 58°C. After the fragments (430 bp) were confirmed using 1% agarose 1× Tris-cetate EDTA gels stained with ethidium bromide, the PCR mix was sequenced by Sunbiotech (Sunbiotech Beijing, Beijing, China), and the EPSPS sequences of all populations were aligned using DNAMAN software (Lynnon BioSoft).
EPSPS Gene Expression and Copy Number Detection
Untreated young leaf tissues were sampled from the same 10 individuals from each population used for sequence detection. All samples were quickly frozen by liquid nitrogen after collection and stored at −80°C. Total RNA was extracted using a RNAprep Pure Plant Kit (Tiangen Biotech Beijing) following the manufacturer’s instructions, and the first-strand complementary DNA for RNA was synthesized using a FastQuant RT kit (Tiangen Biotech Beijing). DNA was extracted using the methods described earlier. We selected confirmed primer pairs for the quantitative PCR to amplify the EPSPS gene (cDNA and DNA) (cDNA: 5′-CTGATGGCTGCTCCTTTAGCTC-3′, 5′-CCCAGCTATCAGAATGCTCTGC-3′; DNA: 5′-CTGATGGCTGCTCCTTTAGCTC-3′, 5′-CCCAGCTATCAGAATGCTCTGC-3′) and the reference gene, chloroplast acetolactate synthase (ALS) (5′-GCAATTTCCCCAGTGACGACC-3′, 5′-GCAAAAGCCTCTATC
TTCCCTGT-3′) (Chen et al. Reference Chen, Huang, Huang, Wei, Yan, Jiang, Jie and Zhang2017a, Reference Chen, Jiang, Huang, Wei, Huang, Wang, Zhao and Zhang2017b). A standard curve was established for the relative quantification of the target genes and the reference gene (Chen et al. Reference Chen, Huang, Huang, Wei, Yan, Jiang, Jie and Zhang2017a, Reference Chen, Jiang, Huang, Wei, Huang, Wang, Zhao and Zhang2017b). Relative quantification of the target genes was performed using the  $\[{2^ - }^{\rm{\Delta \Delta}} {\rm{Ct}}}\]$
method, and
 $\[{\rm{Ct }} = {\rm{ }} - \left[ {{{\left( {{\rm{C}}{{\rm{t}}_{EPSPS}} - {\rm{ C}}{{\rm{t}}_{ALS}}} \right)}_{\rm{treat}}} - {\rm{ }}{{\left( {{\rm{C}}{{\rm{t}}_{EPSPS}} - {\rm{ C}}{{\rm{t}}_{ALS}}} \right)}_{\rm{control}}}} \right]\]$
(Bustin et al. Reference Bustin, Benes, Garson, Hellemans, Huggett, Kubista, Mueller, Nolan, Pfaffl and Shipley2009). Increase in EPSPS copy number was expressed as
 $\[{2^{\rm{\Delta} {\rm{Ct}}}}\]$
,
 $\[{\rm{Ct }} = {\rm{ }}\left( {{\rm{C}}{{\rm{t}}_{ALS}} - {\rm{ C}}{{\rm{t}}_{EPSPS}}} \right)\]$
(Gaines et al. Reference Gaines, Zhang, Wang, Bukun, Chisholm, Shaner, Nissen, Patzoldt, Tranel and Culpepper2010). Results are expressed as fold increase in EPSPS expression or copy number relative to ALS. All samples were numbered and tested individually, and three biological and three technical replicates were performed.
The Immunoblot Analysis for EPSPS Protein
To determine whether overexpression of EPSPS leads to increased levels of EPSPS protein, leaf tissue (200 mg) was collected from seven additional individuals from the AHCZ population. An additional two samples were collected from the GS population SDQZ. All the samples were numbered, and the copy number and expression were detected using the methods described earlier. Protein extraction was performed using the MinuteTM total protein extraction kit for plant tissues (Invent Biotechnologies, Eden Prairie, MN, USA) following the manufacturer’s instructions. Immunoblot analysis was performed according to previous research (Van Horn et al. Reference Van Horn, Moretti, Robertson, Segobye, Weller, Young, Johnson, Schulz, Green and Jeffery2018; Wiersma et al. Reference Wiersma, Gaines, Preston, Hamilton, Giacomini, Buell, Leach and Westra2014). Briefly, the denatured (boiled for 5 min) proteins were centrifuged at 17,000 × g and separated by 10% SDS-PAGE. Proteins were transferred to nitrocellulose membranes and were then incubated with primary EPSPS antibody (Abclonal Biotech, Cambridge, MA, USA) diluted 1:2,000. A goat anti-rabbit secondary antibody was used at a dilution of 1:8,000. Visualization and signal quantification were performed per the method reported by Van Horn et al. (Reference Van Horn, Moretti, Robertson, Segobye, Weller, Young, Johnson, Schulz, Green and Jeffery2018). We chose β-actin as the reference protein to correct for loading during the experiment. Primary β-actin antibody (Abclonal Biotech) was diluted 1:7,000.
FISH Mapping of the EPSPS Gene
Fluorescence in situ hybridization (FISH) was performed to determine the distribution of EPSPS copies on chromosomes in two individuals from the AHCZ population. The copy numbers of the resistant and susceptible individuals were 31 and 1.0, respectively. To prepare the EPSPS FISH probe, genomic DNA from the leaf tissue of a GS plant was extracted using a kit as described earlier. Two primer pairs (forward: CGAGGTAAGAAGAAGGATCCCC; reverse: TCCTGATACTTCATGAGCGG, product length 1,909 bp; forward: CCGCTCATGAAGTATCAGGA; reverse: AGCACGTCGAAGTAGTCTGG, product length 1,905 bp) were designed according to the sequence of E. indica EPSPS DNA (GenBank accession AY157642.1). Direct nick translation probe labeling was used in this study. PCR was conducted using the standard method, and the expected amplifications (1,909 bp and 1,905 bp) were confirmed by 1% agarose gel, then purified using a PCR purification kit (Tiangen Biotech Beijing). At least 1 mg of purified PCR product was cut into small single-stranded fragments (100 to 800 bp) using DNase I. The fragment of the EPSPS PCR product was labeled with digoxigenin dUTPs mix in the 10× nick translation buffer.
The drop technique was selected to prepare somatic chromosomes, similar to previous studies (Kato et al. Reference Kato, Lamb and Birchler2004, Reference Kato, Kato, Albert, Vega, Kato, Albert, Vega and Birchler2006). The tissue of the root tips was collected from GR and GS E. indica individuals and treated with 100 µl formamide (70%). Tissue degeneration was performed at 80 to 85°C for 1.5 min, followed by incubation in 70%, 90%, and 100% ethanol (4°C) for 5 min each. Samples were then dried at room temperature and used for hybridization. The mixture of probes and slide preparations was denatured at 100°C separately. Chromosome preparations were mounted and counterstained with 4′,6- diamidino-2-phenylindole solution in Vectashield® (Vector Laboratories, Burlingame, CA, USA). FISH images were captured with a UItraVIEW VoX microscope (PerkinElmer, Waltham, MA, USA).
Statistical Analysis
The values of herbicide doses required to reduce plant growth 50% (GR50) were estimated through a nonlinear regression and performed using Sigma Plot v. 12.0 (Systat Software, San Jose, CA, USA). We choose a log-logistic model:
 $$\[Y = {y_0} + a/[1 + {\left( {X/{X_0}} \right)^b}]\]$$
where b is the slope of the curve, y 0 is the lower limit, a is the difference value between the upper limit and the lower limit, and X 0 is the GR50 (Seefeldt and Fuerst Reference Seefeldt and Fuerst1995). Resistance level was determined by calculating the ratio of the GR50 of the resistant population to that of the susceptible population, and the results were expressed as the resistance index (RI). The data for the shikimate accumulation, EPSPS expression, and relative copy number were analyzed by ANOVA using Duncan’s multiple range test at P = 0.05 or Student’s t-test. All analyses were performed with the SPSS v. 13.0 (SPSS, Chicago, IL, USA).
Results and Discussion
Resistance Levels of Different Eleusine indica Populations
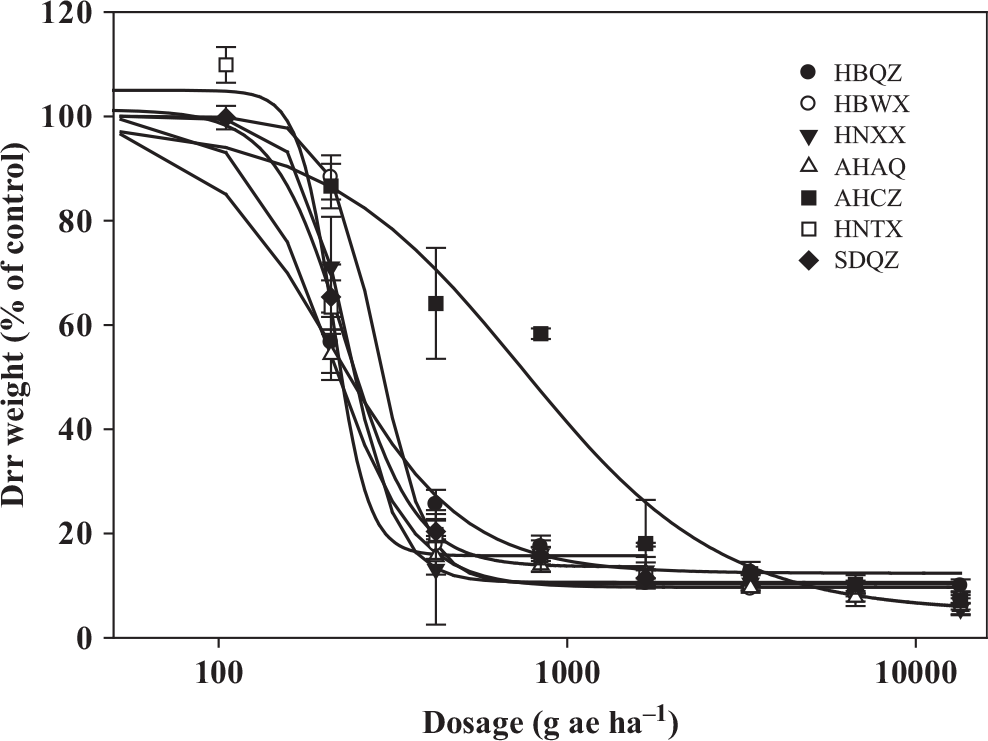
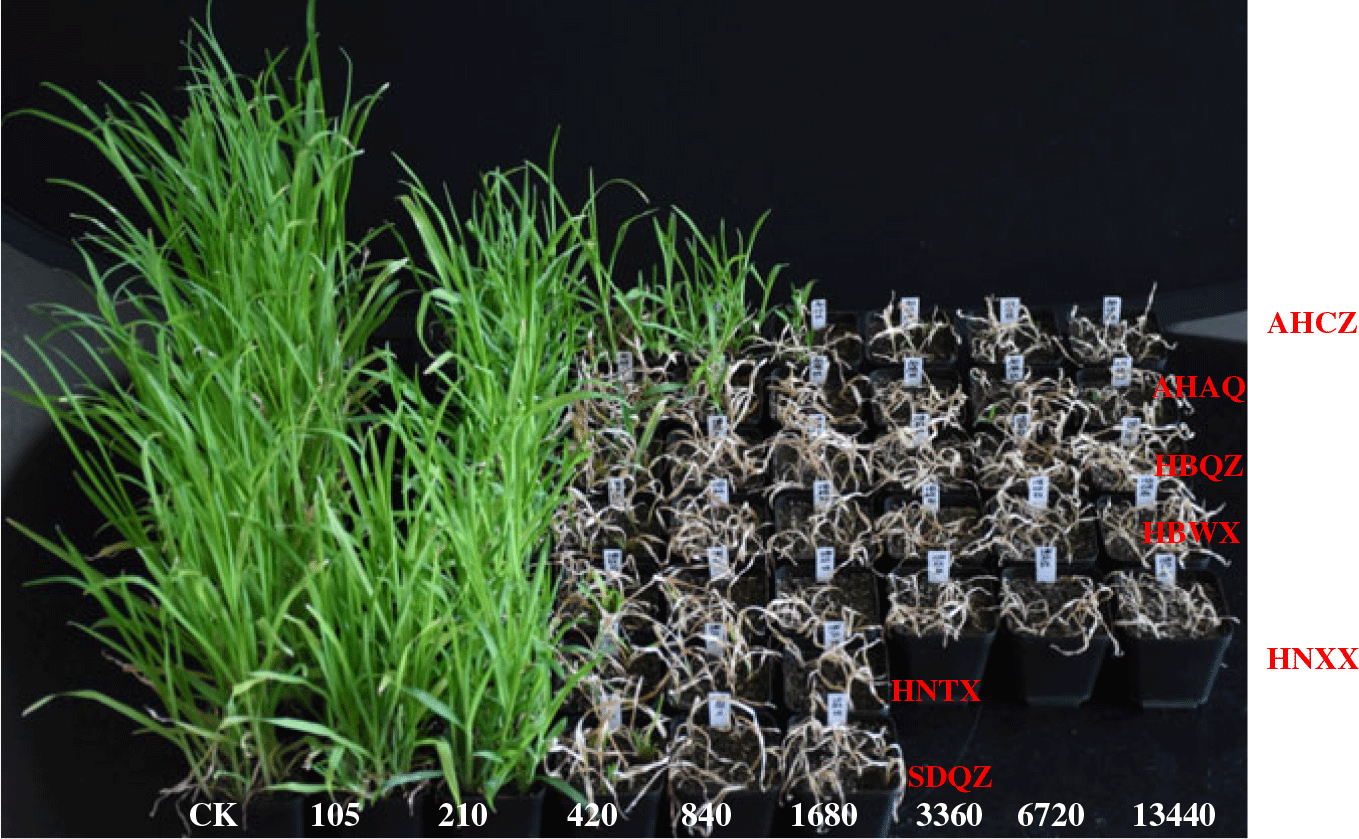
Plant growth in all seven populations was inhibited by high doses of glyphosate, although the response to glyphosate was different among the populations (Figure 1). At 14 DAT, most of the individuals of AHCZ suspected to be GR were alive in response to 840 g ha−1glyphosate (Figure 2). In contrast, all the individuals from the two GS populations were inhibited under this dose. GR50 values calculated from the dry weights of AHCZ were 740 g ha−1, and in contrast to the GS population SDQZ, the RI of AHCZ, the most resistant population, was 3.4 (Table 1). GR50 of the other suspected GR populations ranged from 210 to 290 g ha−1, and RIs ranged from 1.0 to 1.3. These results indicate that only the AHCZ population had evolved low resistance to glyphosate.
The response of seven Eleusine indica populations to different dosages of glyphosate. Vertical bars represent the standard error of the mean (SEM).

The response of plants in different Eleusine indica populations to glyphosate at 14 days after treatment. Five putative glyphosate-resistant E. indica populations (AHCZ, AHAQ, HBQZ, HBWX, HNXX) were collected from cotton fields in Anhui, Hebei, and Henan provinces. Two known glyphosate-susceptible E. indica populations (HNTX, SDQZ) were obtained from a nearby field. Numbers on the x axis are glyphosate doses and dose CK = control.

Parameter estimates (±SE) for dose–response analysis by nonlinear regression using fresh shoot weights from samples of seven Eleusine indica populations collected from cotton fields in China.

a GR50 (herbicide dose required to reduce plant growth 50%) of the resistant population divided by GR50 of the susceptible population.
Currently, GR E. indica populations have spread throughout Guangdong Province (Yang et al. Reference Yang, Tian, Feng and Yue2012), Sichuan Province (Chen et al. Reference Chen, Huang, Wei, Zhang and Huang2015a), and Anhui Province in China. The GR50 of the most-studied GR E. indica populations in China ranges from 700.0 to 3000.0 g ha−1, indicating moderate to high resistance levels (Chen et al. Reference Chen, Huang, Wei, Zhang and Huang2015a; Yang et al. Reference Yang, Tian, Feng and Yue2012). The use of mixtures of herbicide mechanisms of action is essential for GR E. indica management (Takano et al. Reference Takano, Oliveira, Constantin, Silva and Mendes2018). Some research has found that the acetyl-CoA carboxylase (ACCase)-inhibiting herbicides are effective to control E. indica with glyphosate resistance; similar effects were also found with the herbicides acetochlor and pendimethalin (Cahoon et al. Reference Cahoon, York, Jordan, Everman, Seagroves, Braswell and Jennings2015; Takano et al. Reference Takano, Oliveira, Constantin, Silva and Mendes2018).
Shikimate Accumulation
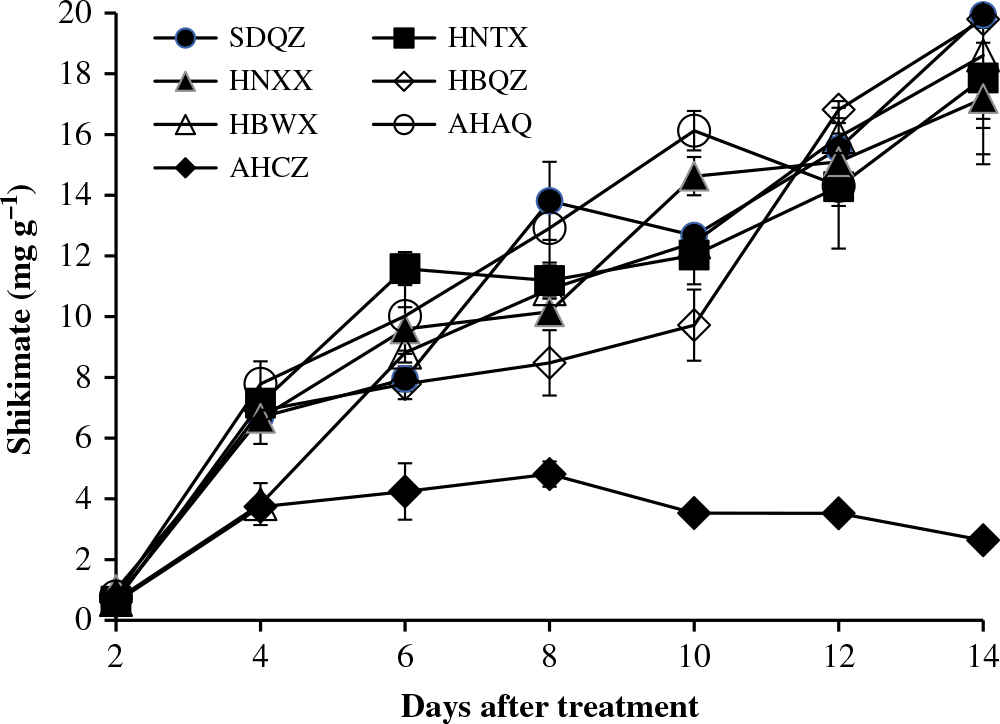
Plants from all seven E. indica populations were treated with 840 g ha−1glyphosate. Shikimate levels in the SDQZ and HNTX GS populations increased sharply, reaching about 20 mg g−1 (Figure 3). However, shikimate accumulation in plants from the AHCZ population was slightly increased after glyphosate treatment, with shikimate levels of approximately 5.0 mg g−1. In addition, shikimate accumulation in the other GR population was similar to that seen in the GS populations, reaching about 20 mg g−1 at 14 DAT.
Shikimate accumulation in the leaf tissues of five suspected glyphosate-resistant (AHCZ, AHAQ, HBQZ, HBWX, HNXX) and two glyphosate-susceptible Eleusine indica populations (HNTX, SDQZ) after glyphosate treatment at a dose of 840 g ae ha−1. Vertical bars represent the standard error of the mean (n =3).

Glyphosate inhibits EPSPS by competing with phosphoenolpyruvate, one of the substrates for this enzyme. This leads to reduced feedback inhibition in the pathway, resulting in high levels of shikimate in tissues (Steinrücken and Amrhein Reference Steinrücken and Amrhein1980). Lower levels of shikimate measured after glyphosate treatment in plants other than those in the GS population suggest glyphosate resistance. In this study, shikimate levels in the AHCZ population were only 0.24 times those in the GS population. Whole-plant assay results revealed that the GR50 of this population was 740 g ha−1, with an RI of 3.4. These results indicate that the AHCZ population has evolved a low level of resistance to glyphosate, while the other populations (AHAQ, HBQZ, HBWX, HNXX) remain susceptible to glyphosate treatment. Many kinds of herbicide have been used to control grass weeds in cotton fields, including ACCase inhibitors and acetamide-group herbicides, which may be the reason that the E. indica evolved only lower resistance to glyphosate.
EPSPS Sequencing
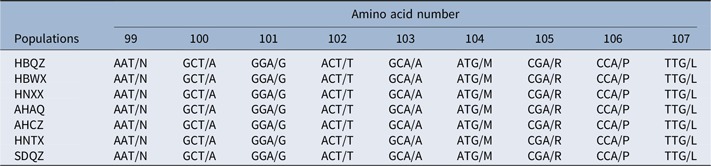
The DNA sequence of a region (430 bp) of the target gene, EPSPS, was cloned to detect possible mutations in the conserved region. EPSPS genes from 10 random individuals were cloned for each population, including GS populations. Sequence alignment results demonstrated that there were no SNPs in the conserved region (nucleotides 99 to 107) among all seven populations (Table 2). This indicates that other resistance mechanisms may be present in the AHCZ population.
Partial nucleotide sequence of EPSPS DNA and the predicted amino acids from five glyphosate-resistant populations (HBQZ, HBWX, HNXX, AHAQ, AHCZ) and two glyphosate-susceptible populations (HNTX, SDQZ) of Eleusine indica.

EPSPS Expression Patterns and Relative Copy Number
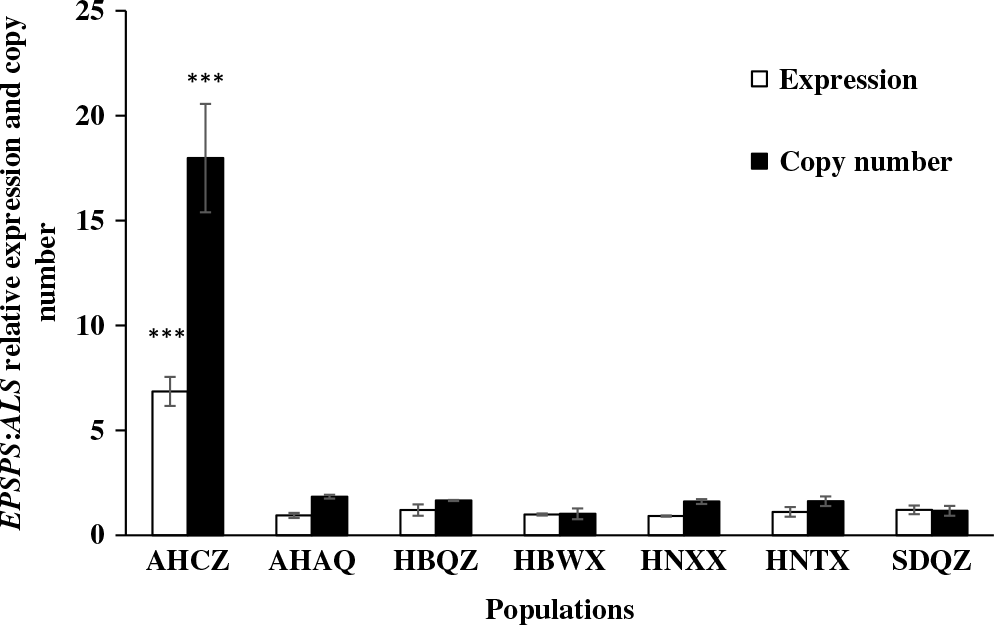
We measured EPSPS gene expression in the same 10 individuals used for the mutation analysis. A reference gene, ALS, was selected for normalization, which was previously confirmed in E. indica (Chen et al. Reference Chen, Huang, Huang, Wei, Yan, Jiang, Jie and Zhang2017a). Expression of EPSPS in the AHCZ population was 5.7 times greater than in the GS population SDQZ, indicating that EPSPS overexpression is present in the AHCZ population (Figure 4). In contrast, expression levels of EPSPS in the other putative GR E. indica populations were similar to those of the GS populations. This was expected, because these populations were revealed not be GR by other experiments in this study. Many studies have found that EPSPS genetic amplification is the mechanism underlying EPSPS overexpression (Gaines et al. Reference Gaines, Zhang, Wang, Bukun, Chisholm, Shaner, Nissen, Patzoldt, Tranel and Culpepper2010; Heap and Duke Reference Heap and Duke2018). Therefore, we determined the relative copy number of EPSPS compared with the reference gene ALS in the same samples used for detection of EPSPS expression. Results revealed that the AHCZ population possesses a higher EPSPS copy number than the GS population SDQZ. The average relative EPSPS copy number in plants from the AHCZ population was 18.0 (1.0 to 31), which was 15.4 times higher than in the SDQZ GS population (Figure 4).
EPSPS gene copy number and transcript abundance relative to ALS in five suspected glyphosate-resistant (AHCZ, AHAQ, HBQZ, HBWX, HNXX) and two glyphosate-susceptible (HNTX, SDQZ) Eleusine indica populations. Ten individuals were selected from each population. Vertical bars show the standard error of the mean for the replicates. Asterisks indicate significant differences of the values for GR E. indica population compared with the GS population (SDQZ) according to Student’s t-test (P < 0.05). ***P-value < 0.001.

EPSPS Protein Abundance
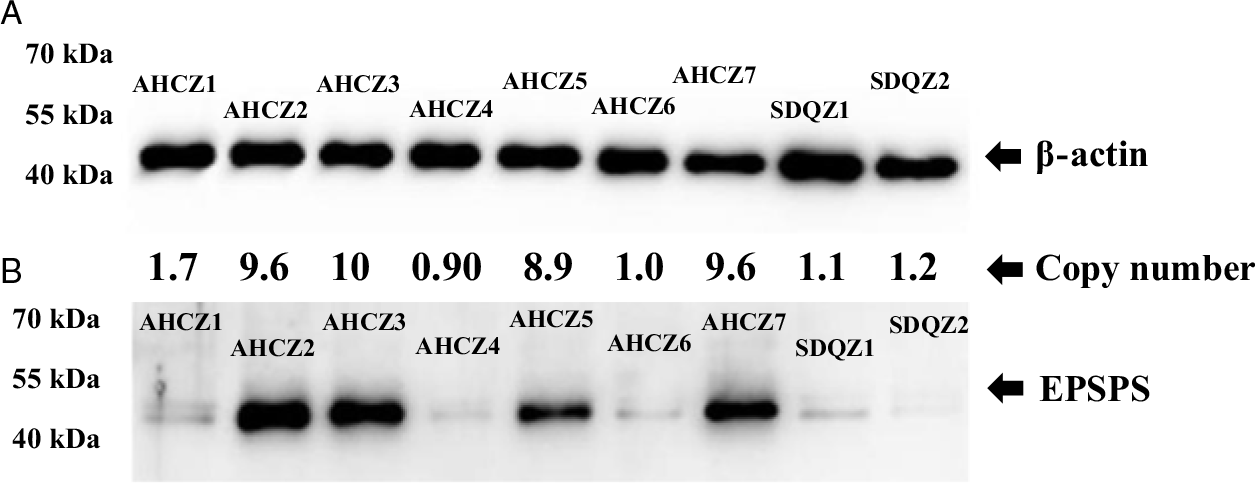
Seven and two additional individuals from the AHCZ and SDQZ populations were used to measure protein expression, respectively. Results showed that the EPSPS protein could not be detected in individuals from GS plants with a single relative EPSPS:ALS gene copy (Figure 5). In contrast, in GR E. indica populations with high EPSPS copy numbers, the signal for EPSPS, a 48-kDa protein, saturated the radiological film (Figure 5). In addition, there was a positive correlation between signal strength and copy number. Signals of the four individuals from the AHCZ population with high copy numbers (8.9 to 10) were stronger than those from the other three individuals with lower copy numbers (0.90 to 1.7). Moreover, signals from these three individuals were similar to those from the two individuals in the GS population.
The EPSPS (48-kDa) abundance in different individuals from the glyphosate-resistant population AHCZ and the glyphosate-susceptible population SDQZ determined by immunoblotting. (B) The immunoblot results for EPSPS protein; (A) the corresponding results for the reference protein β-actin. The relative EPSPS copy numbers of AHCZ1, AHCZ2, AHCZ3, AHCZ4, AHCZ5, and AHCZ7 were 1.7, 9.6, 10, 0.90, 8.9, 1.0, and 9.6, respectively. The relative EPSPS copy numbers for SDQZ1 and SDQZ2 were 1.1 and 1.2, respectively.

In this study, EPSPS amplification was confirmed in the AHCZ population, and immunoblot analysis revealed high EPSPS protein abundance in GR individuals. In addition, copy number showed a positive correlation with immunoblot signal. EPSPS gene amplification is a common resistance mechanism in GR weed species (Heap and Duke Reference Heap and Duke2018). The high copy number of EPSPS in chromosomes leads to its high expression and confers high abundance of the EPSPS protein (Gaines et al. Reference Gaines, Zhang, Wang, Bukun, Chisholm, Shaner, Nissen, Patzoldt, Tranel and Culpepper2010). There are currently eight weed species known to have evolved glyphosate resistance due to EPSPS amplification (Chen et al. Reference Chen, Huang, Zhang, Wei, Huang, Chen and Wang2015b; Gaines et al. Reference Gaines, Zhang, Wang, Bukun, Chisholm, Shaner, Nissen, Patzoldt, Tranel and Culpepper2010; Jugulam et al. Reference Jugulam, Niehues, Godar, Koo, Danilova, Friebe, Sehgal, Varanasi, Wiersma and Westra2014; Lorentz et al. Reference Lorentz, Gaines, Nissen, Westra, Strek, Dehne, Ruiz-Santaella and Beffa2014; Malone et al. Reference Malone, Morran, Shirley, Boutsalis and Preston2015; Nandula et al. Reference Nandula, Wright, Bond, Ray, Eubank and Molin2014; Ngo et al. Reference Ngo, Malone, Boutsalis, Gill and Preston2018; Salas et al. Reference Salas, Dayan, Pan, Watson, Dickson, Scott and Burgos2012).
Distribution of the Amplified EPSPS Copies in Eleusine indica
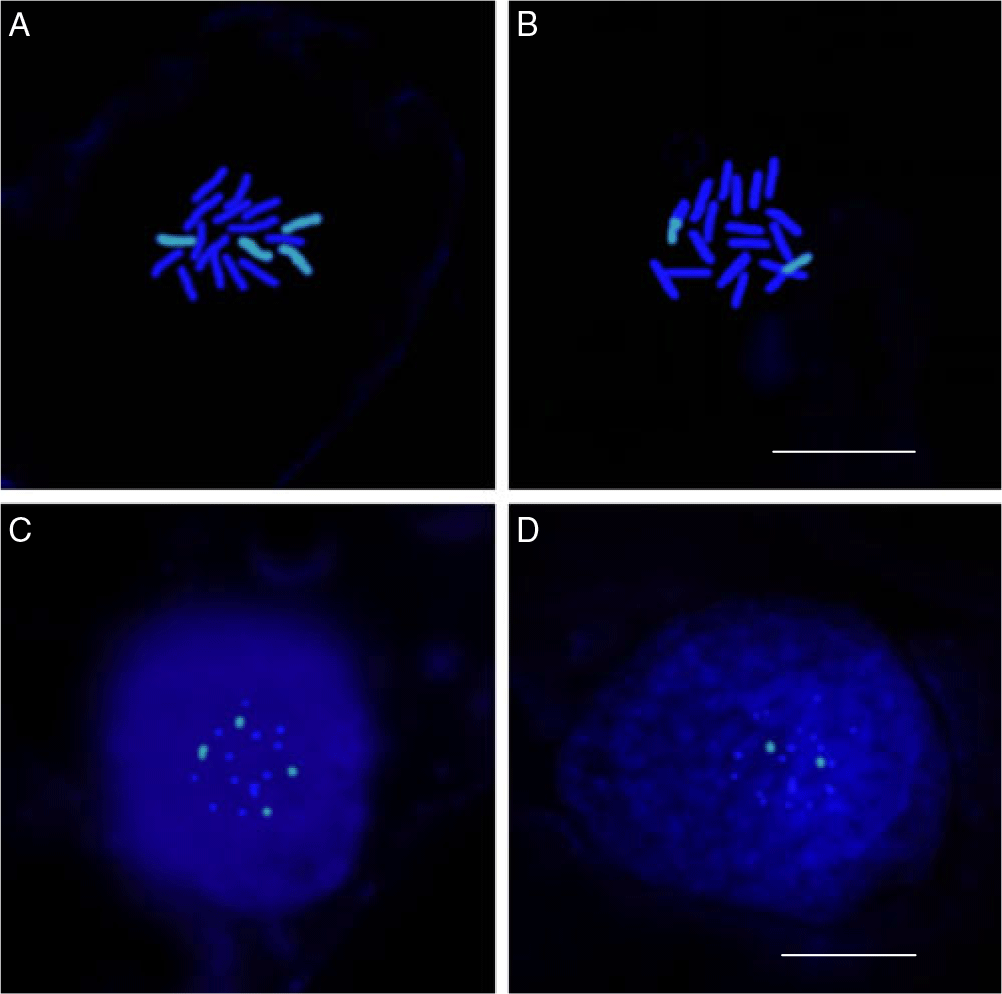
There are multiple copies of the EPSPS gene in GR plants from the AHCZ population. FISH was used to investigate the location and distribution of amplified EPSPS genes in E. indica, which has a total chromosome number of 2n = 18 (Ganeshaiah and Shaanker Reference Ganeshaiah and Shaanker1982). Mitotic metaphase chromosomes and interphase nuclei were selected to investigate the EPSPS signals. Results demonstrated that, in mitotic metaphase chromosomes, signals were dispersed throughout four chromosomes in the GR individual with copy numbers of 31, while in GS individuals, signals were only detected in parts of these two chromosomes (Figure 6). In interphase nuclei, EPSPS signals were the brightest in GR individuals compared with the GS individuals.
Fluorescence in situ hybridization mapping in glyphosate-resistant (GR) and glyphosate-susceptible (GS) Eleusine indica individuals. Somatic metaphase chromosomes of GR (A) and GS (B) E. indica. The interphase nuclei of GR (C) and GS (D) E. indica. Scale bars: 12.0 μm.

In this research, we confirmed that amplified EPSPS copies were distributed on two pairs of homologous chromosomes. To our knowledge, this is the first time that EPSPS distribution on the chromosomes has been observed in E. indica. Many studies have examined the evolutionary mechanism for EPSPS gene amplification using the FISH method. In plants of GR K. scoparia, amplified EPSPS (with 10 copies) gene copies were found in tandem amplification on one pair of homologous chromosomes (Jugulam et al. Reference Jugulam, Niehues, Godar, Koo, Danilova, Friebe, Sehgal, Varanasi, Wiersma and Westra2014). For GR waterhemp [Amaranthus tuberculatus (Moq.) J. D. Sauer], EPSPS gene copies were found not only on one pair of homologous chromosomes but also on an additional chromosome in addition to the native chromosome pair (Dillon et al. Reference Dillon, Varanasi, Danilova, Koo, Nakka, Peterson, Tranel, Friebe, Gill and Jugulam2017). Furthermore, EPSPS copies were distributed on all the chromosomes in plants on the GR A. palmeri (Gaines et al. Reference Gaines, Zhang, Wang, Bukun, Chisholm, Shaner, Nissen, Patzoldt, Tranel and Culpepper2010). Recently, Koo et al. (Reference Koo, Molin, Saski, Jiang, Putta, Jugulam, Friebe and Gill2018) reported that amplified copies of EPSPS in GR A. palmeri are present in the form of extrachromosomal circular DNA molecules.
Gene duplication is an evolved stress mechanism common to all organisms, as this kind of duplication can confer an adaptive advantage (Panchy et al. Reference Panchy, Lehti-Shiu and Shiu2016). Unequal recombination between homologous chromosomes or sister chromatids is considered one of the mechanisms of gene amplification, and this phenomenon has been confirmed in crop plants with disease resistance (Luo et al. Reference Luo, Peng, Li, Wang and Kuang2010; Van Binsbergen Reference Van Binsbergen2011). The EPSPS gene copies distributed in the telomeric regions of GR B. scoparia suggest these gene copies were generated by unequal recombination (Jugulam et al. Reference Jugulam, Niehues, Godar, Koo, Danilova, Friebe, Sehgal, Varanasi, Wiersma and Westra2014). In this research, EPSPS gene copies were found on two pairs of homologous chromosomes in GR E. indica, which may not result from unequal recombination. Some research has suggested that transposable elements (TEs) are the factors that lead to EPSPS gene amplification, as miniature inverted-repeat TEs next to the EPSPS gene were identified (Gaines et al. Reference Gaines, Wright, Molin, Lorentz, Riggins, Tranel, Beffa, Westra and Powles2013). TEs are mobile autonomous segments of DNA that are often randomly inserted in the genome, potentially incorporating within functional genes (Fedoroff Reference Fedoroff2012). In this study, spread of the EPSPS genes on the other pair of homologous chromosomes indicate that TEs may represent one of the mechanisms for EPSPS amplification. The extrachromosomal circular DNA molecules containing EPSPS genes are a new finding in GR weed species. In this research, EPSPS signals were discovered on two pairs of homologous chromosomes, and there were no signals in other regions of the nucleolus area. This indicates that extrachromosomal circular DNA may not be present in this GR E. indica individual.
Overreliance on glyphosate to control weeds in cotton fields has resulted in E. indica populations evolving resistance to this herbicide. In our study, one population from the Anhui Province was confirmed to be resistant to glyphosate, and EPSPS overexpression was the primary mechanism for this resistance. Interestingly, the EPSPS copies were distributed on two pairs of homologous chromosomes in this GR population.
Acknowledgments
No conflicts of interest have been declared. This research was funded by the National Natural Science Foundation of China (no. 31601666); the National Key Research and Development Program of China (2016YFD0300700); and a China Postdoctoral Science Foundation grant (2018T110167).