Implications
Feeding practices such as restricted feed intake are a common strategy to preserve the digestive health of the young rabbit, and to thus reduce medication during critical phases (weaning) or on farms with poor health status or hygiene levels. Feed restriction and housing hygiene have been studied to evaluate how these two factors interact on rabbit health and performance, and to provide insights into the mechanism of digestive health preservation regarding both host growth and immune response and its symbiotic digestive microbiota adaptation.
Introduction
A high incidence of digestive diseases is observed in young mammals, particularly around the weaning period (feed transition, stress, etc.). The etiology is still poorly understood and is often related to distortions and instability in microbiota and the incapacity of the local innate or adaptive immune system to efficiently fight against opportunistic pathogen agents. Preventive administration of antimicrobials is therefore a common practice to control digestive diseases in pig, poultry and rabbit breeding (Chevance and Moulin, Reference Chevance and Moulin2014), although it favors the emergence and dissemination of antibiotic-resistant bacteria. The transmission of resistance through the horizontal gene transfer (conjugation, transformation or transduction) between human and animal commensal, pathogenic and environmental bacteria represents a public health threat for humans as well as for animals. It is thus essential to find alternatives to reduce antimicrobial use while maintaining animal health.
Feed restriction is one of the most powerful leverages to reduce the incidence of digestive diseases in growing rabbits and particularly epizootic rabbit enteropathy syndrome (for review Gidenne et al., Reference Gidenne, Combes, Feugier, Jehl, Arveux, Boisot, Briens, Corrent, Fortune, Montessuy and Verdelhan2012). A 20% intake restriction compared with ad libitum led to a 50% reduction of mortality and morbidity (Gidenne et al., Reference Gidenne, Combes and Fortun-Lamothe2009). However, the underlying mechanisms supporting this effect are largely unknown. In feed-restricted rabbits, feed intake did not follow the circadian rhythm observed in ad libitum animals, and half of the intake occurs within 2 hours (Martignon et al., Reference Martignon, Combes and Gidenne2009). This could probably explain the higher stomach acidity in feed-restricted animals compared with the freely fed ones (Gidenne et al., Reference Gidenne, Combes and Fortun-Lamothe2009, Martignon et al., Reference Martignon, Combes and Gidenne2010a). Neither intestinal morphology (villosity and crypt shape) nor enzymatic secretion is affected in feed-restricted rabbits (Martignon et al., Reference Martignon, Combes and Gidenne2010a). In growing pigs, Le Floc’h et al. (Reference Le Floc’h, Knudsen, Gidenne, Montagne, Merlot and Zemb2014) subjected growing feed-restricted pigs to poor housing hygiene in order to induce a moderate inflammatory status (Le Floc’h et al., Reference Le Floc’h, Jondreville, Matte and Seve2006). They demonstrated that feed restriction did not reduce the systemic inflammatory response caused by poor hygiene, but reduced the occurrence of digestive disorders (Le Floc’h et al., Reference Le Floc’h, Knudsen, Gidenne, Montagne, Merlot and Zemb2014), irrespective of the hygiene conditions. Such interactions between housing hygiene conditions and feed restriction had never been studied in the growing rabbit, although housing hygiene varies greatly in field conditions and may explain the large variability of animal responses during critical periods such as weaning.
Besides its barrier role, microbiota is involved in immune organ and cell development, diversification of antibodies and mechanisms of oral tolerance. Microbiota stimulates the development of the blood vessel network of the intestinal villi (Stappenbeck et al., Reference Stappenbeck, Hooper and Gordon2002) and determines the development of follicles in the intestinal mucosa and in the vermiform appendix (Štěpánková et al., Reference Štěpánková, Kovaru and Kruml1980; Hanson and Lanning, Reference Hanson and Lanning2008). In addition, gut microbiota contributes to innate immunity through stimulation of Paneth cell antimicrobial peptide secretion. Finally, in rabbits, the diversification of the primary repertoire of antibodies, which begins before birth and ends at the age of 10 to 12 postnatal weeks, is dependent on bacterial stimulation (Mage et al., Reference Mage, Lanning and Knight2006; Hanson and Lanning, Reference Hanson and Lanning2008). Thus, close interactions between symbiotic microbiota, host intestinal immune and non-immune structures or cells ensure the maintenance of intestinal homeostasis and prevent the introduction and dissemination of pathogens in the digestive and systemic compartment. Thus, the digestive ecosystem is probably a key target for promoting health in rabbit. For instance, morbid rabbits exhibit altered fermentation profiles (increase in pH and decrease in the concentration of total volatile fatty acid (VFA), and the inversion of the propionate/butyrate ratio) compared with healthy rabbits (Martignon et al., Reference Martignon, Reperant and Valat2010b).
To obtain more insight into the mechanism of feed restriction action in the growing rabbit, this study was undertaken to evaluate the interaction between feed intake level and housing hygiene on growth performance, feed consumption and conversion, specific and inflammatory immune response, selected cecal fermentation parameters, digestive microbiota functioning and composition as well as health in rabbits.
Material and methods
Experimental design and animals
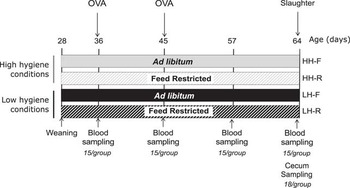
Young rabbits from both sex (Oryctolagus cuniculus; New Zealand White×Californian), weaned at 28 days old (day 28), were caged collectively (five rabbits per cage) and divided into four groups (n=105 rabbits/group housed in n=21 cages/group), according to a 2×2 factorial design with two levels of feed allowance, ad libitum feeding v. restricted feeding at 70% of ad libitum, and housing that differed in hygiene level, high v. low hygiene (Figure 1). Two groups of animals were housed in a room with low hygiene and fed an ad libitum diet (‘LH-F’) or a diet restricted to 70% of the voluntary intake (‘LH-R’), and two other groups of animals were housed in a room with a high level of hygiene, and fed an ad libitum diet (‘HH-F’) or a diet restricted to 70% (‘HH-R’). The room with a high hygiene level was cleaned before the animals’ entry, including the materials: cages, feeders, pipettes and watering ramps. Cleaning with hot water (90°C) and high pressure was conducted, followed by the spraying of antiseptic foam, rinsing, and the spraying of an antiseptic detergent (Virkon; Antec International Ltd, Rotterdam, The Netherlands). In the room with low hygiene conditions, previous animal manure was not eliminated (only hairs were cleaned before the start of the protocol) and the room was not disinfected before the animals’ entry. Similarly, no room cleaning or removal of excreta took place during the experiment. The lighting schedule alternated between 14 ;h of night with 10 ;h of light from 0100 ;h to 1100 ;h, and feed-restricted animals were fed daily in a single distribution between 0900 ;h and 0930 ;h in order to synchronize the ingestion profile of these animals and rabbits fed ad libitum. The amounts of feed distributed to the feed-restricted groups were calculated on the basis of a theoretical ad libitum ingestion curve, and readjusted according to the real ingestion of the rabbits fed ad libitum. Water was provided ad libitum. The diet was manufactured at the PECTOUL experimental unit, (INRA, Castanet-Tolosan, France), and was formulated to cover the nutritional requirements of the growing rabbits (ingredients: dehydrated alfalfa: 33.0%, barley: 14.5%, wheat: 15.0%, soybean meal: 12.0%, beet pulp: 12.0%, sunflower meal: 11.0%, minerals and premix: 2.5%). The measured chemical composition was dry matter (DM): 90.0%, CP: 20.4% DM, ether extract: 1.5% DM, starch: 18.8% DM, NDF: 33.5% DM, ADF: 20.12% DM, ADL: 6.35% DM. Animals were weighed individually once a week and feed consumption was measured per cage twice a week. Morbidity and mortality were checked daily: a control of clinical signs of digestive disorders such as diarrhea, cecal impaction, suspicion of epizootic rabbit enteropathy or other pathophysiological/pathological disorders (respiratory problems, injuries, etc.) was carried out. A health risk index was then calculated as the sum of the morbid and the dead for the initial number of animals for a given period (Gidenne et al., Reference Gidenne, Combes and Fortun-Lamothe2009). At day 36, 15 rabbits/group were subcutaneously immunized with an injection of 600 ;μg ovalbumin (OVA) (Sigma-Aldrich, Lyon, France) in incomplete Freund’s adjuvant (Sigma-Aldrich) and challenged 8 days later with 300 ;µg OVA in incomplete Freund’s adjuvant. Animals were handled according to the guidelines for animals used in experiments, in agreement with French legislation (Anonymous, 2009).
Schematic representation of the experimental design. The experimental groups are HH-F=high hygiene conditions and free intake; HH-R=high hygiene conditions and restricted intake (70% from F); LH-F=low hygiene conditions and free intake; LH-R=low hygiene conditions and restricted intake (70% from F); OVA=ovalbumin.

Sampling procedure and analyses of cecal physicochemical parameters
Four blood samples were taken from the 15 immunized rabbits at days 36, 45, 57 and 64. Blood was collected in heparin tubes. At 64 days of age, 18 rabbits/group were sacrificed: animals were first anesthetized using an intra-muscular injection of ketamine (Imalgene™, Merial, Lyon, France; 20 to 25 ;mg/kg live mass), then euthanized with an intra-cardiac injection of embutramide (T61™; Intervet International GmbH, Unterschleissheim, Germany; 0.3 ;ml/kg live mass). The full cecum was then quickly removed and weighed, and cecal contents were sampled immediately. Lymphoid organs (spleen and vermiform appendix) were removed and weighed to measure their development. The pH was then measured in the cecum using a glass pH ‘Unitrode’ electrode (Pt1000/B/2/3MKCl; Metrohm™, Villebon Courtaboeuf, France). The DM of cecal content was determined by heating a 10 ;g sample at 103°C for 24 ;h. Two samples of 1 ;g of fresh cecal content were diluted in storage solutions: one in HgCl2 (2 ;ml, 2% w/v) and one in H2SO4 (3 ;ml, 2% w/v), for further analysis of VFA and NH3, respectively. VFA was measured by automated gas chromatography (Chrompack CP 9000 gas chromatograph; Chrompack B.V., Middleburg, The Netherlands) and NH3 concentration was determined by a colorimetric method using a Continuous Flow Analyzer (SAN11; Skalar, Norcross, GA, USA).
Measurements of ovalbumin-specific and total immunoglobulin type G and haptoglobin
The total concentration of the immunoglobulin type G (IgG) was measured by ELISA as already described (Accensi et al., Reference Accensi, Pinton, Callu, Bourges-Abella, Guelfi, Grosjean and Oswald2006). Briefly, goat anti-rabbit IgG (Fc fragment specific) was used to capture antibodies (Bethyl; Interchim, Montluçon, France). Horseradish peroxidase (HRP)-labeled goat anti-rabbit IgG was used to detect antibodies in conjunction with TMB substrate (3,3',5,5'-tetramethyl benzidine; Thermo Fisher Scientific, Courtaboeuf, France). The enzyme-substrate reaction was stopped by the addition of H2SO4. Absorbance was read at 450 ;nm using an ELISA plate reader (Spectra Thermo, Tecan France, Lyon, France) and Biolise 2.0 data management software. Plasma samples were quantified by reference to standard curves constructed with known amounts of rabbit IgG. Titers of specific antibody anti-OVA were also measured by ELISA (Meissonnier et al., Reference Meissonnier, Laffitte, Raymond, Benoit, Cossalter, Pinton, Bertin, Oswald and Galtier2008). Briefly, the anti-OVA antibodies were detected with peroxidase-labeled anti-rabbit IgG (Bethyl). Anti-OVA IgG was also measured by ELISA. Briefly, ELISA plates were coated with OVA diluted in carbonate buffer (4 ;mg/ml 0.1 ;M NaHCO3, pH 9.6). Diluted plasma samples were then added to the plates and the anti-OVA antibodies were detected with HRP-labeled anti-rabbit IgG (Bethyl). Absorbance was read at 450 ;nm as previously indicated. Plasma samples were quantified by reference to standard curves constructed with rabbit hyperimmune serum. The plasma concentration of haptoglobin, an acute-phase protein, was measured on samples from 45 days to 64 days of age using a colorimetric method (Phase Haptoglobin assay T801; Tridelta Development Limited, Maynooth, Ireland).
Cecal content sample DNA extraction
Total DNA was extracted from 0.2 ;g of cecal content sample, combining a mechanical lysis with a FastPrep instrument (MP Biomedicals, Illkirch, France) and the QIAamp DNA stool minikit (Qiagen GmbH, Hilden, Germany), according to the manufacturer’s instructions. The quality and quantity of DNA extracts were checked using a NanoDrop ND-1000 spectrophotometer (NanoDrop Technologies, Wilmington, DE, USA). The V3 to V4 hypervariable regions of 16S ribosomal RNA genes (460 ;bp on Escherichia coli) of d64 samples were amplified with bacterial forward 343F (TACGGRAGGCAGCAG Liu et al., Reference Liu, Lozupone, Hamady, Bushman and Knight2007) and reverse 784R (TACCAGGGTATCTAATCCT Andersson et al., Reference Andersson, Lindberg, Jakobsson, Bäckhed, Nyrén and Engstrand2008) primers. Each primer had a barcode sequence of 11 nucleotides on 5', which was unique for each sample. PCRs were performed in a total volume of 100 ;μl containing 1× PCR buffer, 200 ;μM of dNTP (deoxyribonucleotide), 0.5 ;U IsisTM DNA polymerase (MP Biomedicals, Illkirch Graphenstaden, France), 0.5 ;μM of forward and reverse primers, and 1 ;μl of DNA (1 to 5 ;ng/µl). The amplification program consisted of an initial denaturation step at 94°C for 2 ;min; 32 cycles of denaturation at 94°C for 30 ;s, annealing at 60°C for 30 ;s and elongation at 72°C for 30 ;s, and a final extension step at 72°C for 7 ;min. PCR products were purified with the MiniElute PCR Purification Kit (Qiagen GmbH, Hilden, Germany). Size and quality of the barcoded purified amplicon from individual samples were checked on 2% (w/v) agarose gels using a NanoDrop ND-1000 spectrophotometer. The purified PCR products were quantified using Quant-iT PicoGreen dsDNA Assay Kit (Invitrogen, Saint Aubin, France) on an ABI Prism 7900HT sequence detection system (Applied Biosystems, Foster City, CA, USA) and then mixed in equimolar amounts to a final DNA concentration of 1000 ;ng/μl for each library. The pooled amplicons were pyrosequenced using a 454 FLX Titanium sequencer (454 Life Sciences, Roche Applied Science, Branford, CT, USA) at the GeT (Genomic and Transcriptomic) platform in Toulouse, France.
Sequence analysis
A total of 606 ;296 16S ribosomal DNA amplicon sequences were sorted based on their respective barcodes, representing the 72 collected cecal content samples. Using FROGS (Escudie et al., Reference Escudie, Auer, Cauquil, Vidal, Maman, Mariadassou, Hernandez-Raquet and Pascal2015) sequences were filtered by removing sequences that did not match both proximal PCR primer sequences (no mismatch allowed), with a short sequencing length (<400 nucleotides), with at least one ambiguous base or with a long homopolymer (greater than eight). Chimeric DNA sequences were detected using VSEARCH and removed. After trimming barcodes and adaptor sequences, the average read length was 430±7 nucleotides. Sequences were deposited in Sequence Read Archive: accession number SRP035383. Reads were clustered into Operational Taxonomic Units (OTUs) using SWARM (Mahé et al., Reference Mahé, Rognes, Quince, de Vargas and Dunthorn2014). OTU taxonomic assignment was performed using the BLAST algorithm against the SILVA SSU Ref NR 119 database (Pruesse et al., Reference Pruesse, Quast, Knittel, Fuchs, Ludwig, Peplies and Glöckner2007).
Statistical analyses
All statistical analyses were carried out using R software, version 3.0.2 (R Development Core Team, 2008). Categorical data (morbidity, mortality and health risk index) were analyzed using a χ 2-test. Non-repeated numerical data (growth performance, fermentative parameters and bacterial relative abundances) were subjected to ANOVA using a two-factor model – housing hygiene and intake level – and their interaction. To stabilize variance, a square root transformation was applied to bacterial community taxonomic data. Repeated numerical data (specific and total IgG and haptoglobin) were analyzed by a linear mixed model including age, and a two-factor model – housing hygiene and intake level – with their interactions as fixed effects and the rabbits as a random effect. Differences were considered significant at P<0.05. The Tukey HSD test was used to perform mean comparisons. A sparse Partial Least Square Discriminant Analysis was performed in order to identify the most discriminative OTUs in relation to treatments using the mixOmics package of R software (Lê Cao et al., Reference Lê Cao, Boitard and Besse2011). Three components were retained to discriminate the four groups. The number of OTU to be considered on each of the three components was assessed through the calculation of the lowest average error rate classification using a cross-validation procedure.
Results
Feed intake, growth and health status of growing rabbits
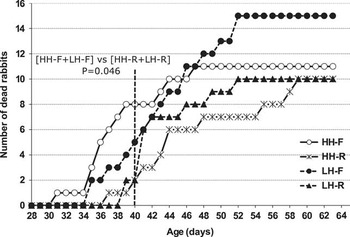
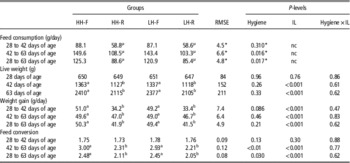
Throughout the whole experiment, the intake level of the feed-restricted group was limited to 70% of the control group fed ad libitum, 87 v. 123 ;g/day for both hygiene conditions (Table 1). No significant interaction between intake level and hygiene was observed. The average daily weight gain was reduced by 16% for the feed-restricted rabbits, whereas the intake was reduced by 30%. At the end of the experiment, these animals weighed 12% less than the control ones. After a 14-day period of adaptation, feed restriction led to a significant improvement in feed efficiency for the second period (from day 42 to day 63; −30%), resulting in an improved feed conversion of 15% throughout the experimental period. Low hygiene decreased the intake for the rabbits fed ad libitum (−4.1%, P<0.02 between day 15 and day 36; and −3.5%, P<0.02 for the entire experimental period). As hygiene conditions did not affect weight gain, feed conversion was thus slightly improved under low hygiene conditions from day 42 (Table 1). Overall mortality and morbidity reached 10.9% and 11.9%, respectively, which results in a health risk index of 22.8% (Supplementary Table S1). Mortality was not statistically different between the different groups and no significant difference was detected for the incidence of digestive disorders among the groups. However, the study of the mortality kinetics (Figure 2) shows a positive early effect on the mortality rate of restricted feed intake (P<0.05 between day 28 and day 40). Surprisingly, poor hygiene conditions decreased morbidity between day 28 and day 42 (P<0.05), and for the entire experimental period (P<0.01). Finally, the health index risk was not affected by treatments over the entire experimental period.
Effect of housing hygiene and of intake level on the post-weaning mortality kinetics in growing rabbits. HH-F=high hygiene conditions and free intake; HH-R=high hygiene conditions and restricted intake (70% from F); LH-F=low hygiene conditions and free intake; LH-R=low hygiene conditions and restricted intake (70% from F).

Effect of housing hygiene and intake level (IL) on growth and feed consumption in young rabbits

HH-F=high hygiene conditions and free intake; HH-R=high hygiene conditions and restricted intake (70% from F); LH-F=low hygiene conditions and free intake; LH-R=low hygiene conditions and restricted intake (70% from F); RMSE, root mean square error; nc=not calculable.
a,bMeans with a common superscript did not differ at P=0.05 level according to a monofactorial variance analysis (group effect).
* RMSE and P-levels for the comparison of LH-F and HH-F groups only.
µ The intake level for LH-R and HH-R groups is fixed, signifying that means have a null variance and were not compared.
Cecal physicochemical and fermentation parameters
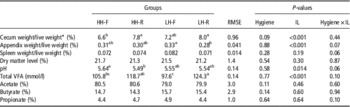
Housing hygiene did not impact the relative weight of the cecum or the appendix, or any of the environmental parameters of the cecum. The relative weight of the cecum was greater (−1 point; P<0.001; Table 2), and that of the vermiform appendix was lower in feed-restricted rabbits (−0.3 point; P<0.001; Table 2). Cecal content pH was lower for the animals under a restricted diet (5.51 v. 5.60; P<0.05; Table 2). The total amount of VFA was also higher for feed-restricted animals (121 v. 102 ;mmol/l; P<0.001), but the molar proportion of acetate, butyrate and propionate were similar between feed-restricted and ad libitum fed animals.
Organ weight and cecal fermentation parameters according to housing hygiene and intake level (IL) in young rabbits.

HH-F=high hygiene conditions and free intake; HH-R=high hygiene conditions and restricted intake (70% from F); LH-F=low hygiene conditions and free intake; LH-R=low hygiene conditions and restricted intake (70% from F); VFA=volatile fatty acid.
a,b,cMeans with a common superscript did not differ at P=0.05 level according to a monofactorial variance analysis (group effect).
* Full cecum weight (organ+content).
Cecal bacterial community: diversity and composition
The richness and diversity index of the bacterial community remained stable regardless of the hygiene of housing or diet. The average number of OTUs per sample was 308±92 with a coverage of 95.5±2.5%. Chao1 index and ACE (abundance-based coverage estimators), richness estimators, represented 415 and 416, respectively, whereas the Shannon index accounted for 4.3. Using a BLAST algorithm with a minimum coverage and identity of 95%, five different phyla were found across all samples (Supplementary Figure S1). Among them, Firmicutes represented 83% of the total sequenced DNA. Among the other low abundant phyla, Bacteroides represented 5.8% of the total sequences, followed by Proteobacteria (0.58%) and Actinobacteria (0.37%). Within the Firmicutes phylum, the families of Ruminococcaceae and Lachnospiraceae were dominant (50% and 22% of whole sequences, respectively), followed by Christensenellaceae (7.6%). The major families of the Bacteroidetes phylum are Rikenellaceae and Bacteroidaceae, representing 2.4% and 1.9%, respectively, of the sequences. Using a BLAST algorithm with a minimum coverage and identity of 95% and 97%, respectively, 76 genera could be assigned, representing 76.4% of the sequences. Among these genera, 14.2% of the sequences belonged to the genus Ruminococcaceae NK4A214 group, followed by the Lachnospiraceae NK4A136 group (9.0%) and the Ruminococcaceae V9D2013 group (7.4%).
Effects of treatments on the bacterial community
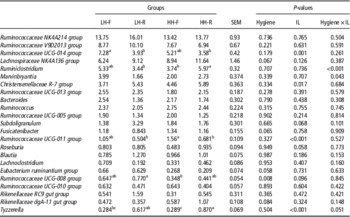
Low hygiene is responsible for a decrease in bacteria belonging to the Lachnospiraceae family, the second most important bacterial family that inhabits the cecal microbiota (19.8% v. 23.9% of total sequences; P=0.043), with the Ruminococcaceae family being the most abundant (50.2%). Thus, a significant increase in the Ruminococcaceae/Lachnospiraceae ratio for rabbits raised in poor hygiene conditions (3.7 v. 2.4; P<0.05) was observed. At the genus level, an increased abundance of bacteria belonging to the Ruminococcaceae UCG-008 group was observed (0.7% v. 0.4% of total sequences; P=0.008, Table 3) in low hygiene rabbits. Restricted feed intake slightly increased the abundance of the Proteobacteria phylum (0.64 v. 0.51; P=0.031, Table 3), the Desulfovibrionaceae family (0.59 v. 0.64; P=0.007, Table 3), the Tyzzerella genus (0.74 v. 0.29; P<0.001, Table 3) and the Christensenellaceae R-7 group (5.7% v. 4.0%; P=0.017, Table 3), whereas two Ruminococcaceae groups were reduced by half (the UCG-011 group: 1.3% v. 0.6%; P<0.001; and the UCG-014 group; 6.2% v. 3.7%; P<0.01, Table 3).
Core genus according to housing hygiene and intake level (IL) in young rabbit cecum (abundance in percent of the total number of sequences)
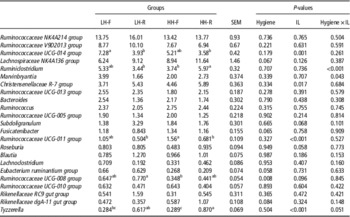
HH-F=high hygiene conditions and free intake; HH-R=high hygiene conditions and restricted intake (70% from F); LH-F=low hygiene conditions and free intake; LH-R=low hygiene conditions and restricted intake (70% from F).
a,b,cMeans with a common superscript did not differ at the P=0.05 level according to a monofactorial variance analysis (group effect).
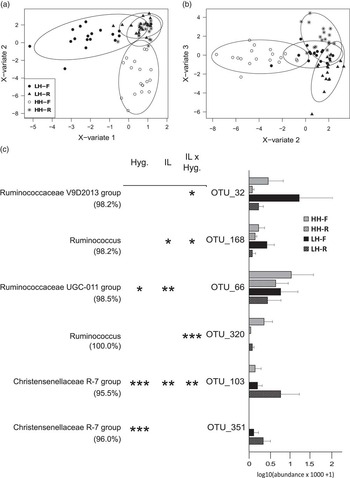
Among the 20 first most abundant OTUs, 12 were previously found in rabbits (Ley et al., Reference Ley, Hamady, Lozupone, Turnbaugh, Ramey, Bircher, Schlegel, Tucker, Schrenzel, Knight and Gordon2008, Monteils et al., Reference Monteils, Cauquil, Combes, Godon and Gidenne2008), confirming the high specificity of the bacterial species hosting rabbit cecum. Discriminant analysis was performed to highlight the most effective among the 1160 OTUs to discriminate between treatments (Figure 3). The first component leads to the separation of LH-F rabbits from the three other groups and was correlated with two OTUs (OTU_32 and OTU_168 affiliated with the Ruminococcaceae V9D2013 group and the Ruminococcus genus, respectively). The second component separated HH-F rabbits from the three other groups with a high level of two OTUs (OTU_66, OTU_320 Ruminococcaceae UCG-011 and Ruminococcus, respectively). Finally, the third component barely separated LH-R from HH-R with the highest abundance for the LH-R group in OTU_103 and OTU_351, both of which belong to the Christensenellaceae R-7 group.
Rabbit cecal bacterial community sample representation from sparse partial least square discriminant analysis (a) using the first two latent variables, (b) using the second and the third latent variables. (c) Relative abundance of the six most discriminant operational taxonomic units (OTUs) among the 1160 OTUs. In brackets the percentage of identity blast hits; HH-F=high hygiene conditions and free intake; HH-R=high hygiene conditions and restricted intake (70% from F); LH-F=low hygiene conditions and free intake; LH-R=low hygiene conditions and restricted intake (70% from F); *P<0.05, **P<0.01, ***P<0.001 for effect of housing hygien (Hyg.), intake level (IL) and their interaction.

Specific and inflammatory immune response
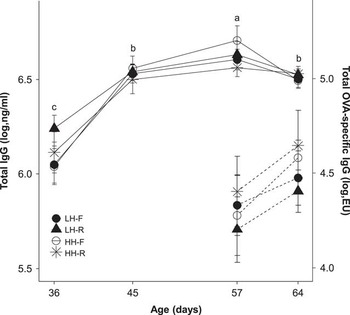
Total plasma IgG concentrations evolved with age (P<0.001) to reach their maximum level at day 57, and significantly decreased thereafter (P<0.05) (Figure 4). Repeated analyses revealed a significant interaction between the level of feed intake and the age (P=0.006). At 36 days of age, total IgG were the highest in LH-R (P<0.05). At day 57, feed restriction induced a reduction of the total IgG concentration in high hygiene conditions (−2.15%; P<0.05). As expected, specific plasma anti-OVA IgG concentrations were not detected before immunization (day 36). Before the second OVA immunization (day 45), anti-OVA IgG could only be measured in five out of 60 rabbits. The anti-OVA IgG concentrations increased between day 57 and day 64 (P<0.01). Haptoglobin concentrations were significantly lower in 45-day-old rabbits than at the other ages (0.29±0.17 v. 0.42±0.18 ;mg/ml; P<0.05). Neither hygiene conditions nor intake level affected total or anti-OVA IgG concentrations and haptoglobin.
Effect of housing hygiene and intake level on the plasma anti-ovalbumin immunoglobulin type G (IgG) and the total plasma IgG concentrations from 36 to 64 days of age in growing rabbits. HH-F=high hygiene conditions and free intake; HH-R=high hygiene conditions and restricted intake (70% from F); LH-F=low hygiene conditions and free intake; LH-R=low hygiene conditions and restricted intake (70% from F). a,b,cMeans with a common superscript did not differ at the P=0.05 level according to a monofactorial variance analysis (age effect).

Discussion
Preserving health is a major concern in livestock production. From an economic point of view, mortality and morbidity represent major economic losses. Moreover, animal health and its management directly impact the social acceptability of livestock production. During the last decades, antimicrobial substances have been massively used as a tool for health maintenance. Livestock production has recently had to address the immediate necessity of limiting the use of antimicrobial substances due to the increase in the occurrence of antimicrobial resistance. Some feeding practices such as limiting feed ingestion are known to reduce health disturbances in rabbits (Gidenne et al., Reference Gidenne, Combes, Feugier, Jehl, Arveux, Boisot, Briens, Corrent, Fortune, Montessuy and Verdelhan2012). Conversely, poor housing hygiene conditions are suspected to be a risk factor for health (Madec et al., Reference Madec, Bridoux, Bounaix and Jestin1998). This study was undertaken to evaluate the interaction of feed restriction and hygiene conditions on growth performance, feed consumption and conversion, specific and inflammatory immune response, selected cecal fermentation parameters, digestive microbiota functioning and composition as well as health in rabbits.
As expected, the beneficial effect of post-weaning feed intake limitation on feed efficiency in rabbits is confirmed in this study. Indeed, a reduction of 30% of the intake led only to a 16% reduction in daily weight gain (Gidenne et al., Reference Gidenne, Combes, Feugier, Jehl, Arveux, Boisot, Briens, Corrent, Fortune, Montessuy and Verdelhan2012; Knudsen et al., Reference Knudsen, Combes, Briens, Duperray, Rebours, Salaun, Travel, Weissman, Gidenne and Oswald2014). However, the resulting 15% of improvement of the feed conversion ratio observed in our study was higher than previously recorded with similar limited intake levels (Gidenne et al., Reference Gidenne, Combes and Fortun-Lamothe2009; Martignon et al., Reference Martignon, Combes and Gidenne2010a). This difference might be primarily related to differences in the feed composition. Knudsen et al. (Reference Knudsen, Combes, Briens, Duperray, Rebours, Salaun, Travel, Weissman, Gidenne and Oswald2014) reported that an increase of 1 ;MJ of digestible energy of the feed induced an improvement of nutrient digestibility (organic matter, energy and ADF) in feed-restricted rabbits.
Strategies based on intake limitation have proven to be effective in reducing morbidity and mortality in rabbits (Gidenne et al., Reference Gidenne, Combes and Fortun-Lamothe2009). This feeding practice is efficient to reduce the incidence of digestive disorders, particularly those related to epizootic rabbit enteropathy (Gidenne et al., Reference Gidenne, Combes, Feugier, Jehl, Arveux, Boisot, Briens, Corrent, Fortune, Montessuy and Verdelhan2012). Despite the limited number of animals, a positive effect of intake limitation could be seen in this study in the 12 days following weaning. During this period, feed-restricted rabbits also had the highest level of plasma total IgG, but this difference was only significant in low hygiene conditions. However, after a 29-day period of intake limitation in high hygiene conditions, feed restriction induced a reduction of the total IgG concentration. As previously discussed by Knudsen et al. (Reference Knudsen, Combes, Mousavikhorshidi, Oswald and Gidenne2015), the depletion in total IgG in feed-restricted rabbits is probably the result of the reduction of available energy for the immune system, which is a costly process, or a reduction in necessary available nutrients for the synthesis of these proteins. Accordingly, fecal IgA concentrations were correlated with digestible energy intake (Knudsen et al., Reference Knudsen, Combes, Mousavikhorshidi, Oswald and Gidenne2015). However, contrary to humoral immune response (immunoglobulins), the inflammatory response (haptoglobin) was not affected by intake limitation. This last observation is in agreement with a recent study that did not reveal any effect of the feeding level on the inflammatory response to an lipopolysaccharide (LPS) injection on the mean rectal temperature change or on the TNF-α (Tumor Necrosis Factor) concentration in rabbits fed a restricted diet for 1 week (Knudsen et al., Reference Knudsen, Combes, Briens, Coutelet, Duperray, Rebours, Salaun, Travel, Weissman and Gidenne2016). Conversely, a reduction of the LPS inflammatory response was observed in feed-restricted mice (Matsuzaki et al., Reference Matsuzaki, Kuwamura, Yamaji, Inui and Nakano2001) and rats (MacDonald et al., Reference MacDonald, Radler, Paolini and Kent2011).
It is now accepted that gut intestinal microbiota is involved in health preservation. Indeed, this symbiotic partner has evolved with its host and is largely involved in gut associated lymphoid tissue trophic development and stimulation. More specifically in rabbits, it has been shown that microbiota determines the development of follicles in the intestinal mucosa and in the vermiform appendix (Štěpánková et al., Reference Štěpánková, Kovaru and Kruml1980; Hanson and Lanning, Reference Hanson and Lanning2008). In addition, the diversification of the primary repertoire of antibodies in rabbits is dependent on bacterial stimulation (Mage et al., Reference Mage, Lanning and Knight2006; Hanson and Lanning, Reference Hanson and Lanning2008). In the present study, we explored microbiota composition and functioning changes according to hygiene conditions and feed intake level. Cecal ecosystem functioning as observed through fermentative parameters was not affected by hygiene conditions or feed intake level. The higher total VFA concentration and the associated lower pH observed in feed-restricted compared with ad libitum rabbits is probably the result of the difference in ingestion behavior. Feed-restricted rabbits did not follow the circadian rhythm observed in rabbits fed ad libitum and ate half of the intake within 2 ;h (Martignon et al., Reference Martignon, Combes and Gidenne2009; Gidenne et al., Reference Gidenne, Combes, Feugier, Jehl, Arveux, Boisot, Briens, Corrent, Fortune, Montessuy and Verdelhan2012). We demonstrate here for the first time that microbiota composition was modified in feed-restricted young rabbits and that this mainly concerns the genera belonging to the Ruminococcaceae family. In steer colon, OTUs classified within Ruminococcaceae, Lachnospiraceae and Clostridiaceae families have been associated with feed intake levels (Myer et al., Reference Myer, Wells, Smith, Kuehn and Freetly2015). Using fingerprint techniques, Abecia et al. (Reference Abecia, Fondevila, Balcells, Lobley and McEwan2007) showed that the structure of the cecal microbiota of lactating rabbit was influenced by the level of intake.
In the present study, low housing hygiene conditions had no negative impact on health and growth. We instead observed a positive effect on morbidity. Conversely in pig, low hygiene conditions decreased growth performance and induced a systematic inflammatory response (Le Floc’h et al., Reference Le Floc’h, Knudsen, Gidenne, Montagne, Merlot and Zemb2014). This discrepancy might be related to a species-specific response to hygiene degradation or to the extent and duration of hygiene degradation. In our conditions, a poor hygiene environment had a positive action on microbial colonization, as described in a study conducted on pig that compared indoor, outdoor and isolator-reared piglets (Mulder et al., Reference Mulder, Schmidt, Stokes, Lewis, Bailey, Aminov, Prosser, Gill, Pluske, Mayer, Musk and Kelly2009). Low hygiene conditions were associated with an increase in the Ruminococcaceae/Lachnospiraceae ratio that could best be explained by a lower abundance of Lachnospiraceae. Lachnospiraceae and Ruminococcaceae are two of the most abundant families found in rabbit gut (Huybens et al., Reference Huybens, Houeix, Licois, Mainil and Marlier2013; Bauerl et al., Reference Bauerl, Collado, Zuniga, Blas and Martinez2014; Combes et al., Reference Combes, Gidenne, Cauquil, Bouchez and Fortun-Lamothe2014) and in other mammalian gut environments (Biddle et al., Reference Biddle, Stewart, Blanchard and Leschine2013). Both families have been associated with gut health (Berry and Reinisch, Reference Berry and Reinisch2013; Biddle et al., Reference Biddle, Stewart, Blanchard and Leschine2013). In a study comparing healthy rabbits and rabbits suffering from epizootic rabbit enteropathy, the former group was linked to two uncharacterized genera of the Ruminococcaceae family and one genus of Lachnospiraceae family (Bauerl et al., Reference Bauerl, Collado, Zuniga, Blas and Martinez2014). Moreover, in rabbit, stimulation of coprophagia behavior in the nest sped up microbiota maturation, reduced the mortality rate and, a reduction of Lachnospiraceae abundance was also observed (Combes et al., Reference Combes, Gidenne, Cauquil, Bouchez and Fortun-Lamothe2014). We confirmed the uniqueness of the rabbit cecal microbiota composition (Ley et al., Reference Ley, Hamady, Lozupone, Turnbaugh, Ramey, Bircher, Schlegel, Tucker, Schrenzel, Knight and Gordon2008; Monteils et al., Reference Monteils, Cauquil, Combes, Godon and Gidenne2008; Bauerl et al., Reference Bauerl, Collado, Zuniga, Blas and Martinez2014), and suggested some putative OTUs whose abundances were correlated with treatments. Unfortunately, the microbial species that inhabit the rabbit cecal ecosystem are largely unknown. Further studies are needed to confirm that the taxonomic units highlighted in this study (e.g. bacterial families, genera and OTUs) could be relevant microbial biomarkers of intestinal health in rabbit. If this hypothesis is confirmed, the definition of microbial biomarkers could be harnessed to define new rearing strategies to preserve health. Moreover, metagenomic studies on single bacterial cell (e.g. the exhaustive exploration of whole bacteria genomes) would be helpful to obtain insights into species living in the rabbit gastrointestinal tract and to understand the functional link between the presence of a set of microbe species and its effect on the host.
Conclusion
We confirmed that feed restriction in growing rabbits is a relevant strategy to preserve health and to improve feed efficiency. Contrary to what was expected, the degradation of hygiene conditions failed to induce a systematic specific and inflammatory response in rabbit, but reduced morbidity instead. However, both a reduced intake and low housing hygiene conditions after weaning affected microbiota composition and particularly genera and OTUs belonging to the dominant Ruminococcaceae family. Together, these results suggest that the microbiota composition would be a helpful source of biomarkers of health. However, further studies are needed to obtain a greater insight into the microbiota composition signature of health and diseases.
Acknowledgements
This study received financial support from the Animal Physiology and Livestock System Division of INRA. The authors thank, Patrick Aymard, Jean-Marie Bonnemère, Annette Debrusse, David Labatut, Michel Moulis and François Richard from INRA PECTOUL for animal care, and Béatrice Gabinaud, Muriel Segura and Carole Bannelier for their laboratory expertise.
Supplementary material
To view supplementary material for this article, please visit http://dx.doi.org/10.1017/S1751731116002007