Introduction
It is now a little over 100 years ago that studies of the motion of Hintereisferner (HEF), Central Alps, Austria, were initiated, when Blümcke and Hess (1899) obtained the first velocity data and ice-thickness changes from a survey of stone lines and Slakes in 1894. Ever since, velocity, ice-thickness changes and front variations of the glacier have been measured annually with some minor exceptions during the two world wars. Since their map of 1894 on a scale of 1: 10 000 (Fig. 1), several maps have been produced, the most recent one for 1979 (Kuhn, 1981).
The mass balance of HEF has been determined annually since 1952 (Schimpp, 1960; Hoinkes, 1970). The network of ablation stakes that served the purpose of mass-balance studies very well was left to move with the ice without being repositioned annually.
Map of boundaries and 100 m isohypses of Hintereisferner in 1894 (dotted line) and 1979 (full line). Profiles “Linie 6” and “Linie 3”are mentioned in the text. The center line begins at Weisskugel and is entered in 100 m intervals, with markings at every kilometre. The front position of 1994 is now at the 7.1 km site.
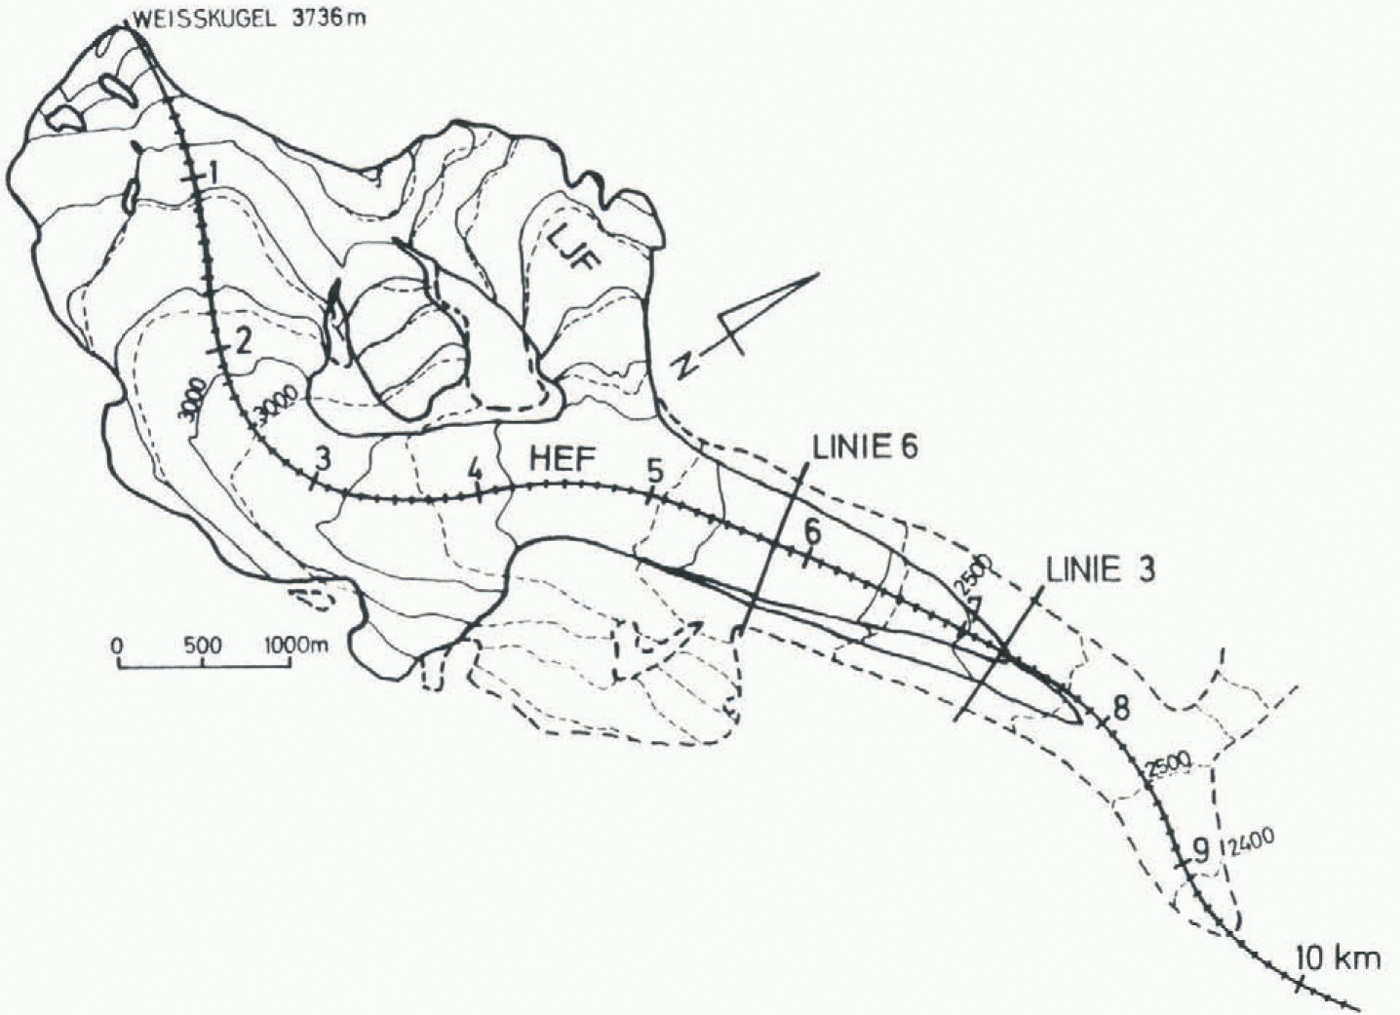
In order to obtain local changes of the velocity field, we subdivided the central flowline into 100 m segments and averaged the motion of all stakes within that section, directly at or close to the center line in a particular year (Span, 1993). Locations of stakes are referred to as, for example, “the 5.8 km site” on a center-line curvilinear coordinate system, Fortunately, there were up to 10U stakes on HEF so that this method could be applied without major problems. The present study is based on the first complete evaluation of all surveys, carried out in Span’s (1993) thesis.
Velocity Data
The 100 year record covers three periods of accelerated flow in which peak velocities were a multiple of those in the quiescent phases in between, but only around 1920 did HEF advance about 60 m. Most records refer to horizontal flow. Only after 1965 were the mass-balance and flow data found to be of sufficient density and reliability for emergence velocities to be computed as well. Values of velocity given in this paper mean horizontal displacement from one summer season to the next.
1894–1932
Hintereisferner most likely had been retreating continously between its last maximum extent around 1855 and the first map, produced in 1894. Some stakes and stone lines were installed that year to measure the horizontal velocity up to the area where Langtaufererjochferner (LJF) flows into HEF (4.2 km in Fig. 1).The dotted and the full lines in Figure 1 denote the boundary and isohypses of HEF in 1894 and 1979, respectively. In 1894, the equilibrium line was located at about 2800 m altitude (Hess, 1924); today it is close to 3000 m.
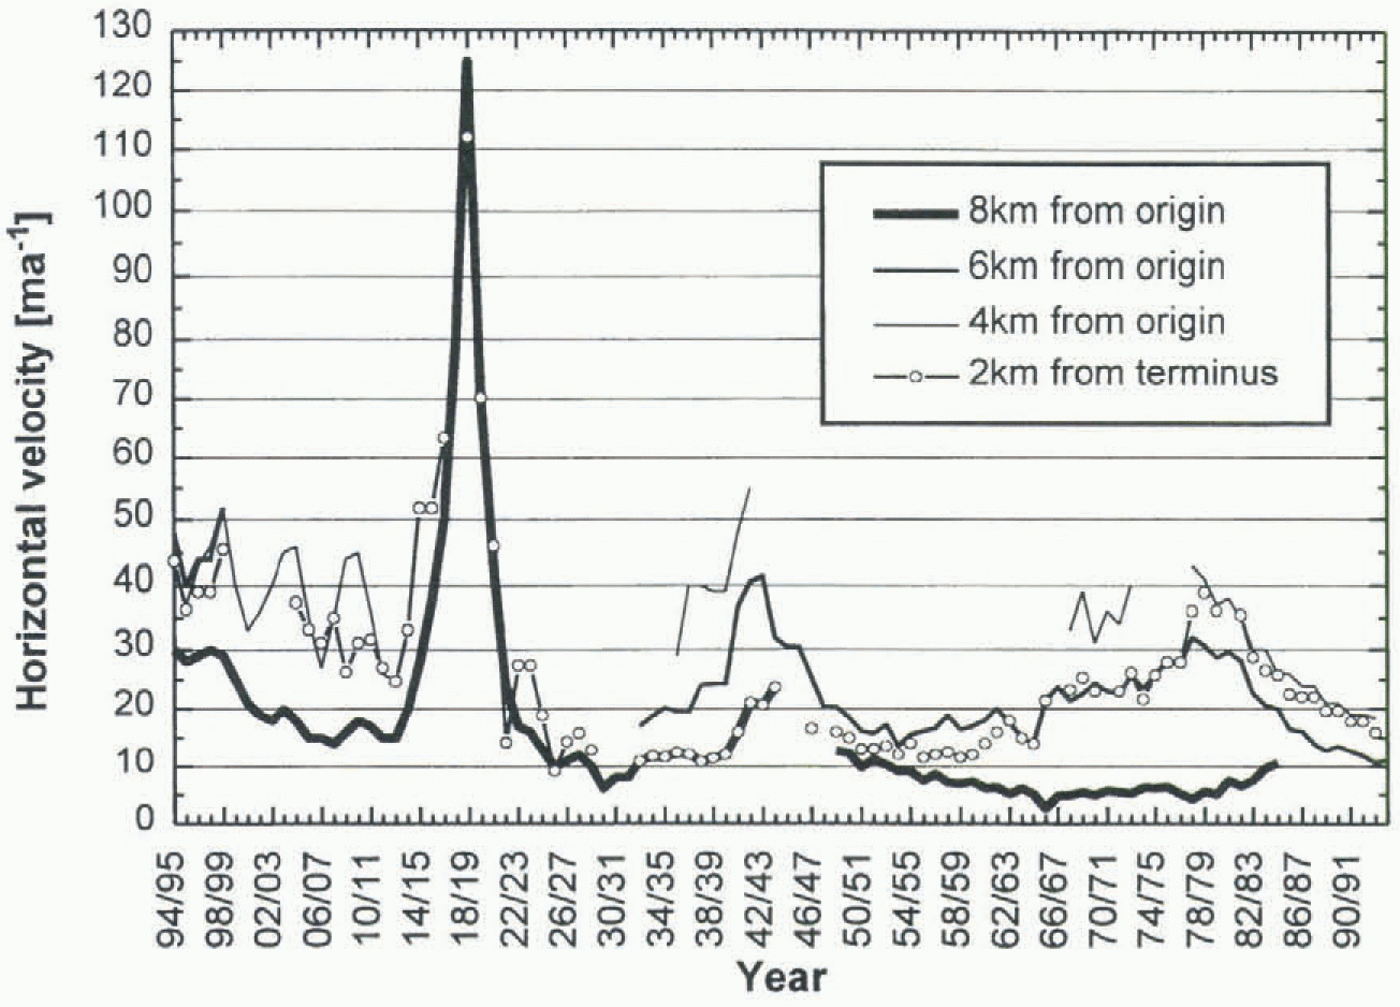
The horizontal velocities for different sites between 1894–95 and 1932–33 are plotted in Figure 2. During that period, the velocity was more variable in the accumulation area than in the ablation area, contrary to later records. A certain periodicity appearing in the velocity at the highest locations in Figure 2 and again in Figure 3 led Hess (1924) to assume the existence of an “orographic period” of 5 years. If maxima of mass balance coincided with the “orographic periods”, a dramatic increase of velocity would occur (i.e. 1914–15). This would have been a challenging observation, had it been a question of a self-oscillating glacier (Budd, 1975). However, no oscillations of that frequency were observed in the following decades. In the lower part of HEF, the three maxima at the turn of the century were either very weak or vanished completely.
First minima of ice velocity were reached in or around 1907 and 1913. The 2 year mean of 1915 and 1916 was already more than twice the value of that minimum. The following years displayed a dramatic acceleration that culminated in 125 m year−1 for 1918–19. Three years later, the velocity had dropped to values of about 15 m year−1.
It is remarkable that the maximum speed was reached almost simultaneously over the entire glacier, indicating a strongly increased sliding component. A kinematic wave, if one existed at all, could have played a secondary role only, and a classical kinematic wave was not obvious in any change of elevation data (Van de Wal and Oerlemans, 1995). Because of World War I and the subsequent economic crisis, no velocity data for the upper part of HEF are available.
Contrary to velocity changes, ice-thickness changes amounted to a maximum value of 13 m at the 8.2 km site only. The ice thickness was about 180 m at this point, so an increase in ice thickness alone cannot explain the increase of horizontal velocity. Finally, the high velocities led to an advance or HEF of about 60 m until 1922.
1932–65
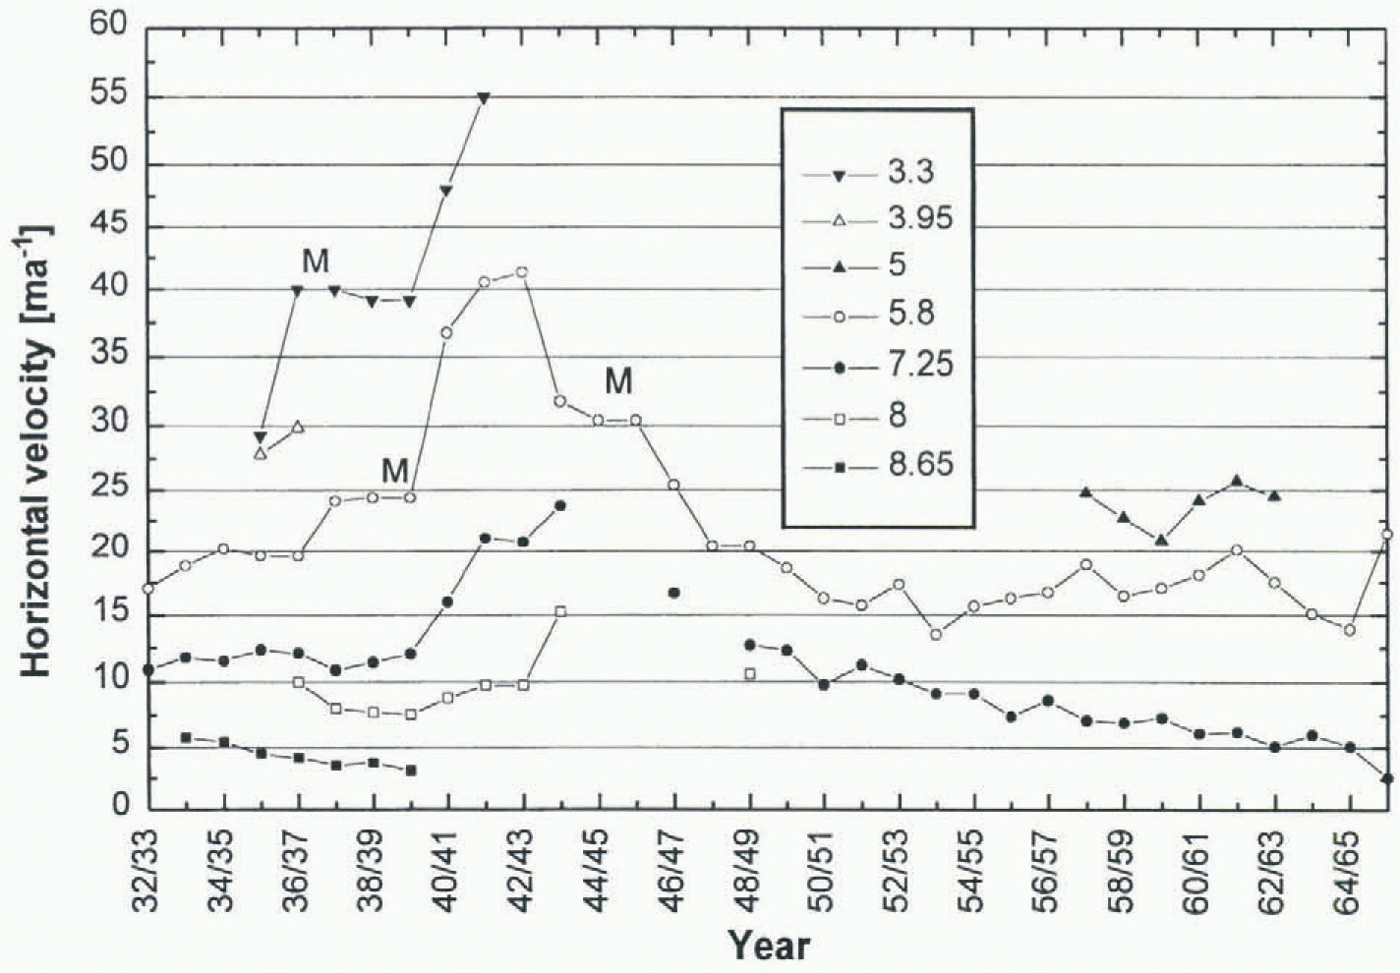
From 1932 to 1965, H. Schatz continued the survey of several stone lines in the ablation area and of stakes in the lower accumulation area. The velocity peak that he observed (Fig. 4) was less marked than in the early 1920s. The increase and then decrease in speed covered more than a decade. The maximum velocity was reached at “Linie 6” (5.8 km site) in 1942–43, and possibly 1 year later in the lower profiles. The ice thickness at the 5.8 km site was about 240 m. No measurements above the equilibrium line are available. The big in velocity maxima does perhaps indicate a kinematic wave, but no data on ice-thickness changes are available. After World War II, only “Linie 6” and “Linie 3” were carried on. Since 1952, the specific mass balance has been determined every year, providing an opportunity to look for possible relationships between velocity changes and mass balance (Meier and Tangborn, 1965; Kuhn and others, 1996). An astonishing event can be noted in Figure 4: one year after the extremely positive mass balance of about 900 mm w.e. in 1964–65, the surface velocity increased from 14 to 21 m year−1! This event was the beginning of a slow increase in speed until 1977–78.
Horizontal velocity of Hintereisferner from 1894–95 to 1932–33. The numbers in the legend in this and in all the following plots denote positions on the center line. M stands for a mean value over a period of 2 years. The first measured site is at 6.9 km, and most of the data are j mm 3.8 km downwards.

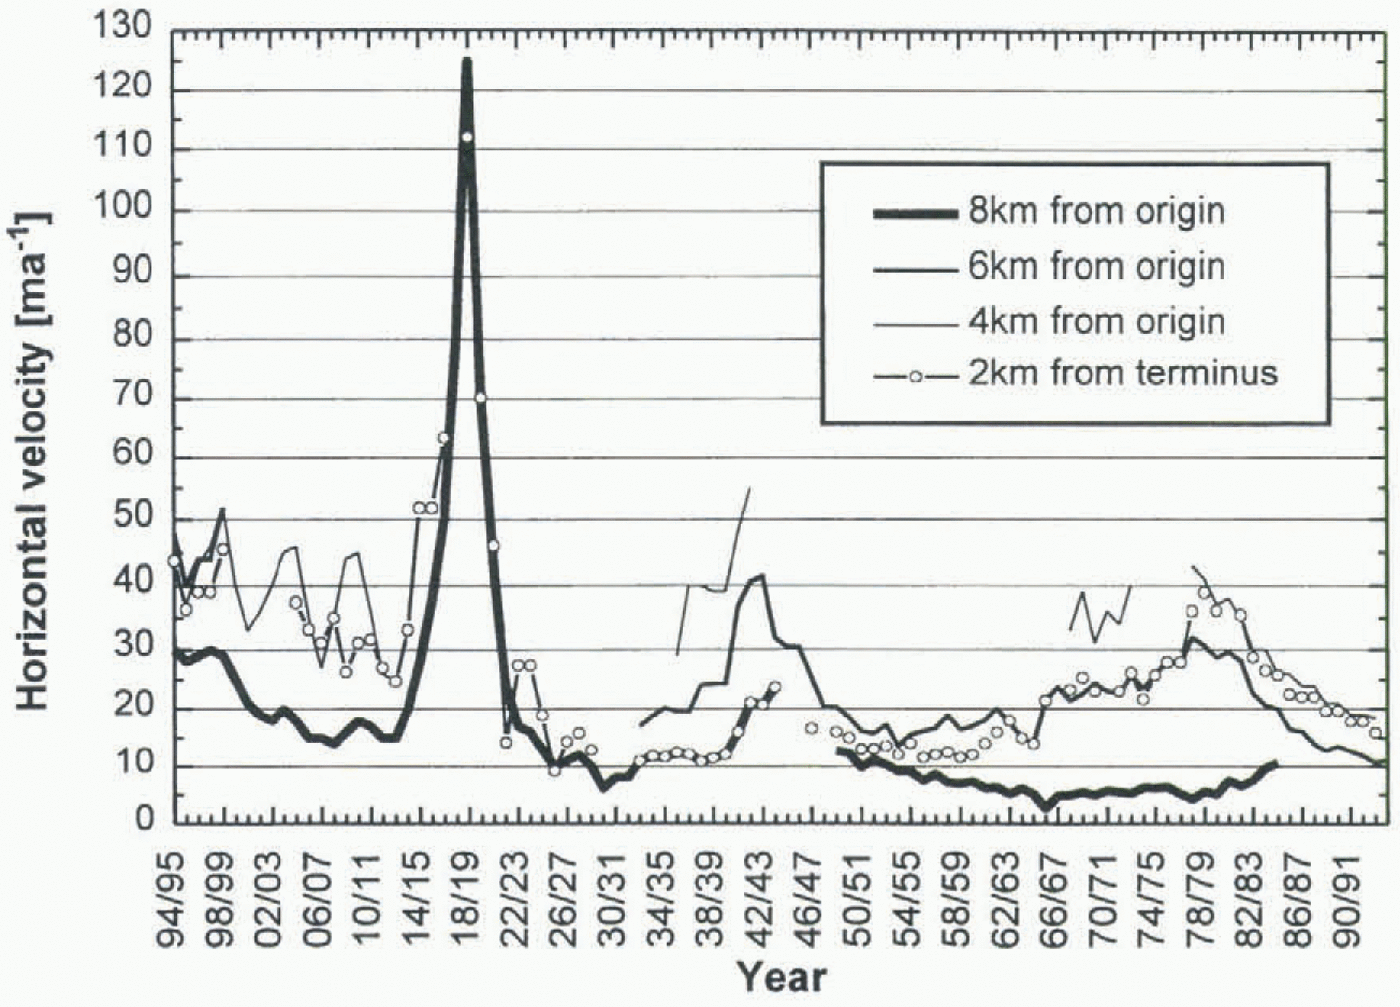
The 100 year series of horizontal velocity of HEF represented here by means of three fixed sites at the center line and on e site which is always 2 km from the end of the glacier.
1965–94
In 1965, H. Schneider took over from Schatz (1953), performing the annual surveying of horizontal velocity and changes in elevation. By that time, the main purpose of the stakes had become the determination of the annual mass balance, and consequently the stakes were not set back into their original position every year.
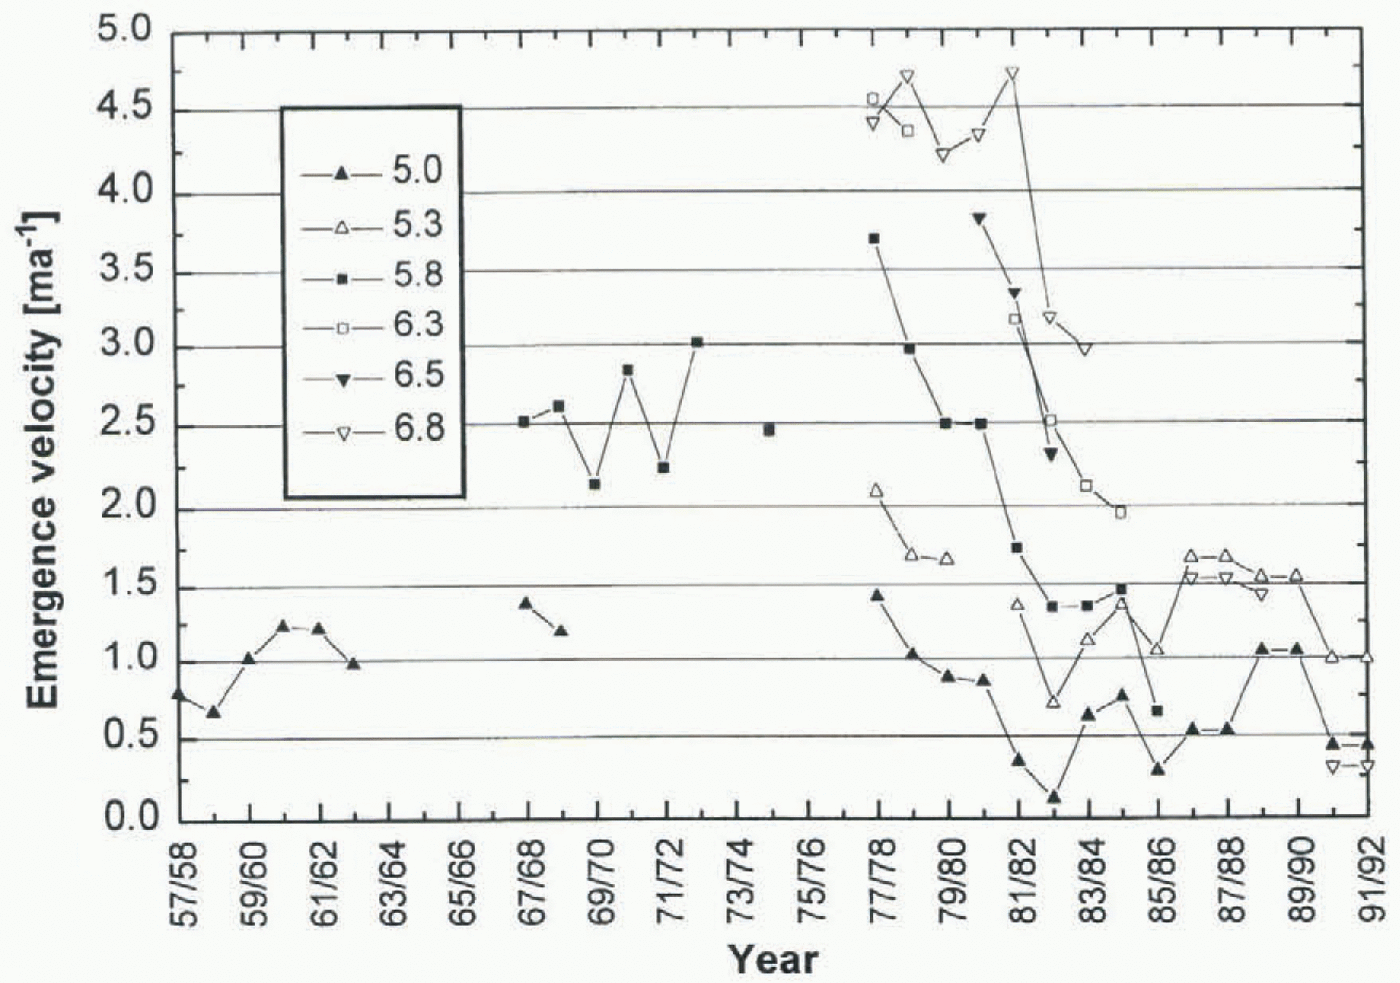
The acceleration of flow in the 1970s was the weakest in the three periods observed. The slow increase continued over a decade and led to a maximum of horizontal velocity (Fig. 5), emergence velocity (Fig. 6) and elevation in 1977–78. During that decade of accelerated flow we compared the motion of stones placed on the ice surface with that of stakes
Horizontal velocities of Hintereisferner from 1932–33 to 1965–66. During that period only stone lines were used to measure the velocity except for a few stakes in the firn basin until 1942. After World War II, only the data of stone lines “Linie 6”and “Linie 3” are available. At the end of this period there was a remarkable jump of speed from 14 to 21 m year -1 due to the most positive mass balance ever measured (about 900 mm w.e.).

Horizontal velocities of Hintereisferner from 1966–67 to 1993–94.

embedded within the ice, and found that the two never differed by more than 0.5 m year−1.
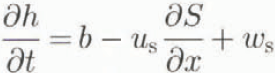
At the profile of “Linie 6” we can assume that the transversal strain rate amounts to zero (Meier and others, 1974), and with incompressibility the continuity equation becomes (Paterson, 1994):
where
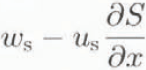
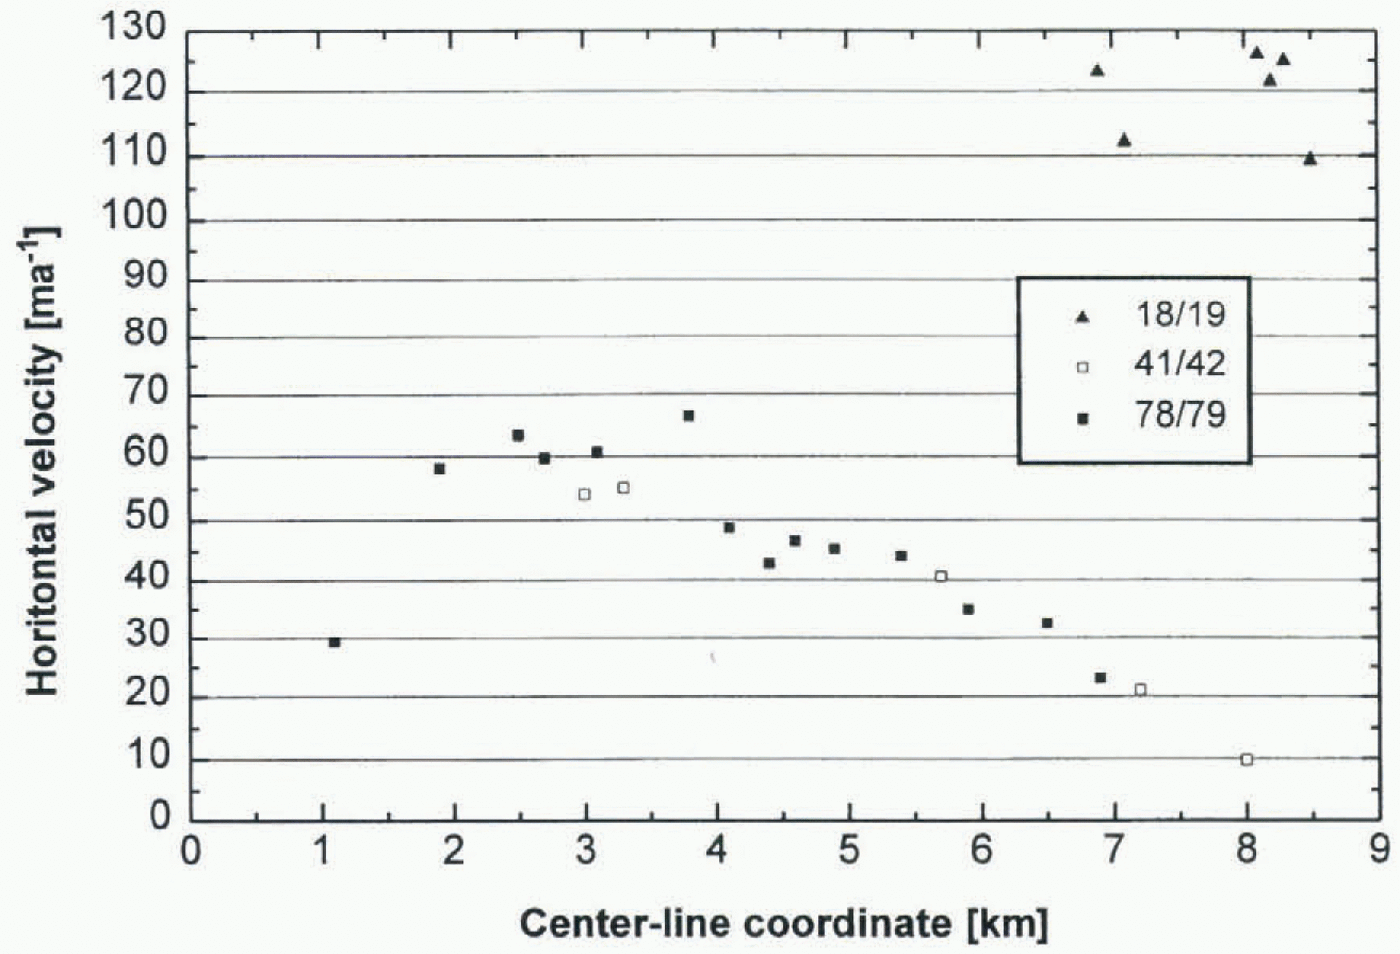
is called the emergence velocity in the ablation area and the submergence velocity in the accumulation area, In order to calculate the emergence velocity, it is necessary to know-either the elevation change ?h/?t and specific mass balance b or the horizontal and the vertical velocities u s and w s. We computed the emergence velocity by means of the second method, because it is much more accurate in our opinion. The result of the stakes available can be seen in Figure 6. The enormous amounts of emergence velocity around 1977 led to an increase in ice thickness of about 3 m at “Linie 6”; “Linie 3” however, has still sunk in. Today, HEF is far from a steady state (Holmlund, 1988), because the mean emergence velocity and the mean ablation in the lower part of HEF differ by about 4–5 m year−1. A horizontal flow convergence of about 0.1 per year was computed from data of Figure 7. In this figure the distribution of horizontal velocity at the center line once more points out the unique event in 1918–19.
The emergence velocity of Hintereisferner from 1957–58 to 1991–92. Only data in the ablation area are available, therefore only positive values can be seen in the graph. Notice the relatively great variance of emergence velocity over the whole period. Today the values amount to about 1 m year in the lower part of the glacier.
Longitudinal distribution of horizontal velocity at the center line for three years with rapid flow.
The 100 Year Series
No measurements of velocity or elevation have been performed at a fixed point on the glacier over the whole period of 100 years, with the exception of the stone lines from 1932 onwards. In order to get a 100 year series of velocity, mean values of speed at or close to sites 4.6 and 8 km were used, and plotted in Figure 3. The profile “Linie 3”did not endure long enough to complete the 8 km series until 1994. The increase in speed at “Linie 3” in the early 1980s may in fact be due to the slipping of the stones over the relatively steep surface at the front of the glacier.
During this 100 year record, the length of HEF decreased by more than 20%, and its thickness along the flow-line varied so much that velocity values at a fixed location are not directly comparable.
Conclusion
Schlosser (1997) proves that it is possible to simulate the front positions of HEF from 1855 to 1994 by means of an ice-flow model. While the front positions observed and the front positions of the model are in very good agreement, the model cannot reproduce the small advance in 1922 and the other velocity peaks by application of the conventional sliding laws. When comparing the observed and the mapped longitudinal profiles for 1920 and 1979 with those of the equilibrium flow model of Schlosser (1997), we found that at equal length the model produces flatter end sections. It is again obvious from such a comparison that the mode of flow during the accelerated phases differs basically from that in the quiescent phases (Kuhn and others, 1996).
What we know is that all three phases of accelerated flow have been initiated by several years of positive mass balance. The increase in horizontal velocity until 1919 and until 1943 was then nearly independent of the mass balance. Once the ice reserves of a glacier are exhausted, several years of positive mass balance are not sufficient to change the mode of flow.
An increase in ice thickness alone can also not explain the enormous increase in surface velocity. Only sliding is able to contribute a major part towards the total amount of the measured speed during accelerated flow.
Because of newly opened crevasses during an increased movement, new water input and altered storage inside the glacier could be the cause of fluctuations of basal speed. Mass balance alone can also change the water input and therefore the basal motion, directly (Heinrichs and others, 1996). Another possible explanation is that small changes in elevation and therefore in shear stress lead to a large change in sliding motion. This implies that the bed is extremely sensitive to stress, far more than according to the known sliding laws (Iken and Bindschadler, 1986; Jansson, 1995). In addition, we do not know how far the drainage network influences the sliding at the bed.
Summing up, we have to conclude that we do not know the reason for and the physical details of the motion of the three acceleration events observed. The precision surveys of the motion of HEF and of nearby Kesselwandferner will be continued until their next advances.
Acknowledgements
This investigation has been sponsored by the National Committee for the International Geosphere–Biosphere Program at the Austrian Academy of Science.