Introduction
The nitrogen-vacancy (NV) center in diamond has emerged as an important system for quantum sensing applications. This atomic-level defect displays a remarkable range of properties, including sustained fluorescence,Reference Gruber, Dräbenstedt, Tietz, Fleury, Wrachtrup and Von Borczyskowski 1 long quantum coherence times under ambient conditions,Reference Balasubramanian, Neumann, Twitchen, Markham, Kolesov, Mizuochi, Isoya, Achard, Beck, Tissler, Jacques, Hemmer, Jelezko and Wrachtrup 2 and demonstrated biocompatibility.Reference Vaijayanthimala, Tzeng, Chang and Li 3 – Reference Fang, Vaijayanthimala, Cheng, Yeh, Chang, Li and Chang 5 Nanoscale ambient magnetometry using single NV spins has been demonstrated experimentally in controlled environmentsReference Balasubramanian, Chan, Kolesov, Al-Hmoud, Tisler, Shin, Kim, Wojcik, Hemmer, Krueger, Hanke, Leitenstorfer, Bratschitsch, Jelezko and Wrachtrup 6 – Reference Schoenfeld and Harneit 8 with reported AC sensitivitiesReference Balasubramanian, Neumann, Twitchen, Markham, Kolesov, Mizuochi, Isoya, Achard, Beck, Tissler, Jacques, Hemmer, Jelezko and Wrachtrup 2 of 4 nT Hz–1/2. Wide-field imaging using NV emsemblesReference Steinert, Dolde, Neumann, Aird, Naydenov, Balasubramanian, Jelezko and Wrachtrup 9 has recently demonstrated sensitivityReference Pham, Sage, Stanwix, Yeung, Glenn, Trifonov, Cappellaro, Hemmer, Lukin, Park, Yacoby and Walsworth 10 at 100 nT Hz–1/2. By implementing dynamical decoupling control, it may be possible to extend the sensitivity even further (e.g., to the pT Hz–1/2 level using the Uhrig scheme).Reference Hall, Hill, Cole and Hollenberg 11 Optical absorption-based techniques at low temperatures (75 K) also show great promise with demonstrated sensitivities down to 7 nT Hz–1/2.Reference Acosta, Bauch, Jarmola, Zipp, Ledbetter and Budker 12 For random magnetic field fluctuations in biological contexts, it has been proposed that probing the quantum decoherence time of the NV system in situ could enable direct noninvasive monitoring of processes at the nanoscale.Reference Cole and Hollenberg 13 , Reference Hall, Cole, Hill and Hollenberg 14
In this article, we review some recent work on applications of NV magnetometry in biology, such as fluorescence tracking, noninvasive ion-channel detection, and neuronal network imaging, and discuss the opportunities and potential for nanoscale tracking, sensing, and imaging.
The NV center as a fluorescent biomarker in vitro and in vivo
Fluorescent nanoparticles have been lighting the way in biology for decades, providing great insight into the complex processes and mechanisms occurring at the intracellular level. Modern biomarkers exist in many forms, such as fluorescent proteins, organic dyes, quantum dots, and single molecules, and while these markers have been effective in illuminating biological processes, they often lack the desirable feature of photostability over arbitrarily long time scales. Over the past decade, there has been significant interest in the fluorescent properties offered by a new family of biomarkers in the form of optical defects in diamond. Color centers in diamond are photostable down to crystal sizes <10 nm,Reference Bradac, Gaebel, Naidoo, Sellars, Twamley, Brown, Barnard, Plakhotnik, Zvyagin and Rabeau 15 , Reference Tisler, Balasubramanian, Naydenov, Kolesov, Grotz, Reuter, Boudou, Curmi, Sennour, Thorel, Borsch, Aulenbacher, Erdmann, Hemmer, Jelezko and Wrachtrup 16 and the chemically inert diamond matrix is optically transparent and exhibits low cytotoxicity.
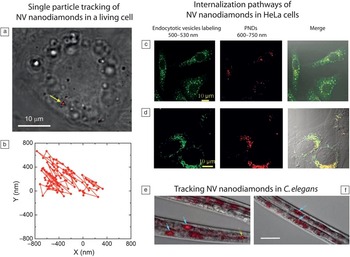
The optical properties of the NV center in particular are well suited for biomarking applications, with convenient optical excitation from 514–560 nm, and emission in the near infrared (637–800 nm) away from most autofluorescent cell components such as flavins, nicotinamide adenine dinucleotides, collagens, and porphyrins. The luminescence from a single NV center is comparable to that observed from a single quantum dot,Reference Faklaris, Garrot, Joshi, Boudou, Sauvage, Curmi and Treussart 17 and considering that a single nanodiamond (ND) on the order of 30 nm is capable of hosting multiple NV centers, the brightness and stability of these diamonds become suited to single particle tracking (SPT) of NDs within cellsReference Fu, Lee, Chen, Lim, Wu, Lin, Wei, Tsao, Chang and Fann 18 , Reference Chang, Lee, Chen, Chang, Tsai, Fu, Lim, Tzeng, Fang, Han, Chang and Fann 19 (see Figure 1 ).
Examples of fluorescent tracking of nitrogen-vacancy (NV) centers in nanodiamonds (NDs). (a–b) 35 nm NV-NDs in a live HeLa cell and the corresponding trajectory of a single NV-ND, indicated by the yellow arrow. Reproduced, in part, with permission from Reference Reference Mohan, Chen, Hsieh, Wu and Chang4. (c–d) Co-localization studies of NDs with (c) early endosomes and (d) lysosomes. The NDs co-localized with endosomes or lysosomes appear in yellow in the merged fluorescence scans. Reproduced, in part, with permission from Reference Reference Fu, Lee, Chen, Lim, Wu, Lin, Wei, Tsao, Chang and Fann18. (e–f) In vivo tracking of NV-NDs in C. elegans. The images show worms fed with fluorescent NDs with either a (e) dextran-coating or a (f) bovine serum albumin-coating. Reproduced, in part, with permission from Reference Reference Faklaris, Joshi, Irinopoulou, Tauc, Sennour, Girard, Gesset, Arnault, Thorel, Boudou, Curmi and Treussart21. PNDs, photoluminescent nanodiamonds.

Investigations into particle/cell interactions and the internalization pathways of single NDs hosting NVs with human HeLa cells showed a relatively high co-localization of endosomes (intracellular vesicles) and agglomerated NDs (Figure 1c–d).Reference Faklaris, Garrot, Joshi, Druon, Boudou, Sauvage, Georges, Curmi and Treussart 20 , Reference Faklaris, Joshi, Irinopoulou, Tauc, Sennour, Girard, Gesset, Arnault, Thorel, Boudou, Curmi and Treussart 21 Although interestingly, transmission electron microscopy found that NDs less than 10 nm in size exhibit a low co-localization with the intracellular vesicles. This is an extremely promising result for the exploration of NDs as drug delivery vehicles, since it is common for nanoparticles to become trapped in endosomes, preventing them from delivering the attached drug, DNA, or protein. Faklaris and co-workers have also demonstrated improved image contrast of NDs in HeLa cells through time-gated detection of the NV center fluorescence.Reference Faklaris, Garrot, Joshi, Druon, Boudou, Sauvage, Georges, Curmi and Treussart 20 In a separate study, Chang and co-workers demonstrated for the first time long-term SPT in all three dimensions in HeLa cells using the stable emission from NV.Reference Chang, Lee, Chen, Chang, Tsai, Fu, Lim, Tzeng, Fang, Han, Chang and Fann 19
In vivo studiesReference Mohan, Chen, Hsieh, Wu and Chang 4 of NDs containing NVs have been carried out in the model organism Caenorhabditis elegans nematode (roundworm) to explore the nano-biointeractions between the ND and organism (Figure 1e–f). NDs were introduced into wild-type C. elegans by either feeding them with a colloidal ND solution with multiple NV centers per particle or microinjecting the ND suspension into the gonads of the worms. The successful incorporation of NDs into the second generation of the organism showed that the entire embryonic development of the ND-containing embryos appeared to be normal.Reference Mohan, Chen, Hsieh, Wu and Chang 4 The observation indicates that at this level, the NDs are biologically inert and do not cause any abnormality in cell division, differentiation, or morphogenesis during embryonic development. They also do not elicit any detectable stress response.
The NV as a bio-nanomagnetometer
The paramagnetic ground-state properties of the NV center in diamond provide a unique quantum sensing platform that ultimately might be used to probe the nanoscale intracellular environment of cells. The ground-state manifold has spin sublevels (m s = 0, +1, –1). The +1 and –1 states are degenerate in zero-field and are split from the 0 state by 2.87 GHz. An important property of the NV system is that under optical excitation, the spin levels are distinguishable by a difference in fluorescence, hence spin-state readout is achieved by purely optical means. Following the proposal of Chernobrod and Berman to use the optically detected magnetic resonance of a single spin as a nanoscale magnetometer,Reference Chernobrod and Berman 22 proposals for DC and AC detection specifically using the NV centerReference Degen 23 , Reference Taylor, Cappellaro, Childress, Jiang, Budker, Hemmer, Yacoby, Walsworth and Lukin 24 were quickly followed by experimental demonstrations.Reference Balasubramanian, Chan, Kolesov, Al-Hmoud, Tisler, Shin, Kim, Wojcik, Hemmer, Krueger, Hanke, Leitenstorfer, Bratschitsch, Jelezko and Wrachtrup 6 , Reference Maze, Stanwix, Hodges, Hong, Taylor, Cappellaro, Jiang, Dutt, Togan, Zibrov, Yacoby, Walsworth and Lukin 7 , Reference Acosta, Bauch, Jarmola, Zipp, Ledbetter and Budker 12 Generally, in these protocols, the phase accumulated by an NV spin in a magnetic field is converted to a population difference between the spin levels. Given that the population of the m s= 0 state is proportional to the NV fluorescence under optical excitation, measurement of this fluorescence determines the phase accumulated and hence the magnetic field strength.
The sensitivity of the NV center as a magnetometer is primarily governed by the transverse spin relaxation time T 2 of the spin levels,Reference Degen 23 – Reference Budker and Romalis 25 which can be measured by microwave-driven spin-echo sequences, and is relatively long even at room temperature. Type 1b diamond is typically T 2 times of ∼15 μs,Reference Rabeau, Stacey, Rabeau, Prawer, Jelezko, Mirza and Wrachtrup 26 however, t2 = 1.8 ms has been demonstrated in isotopically engineered diamond. These times may be further extended using dynamical decoupling (see the article by Hong et al.),Reference Hall, Hill, Cole and Hollenberg 11 , Reference de Lange, Wang, Ristè, Dobrovitski and Hanson 27 – Reference Ryan, Hodges and Cory 29 hence multi-pulse magnetometryReference Hall, Hill, Cole and Hollenberg 11 , Reference Taylor, Cappellaro, Childress, Jiang, Budker, Hemmer, Yacoby, Walsworth and Lukin 24 offers increased sensitivity, as recently demonstrated experimentally.Reference Naydenov, Dolde, Hall, Shin, Fedder, Hollenberg, Jelezko and Wrachtrup 28 , Reference de Lange, Ristè, Dobrovitski and Hanson 30
Many important biological and condensed matter systems exhibit non-sinusoidal fluctuating magnetic fields with extremely low or zero mean values, meaning that detection protocols based on the presumption of either DC or AC field dynamics will not be applicable. In Reference Reference Cole and Hollenberg13, the authors proposed using the change in decoherence (both T 1 and T 2 modes) of the NV as the primary sensing mechanism. By probing the decoherence rate of a spin qubit placed in a noisy environment, one can characterize the underlying fluctuation rates and root-mean-square field strengths that would be otherwise inaccessible.Reference Hall, Cole, Hill and Hollenberg 14 A similar scheme for detecting spin noise using a modified control sequence was proposed in Reference Reference Ryan, Hodges and Cory29. Related to this idea is the proposal to detect nuclear spin dimers through the modulation of the spin-echo envelope due to their mutual spin fluctuations.Reference Zhao, Hu, Ho, Wan and Liu 32 These decoherence-based sensing methods may provide a useful addition to the toolbox of NV-based detection, particularly for random fields characteristic of certain biological processes. In the following, we outline two specific examples that have been proposed in this context—ion channel detectionReference Hall, Beart, Thomas, Simpson, McGuinness, Cole, Manton, Scholten, Jelezko, Wrachtrup, Petrou and Hollenberg 33 and neuronal imaging.Reference Hall, Hill, Cole, Städler, Caruso, Mulvaney, Wrachtrup and Hollenberg 34
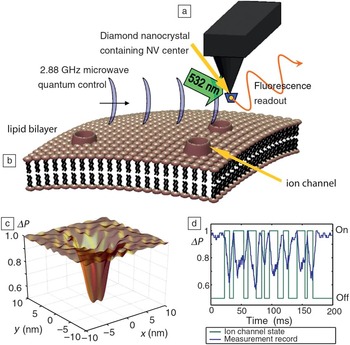
The importance of the cell membrane in biology as a critical regulator of life is reflected by the fact that the majority of drugs target membrane interactions.Reference Reimhult and Kumar 35 Ion channels control the diffusion of ions across the cell membrane,Reference Ide, Takeuchi, Aoki and Yanagida 36 while ion pumps actively create and maintain the potential gradients across the membranes of living cells.Reference Baaken, Sondermann, Schlemmer, Ruhe and Behrends 37 To monitor the effects of new drugs and drug delivery mechanisms, a wide-field ion channel monitoring capability is essential.Reference Lundstrom 38 High-resolution recording of the ionic currents flowing through a cell’s plasma membrane often employs invasive patch clamp techniques, in which a micropipette is attached to the membrane, that are difficult to scale-up. An interesting application of the NV therefore is as a noninvasive detector of ion-channel function.Reference Hall, Hill, Cole, Städler, Caruso, Mulvaney, Wrachtrup and Hollenberg 34 The proposed scheme, shown in Figure 2 , involves an NV center at the end of an AFM tip brought into close proximity to the ion channel. The conditions under which the quantum coherence of the NV center is sensitive to the flow of ions through the channel to allow real-time detection of ion channel dynamics were determined theoretically.Reference Hall, Hill, Cole, Städler, Caruso, Mulvaney, Wrachtrup and Hollenberg 34 Measuring the transverse spin relaxation time through a spin-echo sequence, the decrease in quantum coherence of the NV (seen as the reduction in fluorescence in Figure 2c–d) induced by the nuclear spins of the ion flux provides a potential monitoring capability for the ion channel system, despite the various background sources of magnetic noise.
Quantum decoherence detection of ion channel operation using the nitrogen-vacancy (NV) system. (a) A single NV defect in a diamond nanocrystal is placed on an AFM tip. The nearby cell membrane is host to channels permitting the flow of ions through the membrane. (b) The ion motion with random nuclear spin orientations results in an effective fluctuating magnetic field at the NV position, which decoheres the quantum state of the NV system. (c) A planar x–y map of the decrease in fluorescence (ΔP) associated with the decoherence of the NV, which is most pronounced in regions close to the ion channel opening. (d) Monitoring changes in NV fluorescence ΔP also permits the temporal tracking of ion channel dynamics. Reproduced with permission from Reference Reference Hall, Hill, Cole, Städler, Caruso, Mulvaney, Wrachtrup and Hollenberg34. © 2010 National Academy of Sciences.

It was shown that this decoherence-based detection method could resolve the spatial location of a given ion channel and/or temporally resolve a sequence of switch-on/switch-off events of an ion channel’s operation.Reference Hall, Hill, Cole, Städler, Caruso, Mulvaney, Wrachtrup and Hollenberg 34 With regard to scale-up to a wide-field imaging capability, a strategy using a thin sheet containing many NV centers in a bulk diamond probeReference Steinert, Dolde, Neumann, Aird, Naydenov, Balasubramanian, Jelezko and Wrachtrup 9 was considered. Such a detection mode has the potential to characterize ion channel action, and possibly other membrane proteins, over wide fields with important implications for molecular biology and drug discovery.
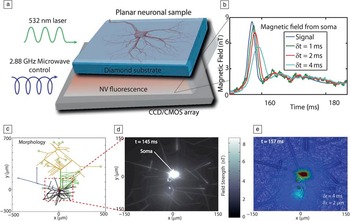
The NV center’s ability to detect nanoscale magnetic fields under ambient conditions may open up new applications in neuroscience. Techniques based on electrical detection of neuronal activity are limited in the number of locations that can be recorded simultaneously at sufficiently high spatial and temporal resolution. The NV detection method described in Reference Reference Hall, Beart, Thomas, Simpson, McGuinness, Cole, Manton, Scholten, Jelezko, Wrachtrup, Petrou and Hollenberg33 is based on noninvasive magnetic field detection and is therefore fundamentally different to approaches based on detection of electric fields. Consequently, it does not suffer from associated drawbacks such as probe positioning with respect to the Debye length and ever-present background electrical noise sources. The setup consists of a wide-field NV imaging system where neurons can be grown directly on the diamond surface containing an ensemble of NV centers ( Figure 3 a).Reference Specht, Williams, Jackman and Schoepfer 39 The ensemble is sensitive to the magnetic fields arising from the transmembrane potentials generated by the neural activity at submillisecond time scales (Figure 3b).
Schematic of a bulk-diamond nitrogen-vacancy (NV) neuronal detection system. (a) A neuronal system is grown directly on a single diamond crystal substrate with a near-surface layer of NV centers. The quantum state of the NVs is controlled via application of 2.88 GHz microwave radiation. Upon optical excitation at 532 nm, the NV centers’ spin state, and hence ensemble coherence time in response to the neuron firing, may be measured (readout) by monitoring the intensity of the emitted red light using a charge-coupled device (CCD) or complementary metal-oxide-semiconductor (CMOS) camera. (b) Simulated dynamic output from a single pixel corresponding to the neuronal magnetic field detected by the NV ensemble. (c) Morphology of a model neuron (Royeck–Wimmer model) and input excitation sites used in the simulations of the magnetic field generated as a function of time. (d) Magnetic field distribution at 100 nm standoff (i.e., NV layer position) showing a zoom of the central (somatic) activity and the reactionary dynamics in the dendritic region. (e) Simulation of the wide-field fluorescence (normalized) captured by the CCD system (where δx and δt are the spatial and temporal resolutions, respectively) corresponding to the magnetic field distribution in (d). Image reproduced, in part, with permission from Reference Reference Hall, Beart, Thomas, Simpson, McGuinness, Cole, Manton, Scholten, Jelezko, Wrachtrup, Petrou and Hollenberg33. © 2012 Nature Publishing Group.

The magnetic field of a physical neuron model (the hippocampal CA1 pyramidal neuron) has been simulated with reference to the NV detection scheme (Figure 3c–d).Reference Hall, Beart, Thomas, Simpson, McGuinness, Cole, Manton, Scholten, Jelezko, Wrachtrup, Petrou and Hollenberg 33 The scheme was shown to have the ability to capture the transmembrane potential activity in a series of near real-time images of the associated magnetic field, with spatial resolution at the level of the individual neural compartments (Figure 3e). Thus the wide-field NV imaging system has the potential to provide new insight into the key components of neuronal network activity at simultaneous micron and millisecond level resolution with the potential to scale-up to large network regions.
Quantum measurement and orientation tracking of fluorescent nanodiamonds inside living cells
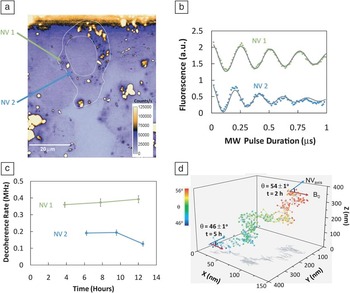
The first proof-of-principle experiments toward using an NV center as a magnetometer in a biological system were carried out by tracking single-spin NV probes in living HeLa cells ( Figure 4 ) and applying a resonant microwave field to monitor the quantum properties of the NV system over many hours.Reference McGuinness, Yan, Stacey, Simpson, Hall, Maclaurin, Prawer, Mulvaney, Wrachtrup, Caruso, Scholten and Hollenberg 40 Both Rabi (continuous microwave driving) and spin-echo measurements were made on two NV centers in distinct NDs over many hours, showing that the suite of quantum measurements required for magnetometry could be performed on biological systems without obvious degradation of the target. Given that the strain conditions in each ND are unique, the optically detected magnetic resonance (ODMR) spectra were shown to be a potential “barcode” identifier for the NDs of interest. Monitoring the Rabi period over the cell timeline (>10 hours) indicated that one ND was rotating while the other was relatively fixed in space (Figure 4b). Also, in a first attempt at decoherence sensing in this environment, the T 2 time of the NV centers was monitored, showing a change over the lifetime of the cell (Figure 4c). In a separate experiment, a NV-ND in a HeLa cell was tracked, and the ODMR spectrum was measured continuously (Figure 4d). From the change in Zeeman splitting, it was shown that the orientation of such a ND could be determined to within an accuracy of 1 degree in a fluorescence acquisition time of order of 100 ms.
Quantum measurement of nitrogen-vacancy (NV) spin probes in a living cell. (a) Confocal image of a HeLa cell (outlined) with two identified NV centers in distinct nanodiamonds. (b) Typical Rabi measurement on each NV center showing quantum coherent oscillations. (c) Progression of the spin-echo dephasing rate of each center as a function of the cell timeline. (d) Combined tracking/orientation data obtained from continuous monitoring of the fluorescence and optically detected magnetic resonance spectrum of a NV-nanodiamond in a HeLa cell over several hours. Reproduced with permission from Reference Reference McGuinness, Yan, Stacey, Simpson, Hall, Maclaurin, Prawer, Mulvaney, Wrachtrup, Caruso, Scholten and Hollenberg40. © 2011 Nature Publishing Group.

Conclusion
Recent progress on both theoretical and experimental fronts indicates that the nitrogen-vacancy (NV) system has a fortuitous convergence of physical properties that make it ideal for biological imaging and detection applications. The first experiments in NV nanobiomagnetometry demonstrate that the combination of high precision fluorescence tracking and quantum measurement is compatible with cell viability, and that quantum coherence is maintained within the complex electromagnetic intracellular environment. These results indicate that an NV probe, either used in a passive decoherence-sensing mode or in conjunction with magnetic resonance protocols, could provide valuable new information about the dynamics of the probe’s motion and its surroundings within a living cell. In addition, the diamond surface lends itself to a range of functionalization possibilities.Reference Meinhardt, Lang, Dill and Krueger 41 As such, it may soon be possible to employ NV centers to measure specific fundamental subcellular properties and processes, a few examples of which have been outlined here.