
I. INTRODUCTION
Metallic glasses (MGs) exhibit high yield strength, large elastic strain, and excellent wear resistance, Reference Ashby and Greer1–Reference Greer and Ma3 but show limited plasticity and often fail catastrophically by forming shear bands especially under tension. Reference Zhang, Eckert and Schultz4–Reference Greer, Cheng and Ma6 The incorporation of crystalline phases into MGs can hinder the propagation of shear bands and promote the formation and multiplication of shear bands, and thus increase the ductility of metallic glass composites (MGc). Reference Choi-Yim and Johnson7–Reference Chen, Cheng and Liu11 The tensile ductility of ZrTi-based bulk metallic glass composites (BMGc) can exceed 10% strain by the introduction of crystalline dendrites. Reference Hofmann, Suh, Wiest, Duan, Lind, Demetriou and Johnson12 The motif of adding ductile crystalline phases into MGs to enhance ductility also works for thin film metallic glass composites (TFMGc). Reference Kim, Jang and Greer13–Reference Knorr, Cordero, Lilleodden and Volkert19 For instance, Cu 35 nm/amorphous CuZr 5 nm multilayer film can attain ∼14% tensile ductility. Reference Wang, Li, Hamza and Barbee20 The constraint induced by crystalline phases on MGs can enhance plasticity of MGs under tension, Reference Nieh and Wadsworth17,Reference Wang, Li, Hamza and Barbee20 compression, Reference Guo, Jägle, Yao, Maier, Korte-Kerzel, Schneider and Raabe14,Reference Liu, Huang, Chou, Lai, Lee and Nieh21 or bending, Reference Donohue, Spaepen, Hoagland and Misra15 but the effects of volume fraction of crystalline phase on fracture behaviors of MGs under tension are less well understood especially at nanoscale.
Meanwhile micropillar compression tests are proved to be a suitable method to study the deformation behaviors of MGs. Reference Yoo, Kim, Kim, Choi, Shim, Tsui, Bei, Ramamurty and Jang22–Reference Liu, Lee, Lai and Huang26 Compression results show that the yield strength of MGs increases and the deformation mode changes from “highly localized” (shear band formation) to “homogeneous” with decreasing diameter of MGs. Reference Jang, Gross and Greer23,Reference Volkert, Donohue and Spaepen24,Reference Bharathula, Lee, Wright and Flores27 Via in situ compression technique, stress–strain behaviors can be directly correlated to deformation events, permitting the exploration of underlying deformation mechanisms.
Investigation of fracture mode and fracture surface can reveal deformation and fracture mechanisms, and thus can help to design materials with improved plasticity and fracture toughness. Reference Sun and Wang28–Reference Spaepen33 The fracture surface of MGs typically has single or sporadic shear bands, manifestation of brittle fracture, and plastic deformation is highly localized in a limited number of shear bands. Reference Sun and Wang28,Reference Narasimhan, Tandaiya, Singh, Narayan and Ramamurty30,Reference Gu, Poon, Shiflet and Lewandowski34 The rapid propagation of few shear bands dissipates little energy, and MGs only accommodate scant plasticity after yielding. There are scattered examples that show, however, by optimizing composition, some monolithic MG can sustain 160% true strain under compression Reference Liu, Wang, Wang, Pan and Wang35 ; and certain BMGc with second phases shows necking under tension. Reference Hofmann, Suh, Wiest, Duan, Lind, Demetriou and Johnson12 In these rare examples of ductile fractures, the fracture surface of MGs usually contains abundant intersecting shear bands which delocalize strain and accommodate plasticity. Reference Hofmann, Suh, Wiest, Duan, Lind, Demetriou and Johnson12,Reference Liu, Wang, Wang, Pan and Wang35 Bei et al. Reference Bei, Xie and George36 showed that plastic strain of Zr-based BMG increases with increasing density of shear bands under compression. Fracture surface of certain MGs contains high-density, tangled shear bands, and vein patterns (dimples), indicating greater plasticity. Reference Xu, Ramamurty and Ma37–Reference Lewandowski, Wang and Greer39
In this study, numerous Cu/amorphous CuNb (referred to as Cu/a-CuNb hereafter) multilayers on polyimide substrates were tested under tension. In parallel in situ micropillar compression tests were performed to evaluate the plasticity of MGc. To avoid the effect of sample size, the thickness of a-CuNb in single layer and crystalline/amorphous (C/A) multilayer is kept the same (2 µm). Our studies show that, by deliberately tailoring the individual layer thickness and architecture of the C/A multilayeres, the plasticity of a-CuNb is significantly enhanced as evidenced by the formation of dimples on fracture surface. In situ micropillar compression studies show that MGs in multilayers can deform substantially via shear delocalization.
II. EXPERIMENTAL PROCEDURES
Cu/a-CuNb multilayers were deposited by direct current magnetron sputtering on silicon and polyimide (Dupont™ Kapton, Type HN, DuPont, Wilmington, Delaware) substrates. The polyimide substrates (with 25.4 µm thickness) were precut into dog-bone geometry with a dimension of 7 × 26 mm and a gauge area of 3 × 8 mm. The a-CuNb layer was co-sputtered with an atomic composition of Cu50% Nb50%. The sputter chamber was evacuated to a base pressure better than 1 × 10⁻⁷ torr, and 1–3 mtorr Ar was used during deposition. Tensile tests were operated on a Shimadzu tensile tester (AGS-X series, Shimadzu Corporation, Kyoto, Japan) at a strain rate 6 × 10⁻³ s−1 and special grips were used to avoid slippage of samples during testing. The load cell used in this study has a capacity of 1000 N with a precision of ±0.5 N. Micropillars were fabricated by focused ion beam (FIB) technique from films on silicon substrates by using an FEI Quanta 3D FEG dual-beam scanning electron microscope (FEI, Hillsboro, Oregon). In situ micropillar compression tests were performed by a Hysitron PI 87 XR SEM PicoIndenter® (Hysitron, Minneapolis, Minnesota) at room temperature inside the same microscope. For each sample, at least five pillars were compressed to ensure repeatability. An FEI Tecnai G2 F20 (FEI, Hillsboro, Oregon) microscope operated at 200 kV was used to carry out transmission electron microscopy (TEM) experiments. X-ray diffraction (XRD) patterns were acquired on a diffractometer (Empyrean 2, PANalytical, Almelo, Netherlands).
III. EXPERIMENTAL RESULTS
A. Microstructure characterization
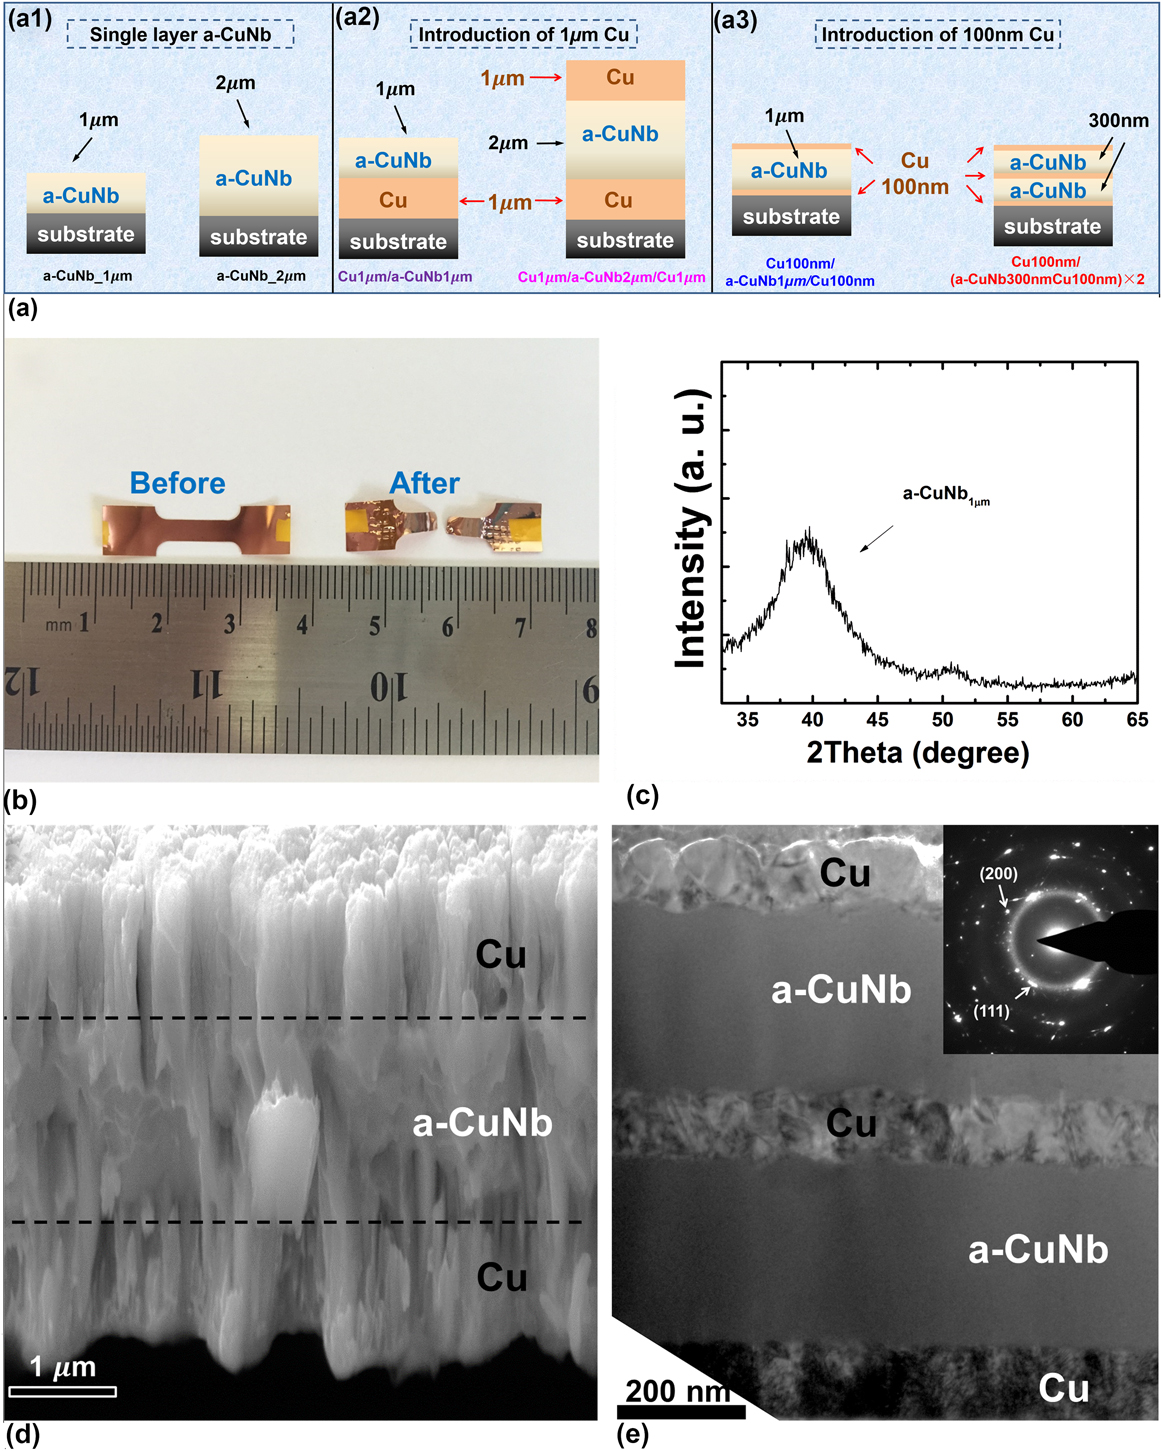
Figure 1(a) illustrates the architectures of several as-deposited films: 1 and 2 µm thick single layer a-CuNb films [Fig. 1(a1)]; Cu1 µm/a-CuNb1 µm bilayer and Cu1 µm/a-CuNb2 µm/Cu1 µm trilayer [Fig. 1(a2)]; Cu100 nm/a-CuNb1 µm/Cu100 nm and Cu100 nm/(a-CuNb300 nm/Cu100 nm) × 2 [Fig. 1(a3)]. These specimens allow us to probe the influence of layer interface and dimension of a-CuNb on the plasticity of MGs.
Experimental design and microstructure of the films. (a) A schematic showing the architecture of all the films. (a1) Single layer 1 and 2 µm a-CuNb films were deposited as references; (a2) Cu/a-CuNb multilayers with 1 µm thick Cu layer; (a3) Cu/a-CuNb multilayers with 100 nm thick Cu layers. (b) An optical micrograph of Cu film on Kapton substrate before and after tensile test. (c) XRD profile shows the amorphous hump of single layer a-CuNb film. (d) A cross-section SEM image shows the microstructure of trilayer Cu1 μm/a-CuNb2 μm/Cu1 μm. (e) A cross-section TEM image demonstrates the microstructure of 5 layer film: Cu100 nm/(a-CuNb300 nm/Cu100 nm) × 2.

An optical micrograph of a typical dog-bone specimen before and after tensile test was shown in Fig. 1(b). XRD pattern shows the amorphous nature of single layer a-CuNb film [Fig. 1(c)]. Cross-section scanning electron microscopy (XSEM) image of Cu1 μm/a-CuNb2 μm/Cu1 μm [Fig. 1(d)] shows the columnar grains in Cu layer. XTEM micrograph of Cu100 nm/(a-CuNb300 nm/Cu100 nm) × 2 [Fig. 1(e)] shows featureless a-CuNb and nanocrystalline Cu layers. The C/A interface is abrupt with little sign of intermixing. The selected area diffraction pattern shows the amorphous halo from a-CuNb layers and diffraction dots from Cu grains.
B. Fracture behaviors under tension
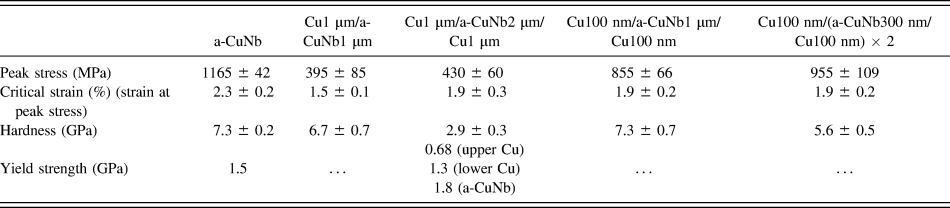
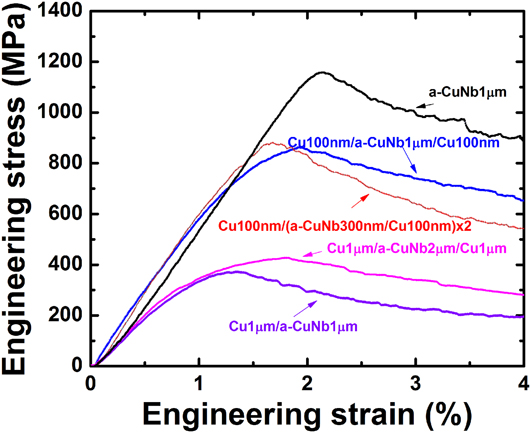
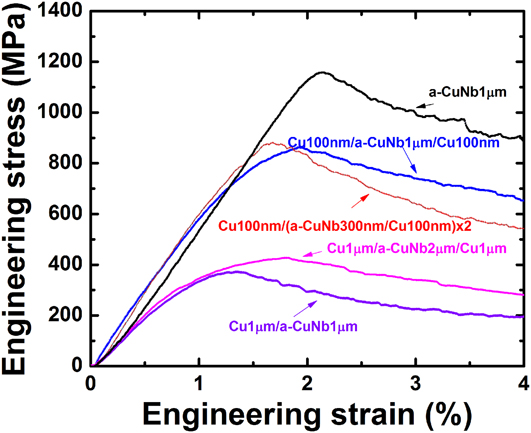
A summary of the mechanical properties of the tested films is shown in Table I. Engineering stress–strain curves of the films (Fig. 2) were obtained by subtracting the force of Kapton substrate [F
Kapton(ε)] from the applied force [F
total(ε)] on film-substrate composite using equation
 $\sigma \left( \varepsilon \right) = {1 \over {hw}}\left[ {{F_{{\rm{total}}}}\left( \varepsilon \right) - {F_{{\rm{Kapton}}}}\left( \varepsilon \right)} \right]$
, where h and w is the thickness and width of the film, respectively.
Reference Macionczyk and Brückner40,Reference Denis and Spaepen41
Single layer a-CuNb has the greatest peak stress, 1165 ± 42 MPa, and a critical strain (defined as strain at peak stress) of ∼2.3%. The peak stress of Cu1 μm/a-CuNb2 μm/Cu1 μm is 430 ± 60 MPa similar to Cu1 μm/a-CuNb1 μm, 395 ± 85 MPa, probably due to their similar volume fraction of amorphous phase (∼50%). The Cu1 μm/a-CuNb2 μm/Cu1 μm trilayer has a greater critical strain than the bilayer and the indication of this observation on fracture resistance will be discussed later. On the other hand, Cu100 nm/a-CuNb1 µm/Cu100 nm with 83% volume fraction (83 vol%) of amorphous phase has a peak stress of 855 ± 66 MPa, smaller than that of Cu100 nm/(a-CuNb300 nm/Cu100 nm) × 2 with 67 vol% of amorphous phase (955 ± 109 MPa).
Summary of the mechanical properties of the tested films.

Notes: (1) The contact depth used to determine hardness and modulus for a-CuNb1 µm/Cu1 µm/, Cu1 µm/a-CuNb2 µm/Cu1 µm, Cu100 nm/a-CuNb1 µm/Cu100 nm and Cu100 nm/(a-CuNb300 nm/Cu100 nm) × 2 is 125–250 nm, 200–400 nm, 125–225 nm, and 125–250 nm, respectively. (2) The yield strength is obtained from micropillar compression tests.
Engineering stress–strain curves of Cu/a-CuNb multilayers deposited on Kapton substrates. The stress–strain curve of single layer a-CuNb (1 μm) was added as a reference.
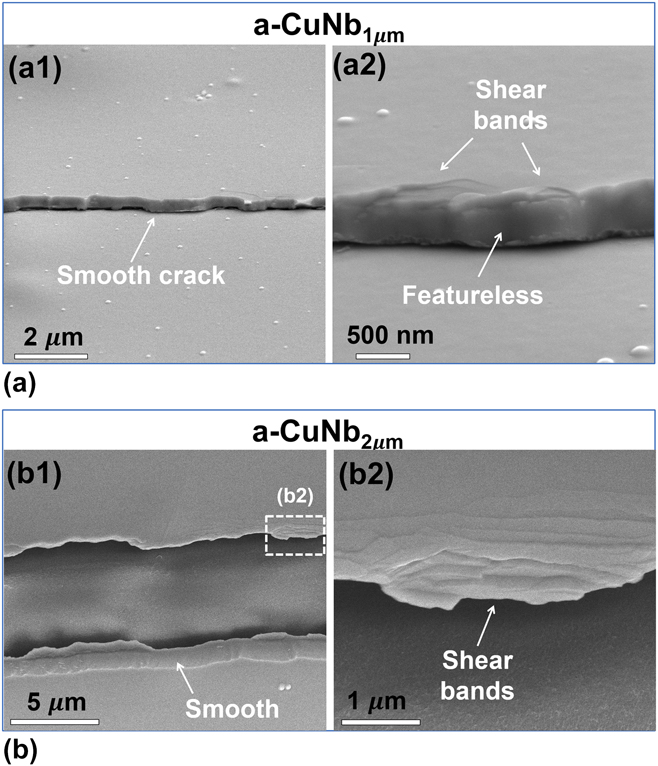
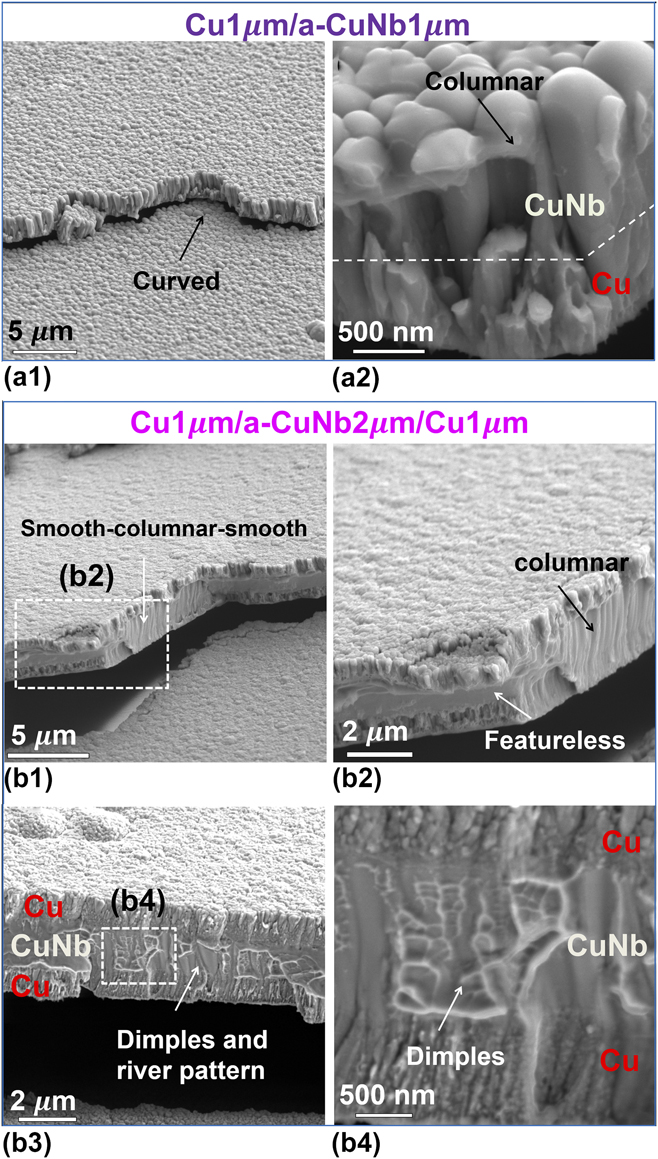
The 1 and 2 µm thick single layer a-CuNb films (Fig. 3) have smooth and featureless fracture surface with multiple shear bands. In comparison, the fracture morphology of the Cu1 µm/a-CuNb1 µm bilayer has wavy (curved) fracture path and rough (columnar-like) fracture surface [Fig. 4(a1)]. A magnified micrograph of the fracture surface [Fig. 4(a2)] shows that the column sizes in a-CuNb are larger than those in Cu. The Cu1 µm/a-CuNb2 µm/Cu1 µm trilayer fractures along a rough path with frequent turns, and the fracture surface of a-CuNb has mixed morphology [Fig. 4(b)]. Figures 4(b1) and 4(b2) show that a crack propagated in a zig-zag way relative to the tensile direction. Also it is unusual to observe nanoscale dimples/river patterns (average dimple dimension of ∼106 nm) in 2 µm thick a-CuNb in trilayer [Figs. 4(b3) and 4(b4)], in drastic contrast to the featureless fracture surface of 2 µm single layer a-CuNb.
SEM micrographs comparing tensile fracture surfaces of single layer 1 μm (a) and 2 μm (b) a-CuNb films. (a1) An SEM image shows a representative smooth crack of 1 μm thick a-CuNb. (a2) Higher magnification SEM image reveals the featureless fracture surface and shear bands. (b1) An SEM image shows the smooth fracture surface of 2 μm thick a-CuNb. (b2) Higher magnification SEM image from the dashed box in (b1) reveals high-density shear bands.

Comparison of fracture surfaces between multilayers in which 1 μm thick Cu layer was introduced. (a1) An SEM image shows a typical crack in Cu1 μm/a-CuNb1 μm bilayer film. Curved crack path was frequently observed. (a2) The higher magnification SEM image shows that both Cu and a-CuNb layers have columnar-like fracture surface, and Cu has a smaller columnar feature size. (b1) A representative SEM image shows a crack in the trilayer Cu1 μm/a-CuNb2 μm/Cu1 μm and the crack frequently changes its path during propagation in a direction perpendicular to the tensile direction. (b2) Higher magnification SEM image [dashed box in (b1)] shows the coexistence of featureless and columnar-like surface for the trilayer system. (b3) An SEM image shows a region of the same specimen in which the fracture surface of a-CuNb layer is filled with dimples and river patterns. (b4) Higher magnification SEM image [dashed box in (b3)] shows the nanoscale dimples in a-CuNb layer along its 2 µm thickness direction.

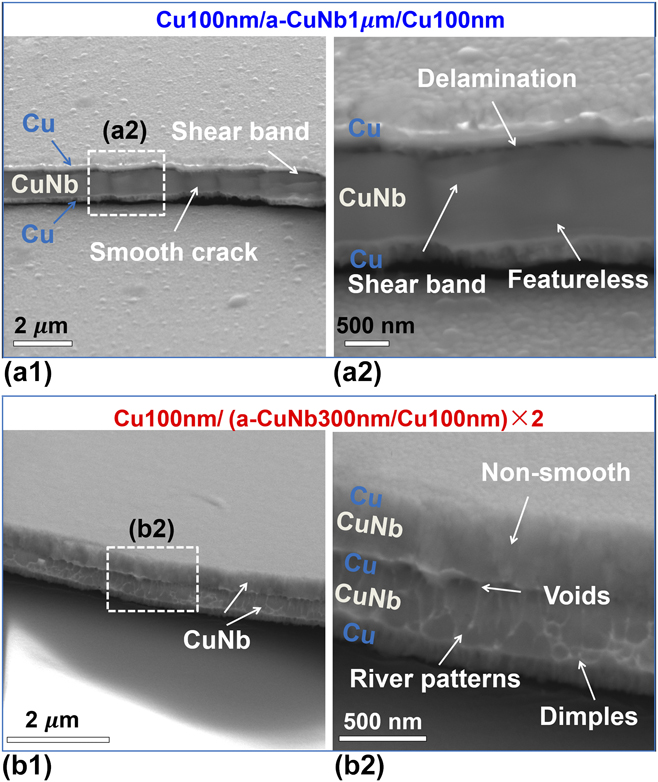
Sandwiching 1 µm thick a-CuNb with 100 nm Cu has little influence on plasticity of 1 µm a-CuNb. The fracture surface of Cu100 nm/a-CuNb1 µm/Cu100 nm shown in Fig. 5(a1) is featureless and contains clear shear bands. A magnified view [Fig. 5(a2)] reveals that the upper layer interface delaminates after tests. In comparison, the fracture surface of Cu100 nm/(a-CuNb300 nm/Cu100 nm) × 2 [Figs. 5(b1) and 5(b2)] shows that the lower a-CuNb layer is full of ductile dimples and river patterns with an average dimension of ∼61 ± 22 nm, although the upper a-CuNb layer is filled with nanoscale columns (without dimples).
Comparison of fracture behaviors between multilayers in which 100 nm thick Cu layer was introduced. (a1) An SEM image shows the fracture surface of Cu100 nm/a-CuNb1 μm/Cu100 nm film. (a2) High magnification SEM image of the dashed box in (a1) shows the featureless fracture surface of a-CuNb layer. Delamination between the top Cu and a-CuNb layers happened and a gap between them was observed. (b1) An SEM image shows the fracture surface of Cu100 nm/(a-CuNb300 nm/Cu100 nm) × 2 film. (b2) High magnification SEM image of the dashed box in (b1) shows that for the lower a-CuNb layer, the fracture surface contains river patterns or dimples, but the upper a-CuNb layer has a relatively smooth fracture surface. The middle Cu layer is filled with voids.

C. Fracture behaviors under micropillar compression tests
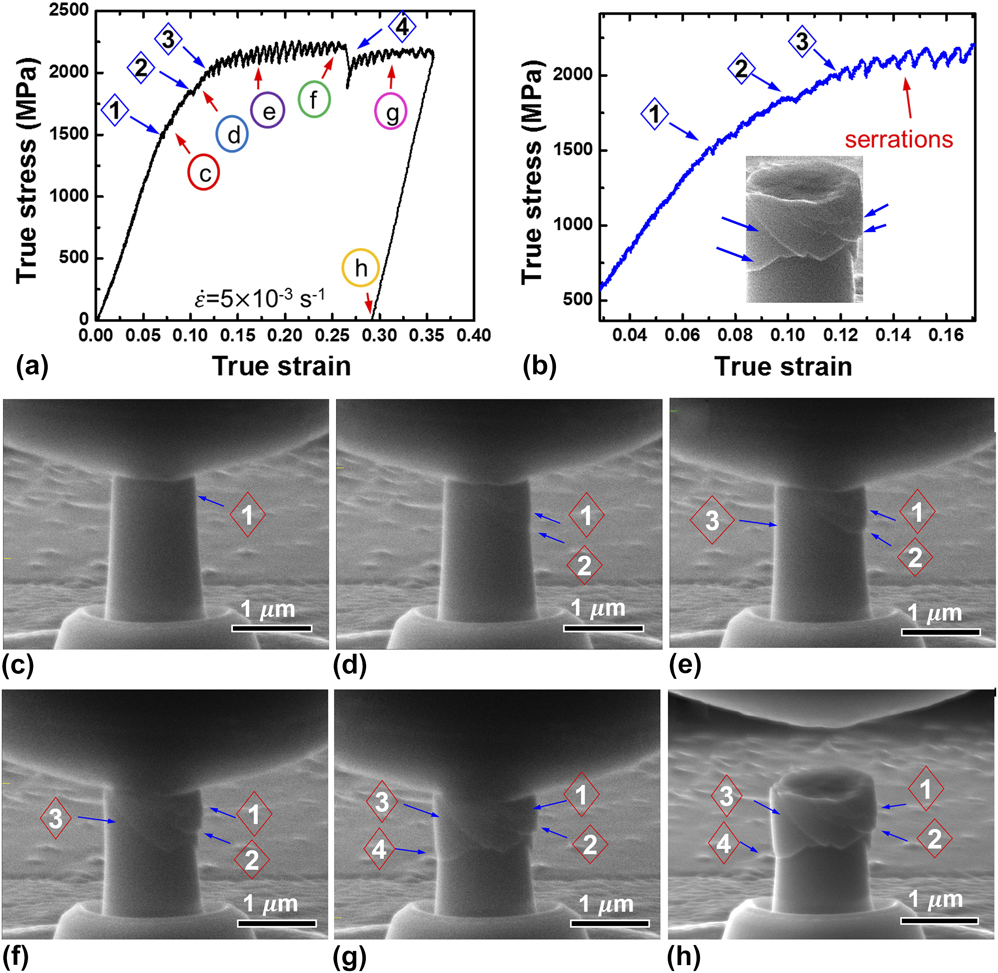
Pillar compression tests can provide a complementary approach to understand the constraint of crystalline phase on amorphous phase under different stress field and avoid the effect of polymer/film interface in the tensile tests. The aspect ratio (height/diameter) of single layer 2 µm a-CuNb and Cu1 µm/a-CuNb2 µm/Cu1 µm pillars is kept as 2:1. Representative true stress–strain curve along with in situ SEM snapshots of the single layer 2 µm a-CuNb are shown in Fig. 6 (the maximum true strain is ∼34%, see Supplementary Video 1). At point 1 marked in Figs. 6(a) and 6(b) when the stress–strain curve becomes nonlinear, the first shear band emerged [Fig. 6(c)]. The 2nd [Fig. 6(d)] and 3rd [Fig. 6(e)] shear band formed along the same direction corresponding to the two kinks in Fig. 6(b). Soon after, shear serrations became prominent, and shear bands developed quickly [Fig. 6(f)]. The 4th shear band formed in an intercepted direction [Fig. 6(g)], corresponding to a major load drop [Fig. 6(a)]. SEM image in Fig. 6(h) [inset in Fig. 6(b)] shows the intercepted shear bands after unloading.
In situ micropillar compression studies on a 2 µm thick single layer a-CuNb film. (a) True stress–strain curve under compression. Four shear bands were identified during in situ compression test and correlated well with the pop-in events (marked as number 1 to 4) on the stress–strain curve. (b) A magnified stress–strain curve shows the serrations associated with formation of shear bands. (c–h) SEM images (obtained from in situ tests) corresponding to point c–h in stress–strain curve. Prominent shear bands were identified.

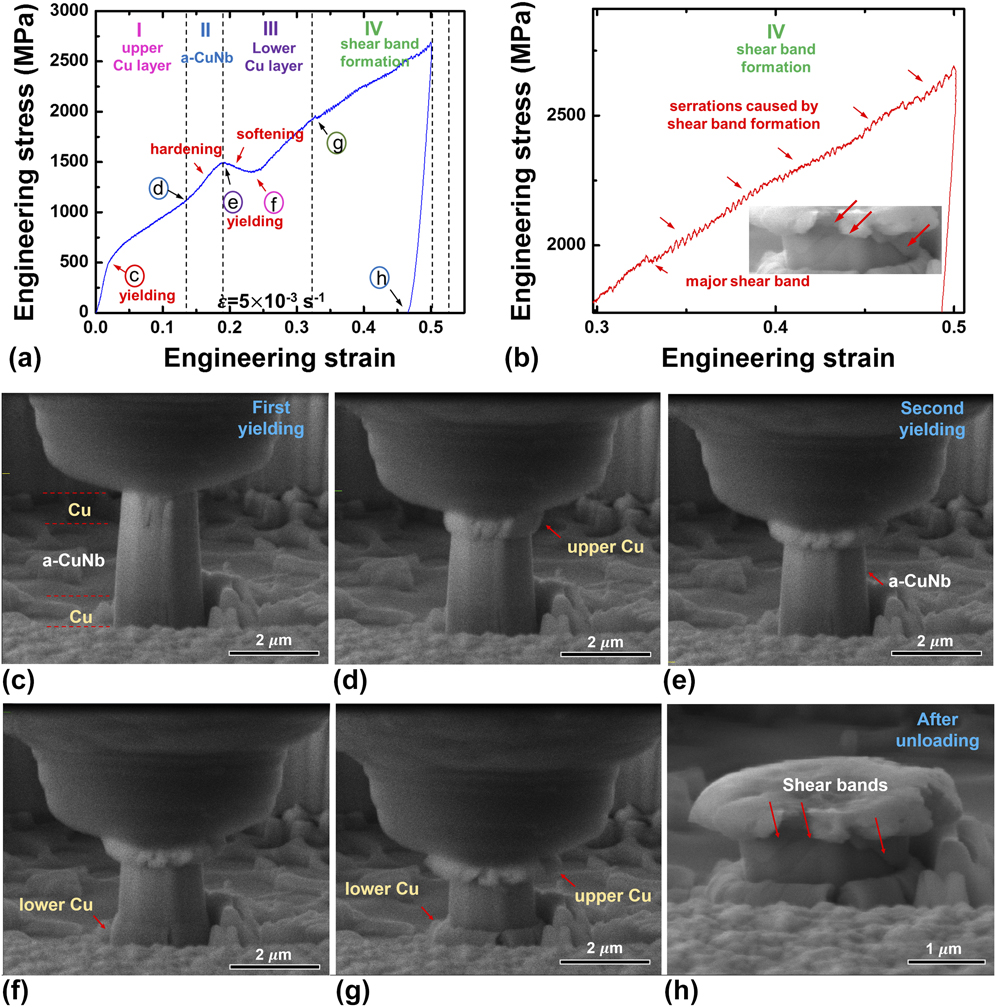
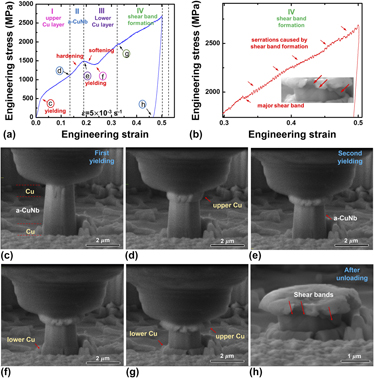
Representative engineering stress–strain curve and in situ SEM micrographs of Cu1 µm/a-CuNb2 µm/Cu1 µm are shown in Fig. 7 (since the diameter change for different layers is drastically different, an engineering stress–strain curve instead of true stress–strain curve is used). During compression test, the deformation of the trilayer pillars went through four representative stages (see Supplementary Video 2), correlated with the deformation of upper Cu layer (I), a-CuNb layer (II), lower Cu layer (III), and shear band formation (IV) [Fig. 7(a)]. Shear band formation stage (IV) can be better illustrated in Fig. 7(b), wherein prominent shear serrations can be observed. The upper Cu layer yielded at a true stress ∼0.68 GPa [Fig. 7(c), true stress was obtained by measuring the diameter of each layer from in situ SEM snapshots]. Stress kept on increasing due to work hardening of the upper Cu layer, accompanied by prominent expansion of the upper Cu layer [Fig. 7(d)]. During stage II, the stress increased at a higher rate up to 1.43 GPa (up to point e) and the diameter of a-CuNb slightly increased [Fig. 7(e)]. At stage III, the lower Cu layer started to deform significantly and the engineering stress dropped considerably [Fig. 7(f)] before increased again afterward. In stage IV, by ∼1.8 GPa (30% engineering strain), a kink was observed [Fig. 7(b)], followed by continuous serrations. Figure 7(g) shows slight dilation of the a-CuNb layer. a-CuNb then deformed through the formation of multiple shear bands shown Fig. 7(h). Eventually the two Cu layers were squeezed into a “pancake” morphology.
In situ micropillar compression studies on Cu1 μm/a-CuNb2 μm/Cu1 μm trilayer. (a) Engineering stress–strain curve of the trilayer. The stress–strain curve can be divided into four stages: I—dominant deformation of the upper Cu layer; II—hardening due to increasing elastic deformation of a-CuNb layer; III—plastic deformation of the lower Cu layer; IV—shear band formations of the a-CuNb layer. (b) A magnified stress–strain curve of regime IV clearly shows the serrations caused by shear band formations. (c–h) In situ SEM images corresponding to point c-h in the stress–strain curve. Prominent plastic deformation of the upper Cu layer is observed in (d). Plastic deformation of the lower Cu layer is observed in (f). Shear band formation in a-CuNb can be seen in (h). Obvious transition of dominant deformation at various stages can be identified.

IV. DISCUSSIONS
A. Tensile fracture behaviors of a-CuNb
The peak stress in the stress–strain curves (Fig. 2) indicates the formation of a major or sufficient number of small cracks so that the load necessary to sustain further deformation decreases with increasing strain. After reaching the peak stress, crack density (fragmentation perpendicular to the tensile direction) surges until reaching saturation. Single layer a-CuNb deforms through the formation of sporadic/primary shear bands, leaving featureless fracture surface (Fig. 3) and forming parallel straight cracks (orthogonal to the tensile loading axis). Through the introduction of 1 μm Cu, the fracture path of Cu1 μm/a-CuNb1 μm bilayer becomes wavy [Fig. 4(a)]. Moreover, the fracture surface of a-CuNb is filled with columns, which may dissipate more energy during fracture than the featureless smooth surface of the single layer a-CuNb. Prior studies show that MGs with 1–2 µm dimension typically experience inhomogeneous deformation by formation of few shear bands. Reference Volkert, Donohue and Spaepen24,Reference Jang and Greer42 Surprisingly, ductile dimples and river patterns are observed in Cu1 μm/a-CuNb2 μm/Cu1 μm [Fig. 4(b)]. The drastic change of fracture morphology (for a-CuNb) from featureless to column-like and eventually ductile dimples should arise from the constraint of Cu layers. Also sandwiching the a-CuNb with Cu on both sides (Cu1 μm/a-CuNb2 μm/Cu1 μm) is more effective to increase the fracture resistance than using Cu on one side only (Cu1 μm/a-CuNb1 μm bilayer), since shear step in amorphous layer can occur on the unconstraint side. Therefore, Cu1 μm/a-CuNb2 μm/Cu1 μm has a greater critical strain than Cu1 μm/a-CuNb1 μm (Fig. 2), which should result from better fracture resistance of the trilayer.
We now examine the influence of 100 nm Cu layer on the fracture morphology of Cu100 nm/a-CuNb1 µm/Cu100 nm and Cu100 nm/(a-CuNb300 nm/Cu100 nm) × 2. For the former film, the upper C/A interface shows decohesion after tensile test, and fracture surface of a-CuNb is featureless, similar to that of the single layer a-CuNb [Fig. 5(a)]. This observation indicates that 100 nm Cu layer is insufficient to promote plasticity of 1 µm a-CuNb. In Cu100 nm/(a-CuNb300 nm/Cu100 nm) × 2, however, both river patterns and dimples were observed in the lower a-CuNb layer [Fig. 5(b)]. Hence, the volume fraction and the layer thickness of amorphous phase clearly impact the fracture behavior of the composite. Similarly, Liu et al. Reference Liu, Huang, Chou, Lai, Lee and Nieh21 showed that, under compression, a critical thickness (volume fraction) of crystalline layer is needed to block the incipient shear bands; and Tan et al. Reference Tan, Zhang, Yang, Zhu and Zhang43 showed that ductility of laminated Ni/Fe-based MG/Ni composite increases with the increase of volume fraction of Ni, but improves little if the volume fraction of Ni is too low. The ubiquitous formation of dimples/river patterns in the lower a-CuNb layer indicates that more energy will be dissipated during fracture. The high density of dimples demonstrates strain delocalization. These river patterns could be the results of connection of shear cracks (voids) inside the materials following large plastic shear deformation and during fracture, and may be the evidence of local necking. Reference Leamy, Wang and Chen29,Reference Pampillo44
In the tensile tested Cu100 nm/(a-CuNb300 nm/Cu100 nm) × 2 specimen, although the lower a-CuNb layer has ductile dimples, the upper a-CuNb has relatively smooth fracture surface [Fig. 5(b)]. Although the fundamental mechanisms behind the different fracture morphology of the lower and upper a-CuNb in the Cu100 nm/(a-CuNb300 nmCu100 nm) × 2 film specimen are not fully understood, it is likely that the thick polyimide substrate promotes plastic deformation in the lower a-CuNb layer through polymer/film interface. The polymer substrate may store a considerable amount of elastic energy and facilitate Cu to promote shear delocalization in the lower a-CuNb layer. In contrast, once the plasticity is transferred across the upper C/A interface into upper Cu layer, the 100 nm thick Cu does not have sufficient thickness to sustain plasticity, making it inefficient to constrain shear bands in the upper a-CuNb layer. The polymer substrate effect (interface effect) may also explain the observed interface decohesion in the upper C/A interface for the Cu100 nm/a-CuNb1 μm/Cu100 nm [Figs. 5(a1) and 5(a2)], wherein no delamination occurred along the lower C/A interface. Interestingly, Liu et al. Reference Liu, Zhang and Zhang45 showed that interface delamination can inhibit crack propagation and enhance fracture toughness. It should be mentioned that Xi et al. Reference Xi, Zhao, Pan, Wang, Wu and Lewandowski38 and Wang et al. Reference Wang, Zhao, Bai, Pan, Xia, Han, Xi, Wu and Wang46 showed that brittle MGs can also have nanoscale dimples or corrugations on fracture surface. However, the current study clearly shows that the plasticity of a-CuNb can be tailored by using C/A interfaces.
Additionally, the introduction of crystalline phases also has direct impact on fracture angle (the angle between fracture plane and tensile loading direction). Single layer a-CuNb films have fracture angles varying from 45 to 90°, but on the average close to 45°, which suggests a shear fracture mode through the formation of shear bands. For the Cu1 µm/a-CuNb1 µm films, the fracture angle is close to 90°. While for the Cu1 µm/a-CuNb2 µm/Cu1 µm films, when the fracture angles are close to 90°, the fracture surface frequently shows columns; but when the fracture angle is close to 45°, the fracture surface is often filled with river patterns or becomes featureless. For the Cu100 nm/a-CuNb1 µm/Cu100 nm specimen, the fracture angle is ∼90°. For the Cu100 nm/(a-CuNb300 nm/Cu100 nm) × 2 specimens, the fracture angle is ∼45°, suggesting a shear fracture mode.
B. Plasticity and fracture of multilayers under compression
Single layer a-CuNb can achieve ∼34% true strain without failure, which is much larger than other monolithic amorphous films, such as a-CuZr. Reference Zhang, Liu, Lei, Niu and Sun25 The underlying reason could be related to the positive heat of mixing between Cu and Nb, Reference Fan, Xue, Wang, Yu, Wang and Zhang47 which will not be discussed in detail in this paper. In situ micropillar compression studies show that the 2 μm thick single layer a-CuNb deforms via forming few primary shear bands. Serrations, indication of formation of shear bands, occur at a compressive stress of ∼1.5 GPa (Fig. 6). However, as shown in Fig. 7, the a-CuNb in Cu1 μm/a-CuNb2 μm/Cu1 μm trilayer appears much more ductile. When the Cu layer deforms, high-density dislocations migrate toward the C/A interfaces, through which plasticity can be transferred into amorphous layer in a more homogeneous way, instead of localized deformation only through few shear bands in single layer a-CuNb film. The sheared regions in a-CuNb layer can reduce incoming dislocations accumulated at C/A interface and favor more homogeneous deformation. Reference Fan, Xue, Wang, Yu, Wang and Zhang47,Reference Fan, Liu, Xue, Rahimi, Bahr, Wang and Zhang48 The tendency of forming shear bands is also inhibited by the C/A interface since Cu layers can counteract the shear steps of a-CuNb by deforming elastically or plastically. As a result, shear instability in a-CuNb in the trilayer is suppressed in comparison to the single layer a-CuNb. Shear serrations in the single layer a-CuNb occurred early at a strain of ∼7% and at a stress ∼1.5 GPa. In contrast, serrations in trilayer started at ∼30% strain and a stress of ∼1.8 GPa. Also the average load drop associated with serrations is 13 ± 4 MPa for trilayer, which is much smaller than 81 ± 55 MPa for the single layer a-CuNb. Even at ∼65% true strain, the trilayer remains deformable. Clearly, the C/A laminates accommodate more plasticity with reduced shear instability, but without sacrificing strength, since the C/A trilayer shows similar flow stress compared with the single layer a-CuNb. It is worth mentioning that the decrease of serration amplitude is not a result of strain rate, Reference Schuh, Nieh and Kawamura49,Reference Jiang and Atzmon50 since all the experiments were carried out at the same strain rate, 5 × 10⁻³ s−1.
Another intriguing phenomenon is that the lower Cu layer in the Cu1 μm/a-CuNb2 μm/Cu1 μm trilayer deforms plastically at a much higher true stress, ∼1.3 GPa, than the yield strength of the upper Cu layer, ∼0.68 GPa. Although the taper angle may affect the deformation of pillar to some extent in the very early stage of deformation, but the small tapering cannot satisfactorily explain why the lower Cu layer has a much greater yield strength. Geometrically necessary dislocations could play a role in this case, Reference Nix and Gao51 since strain gradient may exist during compression. Another possible reason comes from the interface. During compression, upper Cu layer is only partially confined by the C/A interface. However the lower Cu layer is confined by the C/A interface and interface between Cu and Si substrate. A large (compressive) friction stress may develop along C/A interface, and significantly strengthen the lower Cu layer. As shown by the different yield strength of upper and lower Cu layers, the architecture of C/A nanolaminates can affect deformation behaviors. While utilizing TFMGcs in wear- or corrosion-resistant applications, the architecture of films should be considered.
It is also important to realize that the simple trilayer experiences a prominent multistage deformation. Stage I is primarily related to the plastic deformation of the upper Cu layer and elastic deformation of a-CuNb. During stage II, the work hardening rate increases, presumably due to increasing load transfer to the more rigid a-CuNb layer. The reduction of flow stress in stage III is associated with plastic yielding of the lower Cu layer. Stage IV experiences shear band formation in a-CuNb and plastic deformation of Cu. In this stage, deformation and strain hardening in crystalline layers compensate shear softening in amorphous layer, which resulted in a more stable fracture for trilayer.
C. Effect of interface and size on plasticity of MG
Interface and size effects can substantially influence the plasticity of MG. Reference Volkert, Donohue and Spaepen24,Reference Huang, Zhou, Zhang, Wang and Liu52–Reference Wang and Misra54 MGs are typically brittle and form catastrophic shear bands unless the size of MGs is under several hundred nanometers or smaller. Reference Volkert, Donohue and Spaepen24,Reference Tian, Shan and Ma55,Reference Guo, Yan, Wang, Tan, Zhang, Sui and Ma56 Monolithic MGs with larger dimension would deform by shear band formation. To form shear band, a shear step needs to be generated by shear stress. Reference Donohue, Spaepen, Hoagland and Misra15 With the existence of ductile crystalline Cu layers, the shear steps in amorphous layers can be blocked by the crystalline layers through C/A interface. The C/A interface can play an important role in transferring plasticity between the two phases and trigger more homogeneous deformation in the amorphous phase. Reference Huang, Zhou, Zhang, Wang and Liu52–Reference Wang and Misra54 Moreover, the different fracture behaviors between trilayer Cu1 μm/a-CuNb2 μm/Cu1 μm and bilayer Cu1 μm/a-CuNb1 μm demonstrate that the constraint on amorphous layer by crystalline phase on both sides is necessary to enhance the plasticity and fracture resistance of a-CuNb, since shear steps can be formed on the unconstraint side. Once surface steps are created, the rapid propagation of shear bands along the steps cannot be contained. Interface decohesion and the featureless fracture surface of the Cu100 nm/a-CuNb1 μm/Cu100 nm film indicate that the volume fraction of crystalline phases needs to be sufficiently large to counteract the shear deformation in the amorphous phase. Reduction of dimension of amorphous phase can also effectively promote shear delocalization, as manifested by dimples (river patterns) on fracture surface.
V. CONCLUSIONS
In this study, the fracture and plasticity of Cu/a-CuNb laminates were explored under both tension and compression. The incorporation of Cu can prominently promote shear delocalization in a-CuNb, which would normally have featureless brittle fracture surface. By tailoring the volume fraction of a-CuNb, the plasticity of a-CuNb can be enhanced further as shown by formation of river patterns/dimples under tension, and by substantial plasticity under compression. The Cu/a-CuNb interfaces not only promote plasticity in a-CuNb, but also significantly increase the flow stress of 1 µm thick Cu to ∼1.3 GPa.
Supplementary Material
To view supplementary material for this article, please visit https://doi.org/10.1557/jmr.2017.249.
ACKNOWLEDGMENT
We acknowledge the financial support by NSF-CMMI under Grant No. 1161978. Q. Li and S. Xue are supported by DoE-OBES under Grant No. DE-SC0010482. H.W. acknowledges the funding support from the U.S. Office of Naval Research (ONR, N00014-16-1-2778, N00014-17-1-2087). Accesses to the DOE-Center for Integrated Nanotechnologies (CINT) at Los Alamos and Sandia National Laboratories and Microscopy Imaging Center at Texas A&M University are also acknowledged.