Introduction
Salinity is an increasing problem in agriculture worldwide (Ghassemi et al., Reference Ghassemi, Jakeman and Nix1995) and the use of halophytic plants such as saltbush represents one of the few options available to revegetate salinised landscapes and re-establish grazing systems (Masters et al., Reference Masters, Benes and Norman2007). Some landholders in Australia are grazing sheep on saltbush to fill a summer/autumn feed gap (Masters et al., Reference Masters, Edwards, Sillence, Avery, Revell, Friend, Sanford, Saul, Beverly and Young2006), a period that coincides with the greater demands of late pregnancy for autumn- or winter-lambing ewes. However, feeding saltbush may possibly have a negative impact on reproductive performance of the ewes as high salt intake may reduce intake and cause physiological changes associated with adaptation to the salt load.
High salt intake has been shown to reduce voluntary feed intake (Masters et al., Reference Masters, Rintoul, Dynes, Pearce and Norman2005; Blache et al., Reference Blache, Grandison, Masters, Dynes, Blackberry and Martin2007) as well as the efficiency of energy use for production (Arieli et al., Reference Arieli, Naim, Benjamin and Pasternak1989) in sheep. A decrease either in voluntary feed intake or in fat reserves is usually associated with a decrease in the concentration of metabolic hormones such as insulin and leptin (Chilliard et al., Reference Chilliard, Delavaud and Bonnet2005) and recently a high salt ingestion has been shown by Blache et al. (Reference Blache, Grandison, Masters, Dynes, Blackberry and Martin2007) to affect energy metabolism through changes in insulin concentrations in sheep fed high salt (20% NaCl) diets. Thus, the ingestion of large amount of salt may impact energy availability and consequently reproductive performance.
There are also physiological ‘conflicts’ for pregnant ewes fed high-salt diets. Pregnancy is characterised by sodium retention and increased extracellular volume necessary for the maintenance of the mother and growth of the foetus (Davison and Lindheimer, Reference Davison and Lindheimer1989). The renin–angiotensin system (RAS) is responsible for the maintenance of water and salt balance, aldosterone-controlling sodium retention and arginine vasopressin (AVP)-controlling water re-absorption by the kidney. Therefore high salt consumption leads to changes in the RAS and decreased aldosterone concentration, which reduces sodium re-absorption and increases sodium excretion. In contrast to aldosterone, high salt intake requires no change in AVP plasma concentration if the intake of fresh water is sufficient to maintain a salt and water balance (Cowley et al., Reference Cowley, Skelton and Merrill1986). No change in AVP concentration or plasma osmolality was observed in pregnant sheep compared to non-pregnant sheep (Bell et al., Reference Bell, Laurence, Meehan, Congiu, Scoggins and Wintour1986).
Due to the potential impact on feed intake, energy availability and the potential challenge to water and salt balance induced by high salt intake, we hypothesised that high-salt diets will reduce the reproductive capacity of Merino ewes through a reduction in pregnancy rates and foetal growth (birth weight). To investigate the effect of high-salt diets on water and sodium balance, concentrations of aldosterone and AVP were measured, as these hormones are the end products of the regulatory RAS. The concentrations of leptin and insulin were also measured as indicators of changes in energy metabolism.
Material and methods
Experimental design
From the time of artificial insemination until parturition, Merino ewes were fed either a high-salt diet or a control diet containing low salt. Ewes receiving the high-salt diet were fed ad libitum, while the ewes on the control diet were fed the same amount of organic matter as their paired high-salt counterparts. The reproductive capacities of the ewes were assessed by measuring pregnancy rates, lamb birth weights and milk volume and composition. The concentrations of hormones relating to salt and water balance and energy metabolism were measured to assess the metabolic changes experienced by the ewes.
Animals
A total of 76 Merino maiden ewes, aged 2 years, and weighing on average 45 kg, were held at The University of Adelaide, Roseworthy Campus. They were allocated randomly to four small paddocks (approximately 6 m × 12 m), with 19 in each paddock. Ovulation was synchronised through the use of intravaginal progesterone sponges (40 mg; Intervet Australia Pty Ltd, Bendigo, Victoria), and 48 h after progesterone sponges were removed, ewes were artificially inseminated via laparoscopic insemination using a small volume (0.3 ml/uterine horn) of diluted fresh mixed semen from two sires (day 0). The experiment was approved by the Animal Ethics Committee of The University of Adelaide.
Experimental diets
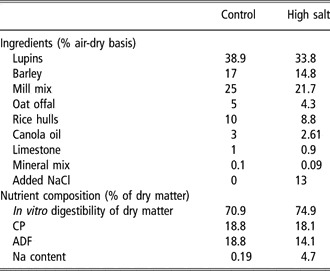
Two pelleted diets were used based on barley and lupin grain, and their ingredient composition and estimated nutrient specifications are shown in Table 1. The high-salt diet was formulated to contain NaCl at a concentration of 130 g/kg dry matter to mimic the concentration of dietary salt in animals grazing saltbush-based pastures in summer and autumn, given that saltbush contains 20% to 25% NaCl (Norman et al., Reference Norman, Dynes and Masters2002) and that over 50% of the selected diet at this time of year is saltbush (Thomas, 2006; H. C. Norman, personal communication). The diets were prepared by a commercial manufacturer (Lauckes, Murray Bridge, South Australia) and analysed for nutritive value by Feedtest®, Hamilton, Victoria. Feed was analysed for sodium concentration by inductively coupled plasma atomic emission spectrometry (Dahlquist and Knoll, Reference Dahlquist and Knoll1978) using a Spectro CIROS ICPAES machine (Waite Analytical Services, The University of Adelaide). The daily intake of metabolisable energy (ME) was calculated from organic matter intake and from the estimated ME content of the organic matter fraction of the two diets (9.6 MJ ME/kg OM).
Ingredient composition and nutrient specifications of the high-salt and control diet

Timeline
From day 0 through to day 44, ewes were grouped in paddocks. Two groups were fed the control diet and two groups were fed the high-salt diet. Each of the control groups were pair-fed with a group fed the high-salt diet (see below for pair-feeding methodology). During this time, water consumption was determined on a group basis by fitting a flow meter to the water line supplying each small holding paddock. Pregnancy diagnosis was conducted by ultrasound examination on day 44 of gestation, after which 40 single-bearing ewes (20 fed the high-salt diet and 20 fed the control diet) were placed into individual pens in an animal house. Water intake was not measured when animals were in individual pens due to a technical difficulty with flow meters. All ewes offered the high-salt diet were fed ad libitum and each day between 0800 and 0900 h, and the amount offered and refused was recorded. If the daily residue exceeded 10% of the total offered for ewes fed the high-salt diet, the amount fed the following day was reduced by 100 g; if no residue was present, the amount fed the following day was increased by 100 g. Ewes in the group fed the control diet were paired with individuals in the high-salt group based on body weight, and their organic matter intake was restricted to match that of the voluntary intake of their high-salt pair from the previous day. Feed refusals were bulked together over 1 week for analysis and dried at 65°C for 24 h. Dry matter and organic matter contents of the refusals were determined as described elsewhere (Masters et al., Reference Masters, Rintoul, Dynes, Pearce and Norman2005). A second ultrasound scan was conducted on day 78 to confirm pregnancy in all ewes. Blood samples by venipuncture of the jugular vein were taken on day 0, 21, 51, 79, 115 and 140 of gestation for hormone analysis, haematocrit and glucose concentrations. Animals were also weighed on these days. At parturition, lambs were weighed within 4 h of birth and the crown-to-rump length measured as an indication of foetal bone growth. Udder volume was determined within 1 week of birth using measurements taken longitudinally over the left and right teats (Bencini and Purvis, Reference Bencini and Purvis1990). A 5 ml milk sample from each teat was also taken by injecting 1 IU of synthetic oxytocin (Lyppards, Thebarton, South Australia) intramuscularly. Samples were frozen for later analysis of fat and protein using a Milko Scan 133 (Foss Electric, Hillerod, Denmark) calibrated for sheep as described by Bencini (1999).
Hormone assays
Plasma leptin was measured in duplicate by a double-antibody radioimmunoassay (Blache et al., Reference Blache, Tellam, Chagas, Blackberry, Vercoe and Martin2000). All samples were processed in a single assay and the limit of detection was 0.06 ng/ml. The assay included six replicates of three control samples containing 0.43, 0.98 and 1.68 ng/ml, which were used to estimate the intra-assay coefficients of variation of 6.1%, 6.0% and 6.5%, respectively.
Plasma insulin was assayed in duplicate by a double-antibody radioimmunoassay (Tindal et al., Reference Tindal, Knaggs, Hart and Blake1978) that had been validated for sheep plasma (Miller et al., Reference Miller, Blache and Martin1995). All samples were processed in a single assay and the limit of detection was 0.78 μU/ml. Six replicates of three control samples containing 2.45, 3.63 and 8.70 μU/ml were included in the assay and were used to estimate the intra-assay coefficients of variation of 7.5%, 2.2% and 3.5%, respectively.
Concentrations of tri-iodothyronine (T3) and thyroxine (T4) were measured using a double-antibody radioimmunoassay (Dawson et al., Reference Dawson, Deeming, Dick and Sharp1996) and validated for sheep plasma (Zhang et al., Reference Zhang, Blache, Blackberry and Martin2005). The samples for T3 were assayed as duplicate 20 μl aliquots with the limit of detection 0.3 ng/ml, whereas those for T4 were assayed as duplicate 20 μl (1 : 40 dilution) aliquots with the limit of detection 0.25 nM/l. Four replicates of two control samples containing 0.87 and 1.34 ng/ml were included in the T3 assay and were used to estimate the intra-assay coefficients of variation of 4.6% and 7.1%, respectively. Five replicates of two control samples containing 10.8 and 18.7 nM/l were included in the T4 assay and were used to estimate the intra-assay coefficients of variation of 6.9% and 3.7%.
Concentration of progesterone in the plasma was measured in a single assay using a double-antibody radioimmunoassay after extraction with hexane (Gales et al., Reference Gales, Williamson, Higgins, Blackberry and James1997). Intra-assay variation was 6.7% at 1.03 ng/ml, 5.3% at 2.18 ng/ml and 5.2% at 4.10 ng/ml. The limit of detection was 0.10 ng/ml.
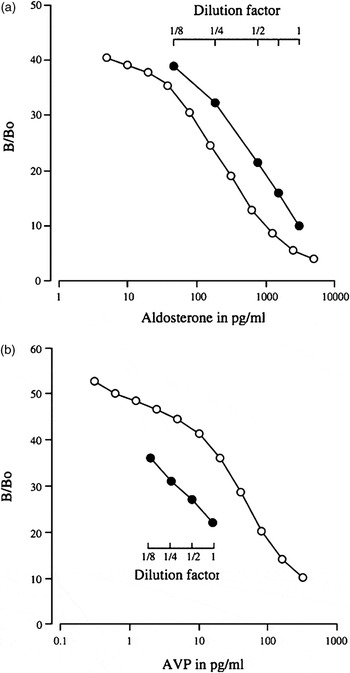
Concentration of AVP in the plasma was measured using a double-antibody radioimmunoassay after extraction following the assay procedure for arginine vasotocin (Rice, Reference Rice1982). AVP (Sigma-Aldrich Pty. Ltd, Sydney, Australia) was labelled with 125I (ANSTO, Menai, NSW, Australia) using the chloramine-T method (Greenwood and Hunter, Reference Greenwood and Hunter1963). The first antibody, raised in a rabbit against AVP, reacts with rat, mouse, human, sheep and rabbit and has less than 1% reactivity to oxytocin (Fitzgerald Industries International, Concord, MA, USA). Plasma samples (1 ml) were extracted by reverse-phase liquid chromatography using Maxi-clean C18, 300 mg cartridges (Alltech, Dandenong South, Victoria, Australia) eluted with acetonitrile and 4% acetic acid (75/25). The extract was dried under compressed air at 37°C and reconstituted in 500 μl of 0.1 M phosphate buffer (pH 7.5). Duplicates of 200 μl were added with 100 μl of 0.1 M phosphate buffer and 100 μl of 0.1 M phosphate + 0.5% bovine serum albumin (BSA) (pH 7.5). After addition of 50 μl of the first antibody the sample was diluted 1 in 30,000 in 0.1 M phosphate and incubated overnight at 4°C. Iodinated AVP (50 μl) was then diluted in 0.1 M phosphate to create approximately 5000 cpm/tube was added and incubated overnight at 4°C. After addition of 100 μl of donkey anti-rabbit serum (one in 15 in 0.1 M phosphate) containing one in 800 normal rabbit serum and 500 μl of 10% polyethylene glycol, the tubes were incubated overnight at 4°C and spun to separate free from bound AVP. The extraction efficiency was 80% as determined from pooled samples spiked with 125I-AVP and incubated for 60 min at 37 °C before extraction. The assay was validated for sheep plasma by checking for parallelism using a serial dilution of pooled samples of sheep plasma and measuring AVP in sheep with access to water or with no access to water for 24 h (Figure 1).
Standard curves for radioimmunoassay for (a) aldosterone and (b) arginine vasopressin (AVP) showing parallelism with serial dilution of sheep plasma.

Concentration of aldosterone in plasma was measured using a radioimmunoassay described previously by James and Wilson (Reference James and Wilson1976) and modified at The University of Western Australia. Briefly, aldosterone was extracted from 200 μl of plasma and from aldosterone standards (Sigma-Aldrich Pty. Ltd) using 2 ml dichloromethane (BDH, Australia) by vortexing for 5 min. After freezing the plasma using a dry ice/acetone bath, the solvent was transferred in a new tube and dried with compressed air at 37°C. The dried extracts were reconstituted in 200 μl phosphate buffered saline (PBS) + 0.5% BSA (pH 7.5) and added with 100 μl of rabbit anti-aldosterone-3-BSA (1 : 30 000 in PBS + 0.5% BSA, Fitzgerald Industries International). The antisera cross reactivity was 1.1% with 11-deoxycorticosterone, 0.01% with testosterone and less than 0.001% with estradiol, 11-deoxycortisol, androsterone, 21-deoxycortisol, oestriol, cortisone, oestrone and dihydrotesterone (Fitzgerald Industries International). Following addition of antisera, 100 μl of tracer (approximately 10 000 dpm/tube in PBS, (1,2,6,7-)3H-aldosterone; Amersham, Australia) in PBS + 0.5% BSA was added. The tubes were incubated at 4°C for 48 h and then the free and bound aldosterone were separated using 200 μl of Dextran-coated charcoal method (1% charcoal, 0.1% Dextran, Sigma, USA). After addition of 2 ml of scintillant (Starcint; Packard Chemical Operations, USA), the radioactivity of the supernatant was counted in a liquid scintillation counter (Tri Carb 1500; Packard, Downers Grove, IL, USA) for 3 min. The extraction efficiency was greater than 95%, as determined from pooled samples spiked with 3H-aldoterone and incubated for 60 min at 37°C before extraction. The assay was validated for sheep plasma by checking for parallelism using a serial dilution of pooled samples of sheep plasma and measuring aldosterone in sheep with access to water or with no access to water for 24 h (Figure 1).
Data analysis
The data were analysed using Genstat 8th Edition (Lawes Agricultural Trust, Rothamsted, UK). Pregnancy rates were analysed using the χ 2 test. Hormone concentrations, live weight and feed intake were analysed by repeated measure analysis of variance, using conservative F-tests, with the AVP and aldosterone concentration log transformed and progesterone transformed to the fourth root in order to better approximate the assumption of homogeneity of variance. Lamb birth weight, crown-to-rump measurement and milk composition were analysed by analysis of variance.
Results
Feed and water intake
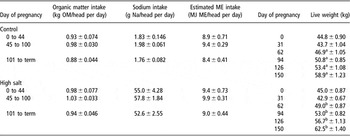
Pair-feeding was successfully achieved, as feed intake did not differ between the two dietary treatments (Table 2). The estimated average energy ME intake for ewes fed the control and high-salt diets was 8.9 ± 0.47 MJ ME/head per day and 9.4 ± 0.49 MJ ME/head per day, respectively. Sodium intake was 1.9 ± 0.096 g Na/head per day and 55.1 ± 2.89 g Na/head per day for the control and high-salt groups, respectively. The ewes fed the high-salt diet weighed 3 kg more (P < 0.05) than their counterparts from the second month of pregnancy to parturition (Table 2). By 25 days from insemination, ewes fed the high-salt diet drank 4.0 ± 0.01 l of water/head per day, while ewes fed the control diet drank 2.43 ± 0.145 l of water/head per day.
Organic matter intake, sodium intake and live weight (mean ± s.e.)

ME = metabolisable energy; OM = organic matter.
a,bDifferences (P < 0.05) between the two groups at a given stage of pregnancy are shown by different superscripts.
Reproductive performance
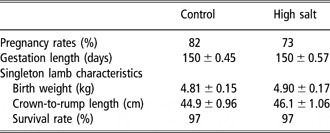
Pregnancy rates were not significantly affected by feeding the high-salt diet throughout pregnancy (Table 3). Approximately 60% of the original group of ewes were single-bearing and 17% were twin-bearing. There were no significant differences in gestation length (overall mean 150.1 days), lamb weight (mean 4.85 ± 0.16 kg) and crown-to-rump measurements (mean 45.5 ± 1.01 cm) between treatment groups (Table 3).
Reproductive performance of ewes fed a high-salt or control diet

Pregnancy rate was measured on day 44 of gestation. Characteristic of the singleton lambs used in the study were measured at birth. Survival rate was measured at weaning.
Udder volume was not different between the two treatments (high-salt; 1487 ± 121 ml, control; 1670 ± 232 ml) and there was no difference between fat and protein content in the milk samples between the two treatments (fat: high-salt, 8.1 ± 0.38%; control, 8.8 ± 0.41% and protein: high-salt, 4.7 ± 0.13%; control, 4.8 ± 0.22%).
Endocrine and metabolic changes
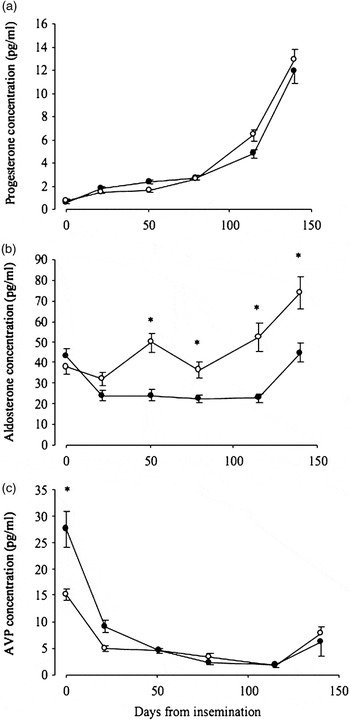
Plasma progesterone concentration was not different between the two treatments (Figure 2). Prior to pregnancy, progesterone was low (0.69 ± 0.13 ng/ml and 0.47 ± 0.08 ng/ml for control and high-salt ewes, respectively), before rising slowly to 2.6 ng/ml by day 79. Progesterone concentration then increased more rapidly, reaching 5.6 ± 0.45 ng/ml on day 115 and 12.4 ± 1.06 ng/ml on day 140.
Plasma concentrations of progesterone, aldosterone and arginine vasopressin (AVP) during pregnancy in ewes fed a control or high-salt diet. Asterisks denote differences (P < 0.05) between groups at a given stage of pregnancy. Open circles: control group; closed circles: ewes fed high-salt diet.

Prior to insemination, plasma concentrations of aldosterone were not different between ewes fed the high-salt diet (43 ± 4.1 pg/ml) and ewes fed the control diet (38 ± 3.8 pg/ml). Concentrations of aldosterone of ewes fed the high-salt diet were lower than that of ewes fed the control diet during pregnancy (27 ± 2.7 v. 49 ± 5.4 pg/ml P < 0.05; Figure 2). In the last month of pregnancy, plasma concentrations of aldosterone increased by approximately 20 pg/ml in ewes fed both diets but were still higher (P < 0.05) in the ewes fed the high-salt diet than in ewes fed the control diet (74 ± 7.9 v. 45 ± 4.6 pg/ml).
Prior to pregnancy, plasma concentrations of AVP were high in both groups of ewes and then decreased during early and mid pregnancy by approximately 18 pg/ml for ewes fed the high-salt diet and 10 pg/ml for the ewes fed the control diet; however, AVP concentrations were not different between the two dietary treatments during pregnancy (Figure 2). AVP concentration remained relatively constant until the last month of pregnancy where there was an increase of approximately 5 pg/ml in both groups (to 7 pg/ml).
Glucose concentrations did not differ between ewes fed the high-salt diet or ewes fed the controls. At day 21 of gestation, glucose concentration averaged 4.2 ± 0.14 mmol/l and at day 106 it averaged 3.2 ± 0.10 mmol/l. There were no differences in haematocrit values between groups at any stage of pregnancy, ranging from 28% to 34%.
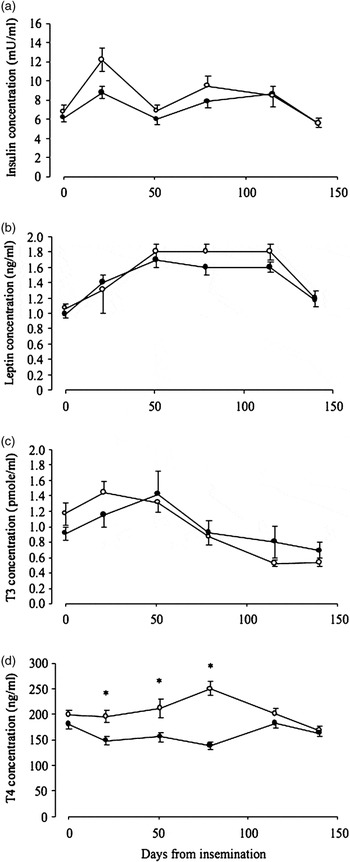
Overall, ewes that were fed the high-salt diet had a lower concentration of leptin (P < 0.05) and insulin (P < 0.02) than the control ewes (1.4 ± 0.09 v. 1.5 ± 0.12 ng/ml; and 7.2 ± 0.55 v. 8.2 ± 0.83 ng/ml). Insulin concentrations for control ewes were higher in the first half of gestation before declining to the same concentration as the ewes fed high salt by day 115 of gestation (Figure 3). Leptin concentration on the other hand was similar between the two treatment groups during the first third of gestation (at 1.19 ng/ml) but at day 51 of gestation leptin concentrations of control ewes increased above that of ewes fed the high-salt diet (1.8 ± 0.1 v. 1.7 ± 0.1 ng/ml; Figure 3). Both leptin and insulin decreased between days 115 and 140 of gestation for both control and high-salt ewes (from 1.7 ± 0.1 to 1.19 ± 0.09 ng/ml; and from 8.5 ± 0.9 to 5.6 ± 0.5 ng/ml).
Plasma concentrations of insulin, leptin, T3 and T4 during pregnancy in ewes fed a control or high-salt diet. Asterisks denote differences (P < 0.05) between groups at a given stage of pregnancy. Open circles: control group; closed circles: ewes fed high-salt diet.

There was an interaction between time and dietary treatment on concentration of T3 (P < 0.02). In the first third of gestation (day 0 to 50), the plasma concentration of T3 was lower in the ewes fed the high-salt diet than that in the ewes fed the control diet (1.2 ± 0.18 v. 1.3 ± 0.14 pmol/ml; Figure 3). During the second third of gestation (day 51 to 115), the concentration of T3 was similar in both treatment groups (0.92 ± 0.16 v. 0.87 ± 0.1 pmol/ml). However, in the last third of gestation (day 116 to 140) the plasma concentration of T3 was higher in the ewes fed the high-salt diet than that in the ewes fed the control diet (0.8 ± 0.16 v. 0.6 ± 0.06 pmol/ml). The concentration of T4 in ewes fed the high-salt diet was lower than that of ewes fed the control diet up to day 115 (162 ± 8.6 v. 212 ± 13 ng/ml; P < 0.001) but, by day 140, the T4 concentrations were similar for both groups (166 ng/ml).
Discussion
Feeding Merino ewes a high-salt (13% NaCl) diet from the time of conception until parturition did not compromise reproductive efficiency. The ewes fed the high-salt diet produced lambs with normal crown-to-rump length, birth weight and milk with similar composition, indicating they were able to adequately regulate salt and water balance and adapt metabolically to the challenges associated with high salt ingestion.
The high-salt ewes were heavier, probably as a consequence of water retention as feed intake of the ewes did not differ between groups (they were pair-fed). An increase in water retention could be associated with an increase of 10% to 15% (3 to 5 kg) in total body water normally associated with osmotic regulation in sheep consuming high-salt feed (Warren et al., Reference Warren, Casson and Barrett-Lennard1995) or an increase in muscle deposition associated with a higher flow of protein to the small intestine in sheep fed high salt (Hemsley et al., Reference Hemsley, Hogan and Weston1975; Masters et al., Reference Masters, Rintoul, Dynes, Pearce and Norman2005), as changes in body water, protein and fat do occur during pregnancy (Masters and Mata, Reference Masters and Mata1996). It is possible that the live weight of the high-salt ewes could reflect an increase in the weight of the foetuses and placental components, but it is unlikely as the mean birth weights of the lambs from different dietary treatments did not differ.
Ingestion of high salt had a specific effect on both insulin and leptin concentrations that could not be attributed to differences in feed intake or body weight. A strong direct effect of salt (dietary intake or infused) on insulin concentration has been reported in non-pregnant humans (Goodfriend et al., Reference Goodfriend, Ball, Weinberger, Moore, Weder and Egan1991) but the mechanism is not known. An earlier study with wethers found that plasma concentrations of insulin concentration decreased in wethers fed 20% NaCl for 14 days (Blache et al., Reference Blache, Grandison, Masters, Dynes, Blackberry and Martin2007) and our results extend the work by Blache et al. (Reference Blache, Grandison, Masters, Dynes, Blackberry and Martin2007) by showing a persistent (i.e. longer term) effect of salt ingestion on insulin secretion in sheep. In the study of Blache et al. (Reference Blache, Grandison, Masters, Dynes, Blackberry and Martin2007), the drop in insulin concentration with high salt ingestion with wethers was associated with lower glucose concentration, but this was not observed in the current study. However, this may have been due to a different physiological regulation during pregnancy whereby a higher maternal glucose concentration was maintained in order to meet the demands of the foetus. It would appear that the ewes were consuming sufficient energy to meet the energy requirements for maternal tissue and foetal growth (McDonald et al., Reference McDonald, Edwards, Greenhalgh and Morgan1995), and thus were able to maintain glucose concentrations. Therefore, the lower insulin concentrations in pregnant ewes that consumed a high-salt diet did not lead to an increase in maternal glucose concentration.
In contrast to observations obtained with wethers (Blache et al., Reference Blache, Grandison, Masters, Dynes, Blackberry and Martin2007), high salt consumption decreased leptin concentrations in pregnant ewes independent of both the level of food intake (because they were pair fed) or body weight (similar between the two groups). Our study illustrates that another mechanism must have been operating to reduce leptin concentrations rather than the classical regulation of plasma leptin by voluntary feed intake (e.g. Woods et al., Reference Woods, Benoit, Clegg and Seeley2004) or fat deposition (e.g. Chilliard et al., Reference Chilliard, Delavaud and Bonnet2005). In humans, concentrations of circulating progesterone have been correlated to plasma leptin during the menstrual cycle (Hardie et al., Reference Hardie, Trayhurn, Abramovich and Fowler1997) but, in the current study, progesterone concentrations were not different between the ewes fed the high-salt diet and the ewes fed the control diet. Another factor that decreases leptin secretion is an increase in energy expenditure (Zimmermann-Belsing et al., Reference Zimmermann-Belsing, Brabant, Holst and Feldt-Rasmussen2003). However, in the present study there was not a large difference in plasma T3 concentration between ewes fed high salt and control animals, suggesting that energy expenditure was similar between the two groups. However, plasma T4 concentrations were lower in ewes fed high salt, possibly reflecting a higher conversion of T4 to T3, which could reflect a higher metabolic rate in the ewes fed high salt.
Despite the low levels of leptin and insulin, udder volume and milk composition in week 1 of lactation were not affected. This result is consistent with Chagas et al. (Reference Chagas, Rhodes, Blache, Gore, Macdonald and Verkerk2006) where dairy cows during early lactation have extremely low insulin and leptin concentrations when milk production is at its peak. Furthermore, a study by Abu-Zanat and Tabbaa (Reference Abu-Zanat and Tabbaa2006) found no significant effect on milk production when pregnant Awassi ewes were fed a diet containing either 40% or 60% of saltbush, and Olsson et al. (Reference Olsson, Mengistu, Stein, Bekele and Bruckmaier2006) found that milk secretory mechanisms in lactating goats were unaffected by plasma hyperosmolality.
High salt consumption during pregnancy required a lowering of aldosterone concentration, but this did not involve a concomitant effect on AVP. Plasma concentrations of AVP did not increase despite high salt ingestion and the water-retaining requirements of pregnancy possibly because the ewes had free access to fresh water so the ewes were able to increase their water consumption above normal levels (Hamilton and Webster, Reference Hamilton and Webster1987; Meintjes and Olivier, Reference Meintjes and Olivier1992). Water consumption increased nearly two-fold in early pregnancy in ewes fed the high-salt diet. We were not able to quantify water consumption during the rest of pregnancy because of technical problems. The high intake of water could also explain the limited response in aldosterone because of the dilution of sodium in the rumen.
Further to the consequences of increased water intake, the lack of a large change in AVP concentration during pregnancy is likely to be also due to changes in osmolality during pregnancy and continual adjustments in the volume-sensing AVP release mechanisms (Lindheimer et al., Reference Lindheimer, Barron and Davison1989). AVP is not suppressed at the usual levels of body tonicity (at least in humans; Lindheimer and Davison, Reference Lindheimer and Davison1995), as part of the normal water-retaining mechanisms of pregnancy.
In terms of integrating saltbush into a productive system, the data show that high salt intake does not decrease the reproductive capacity of the ewe. However, this may be so only if the ewes have free access to water. In addition, there is a need to investigate the long-term effect on the offspring. The manipulation of high-salt diets in rats and cattle during pregnancy or postnatally has shown behavioural and/or physiological changes in the offspring (da Silva et al., Reference da Silva, de Noronha, de Oliveira, Malheiros and Heimann2003; Mohamed and Phillips, Reference Mohamed and Phillips2003; Curtis et al., Reference Curtis, Krause, Wong and Contreras2004). The occurrence and potential value of such foetal programming needs to be determined with sheep.
Acknowledgements
SND was supported by an Australian Postgraduate Award and CSIRO Livestock Industries scholarship. We thank Dr Julian Taylor at Biometrics SA, University of Adelaide, Waite, South Australia for the statistical analysis and Dr Roberta Bencini (University of Western Australia) for milk analysis.